Dave and I thought it would be interesting to see if case rates for hospitalization and deaths have changed much over time. This set is in ten year age groups, and while I am not sure about the impact of testing, I would think there isn’t as much change in the older groups and it definitely appears that there was a spike in hospitalization and death case rates in the summer of 2021 among the elderly. This could be Delta. Whatever it was appears to have disappeared in the fall, so maybe it is testing. Dave’s notes:
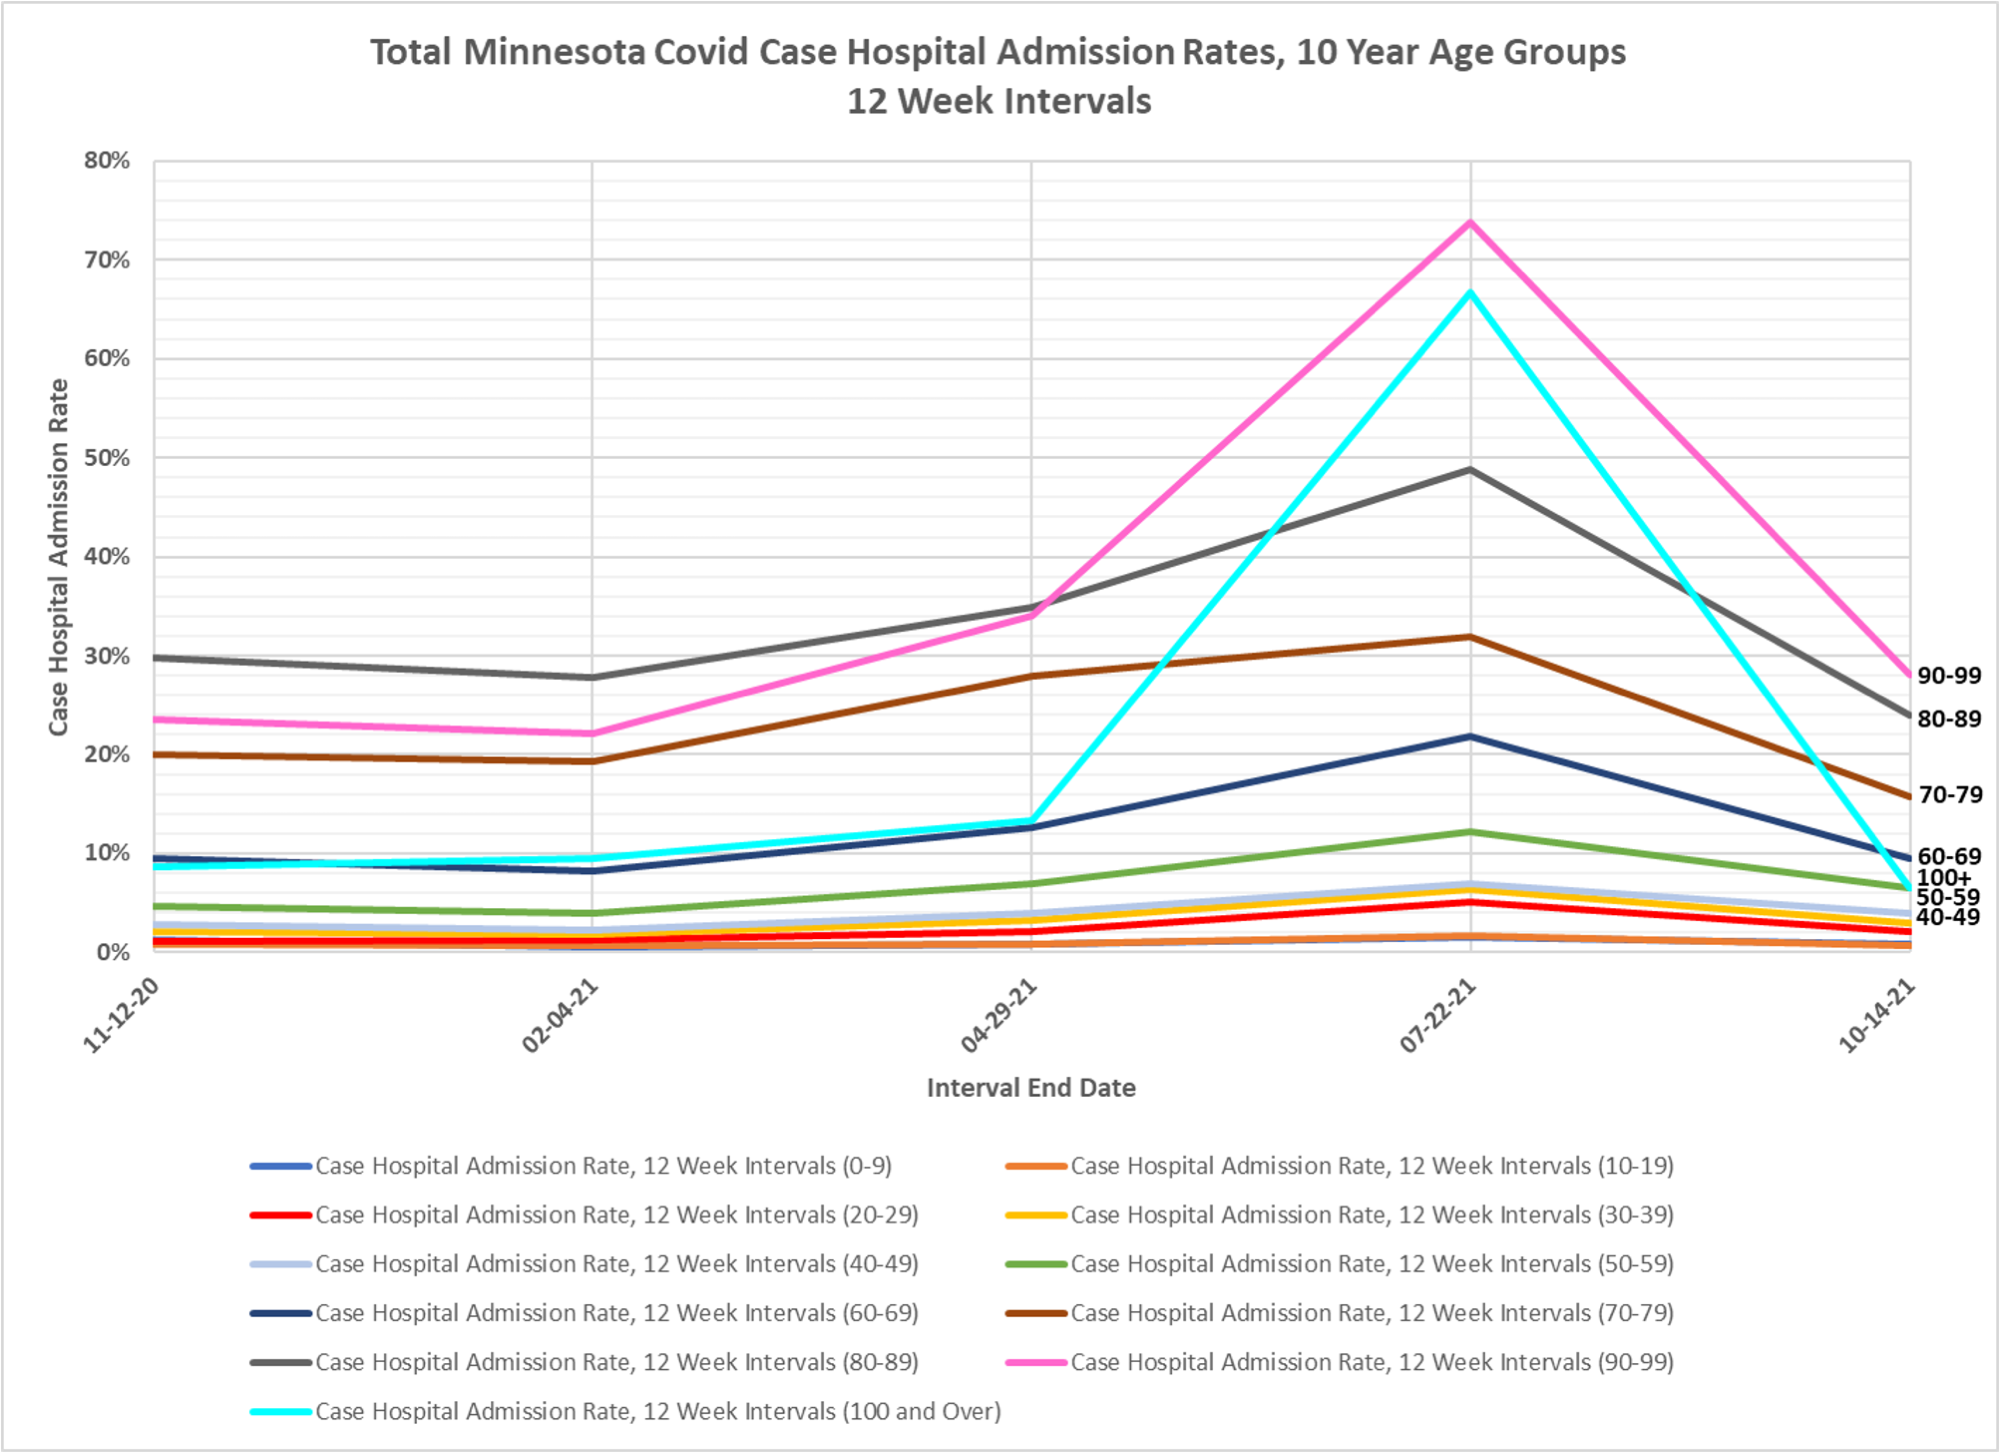
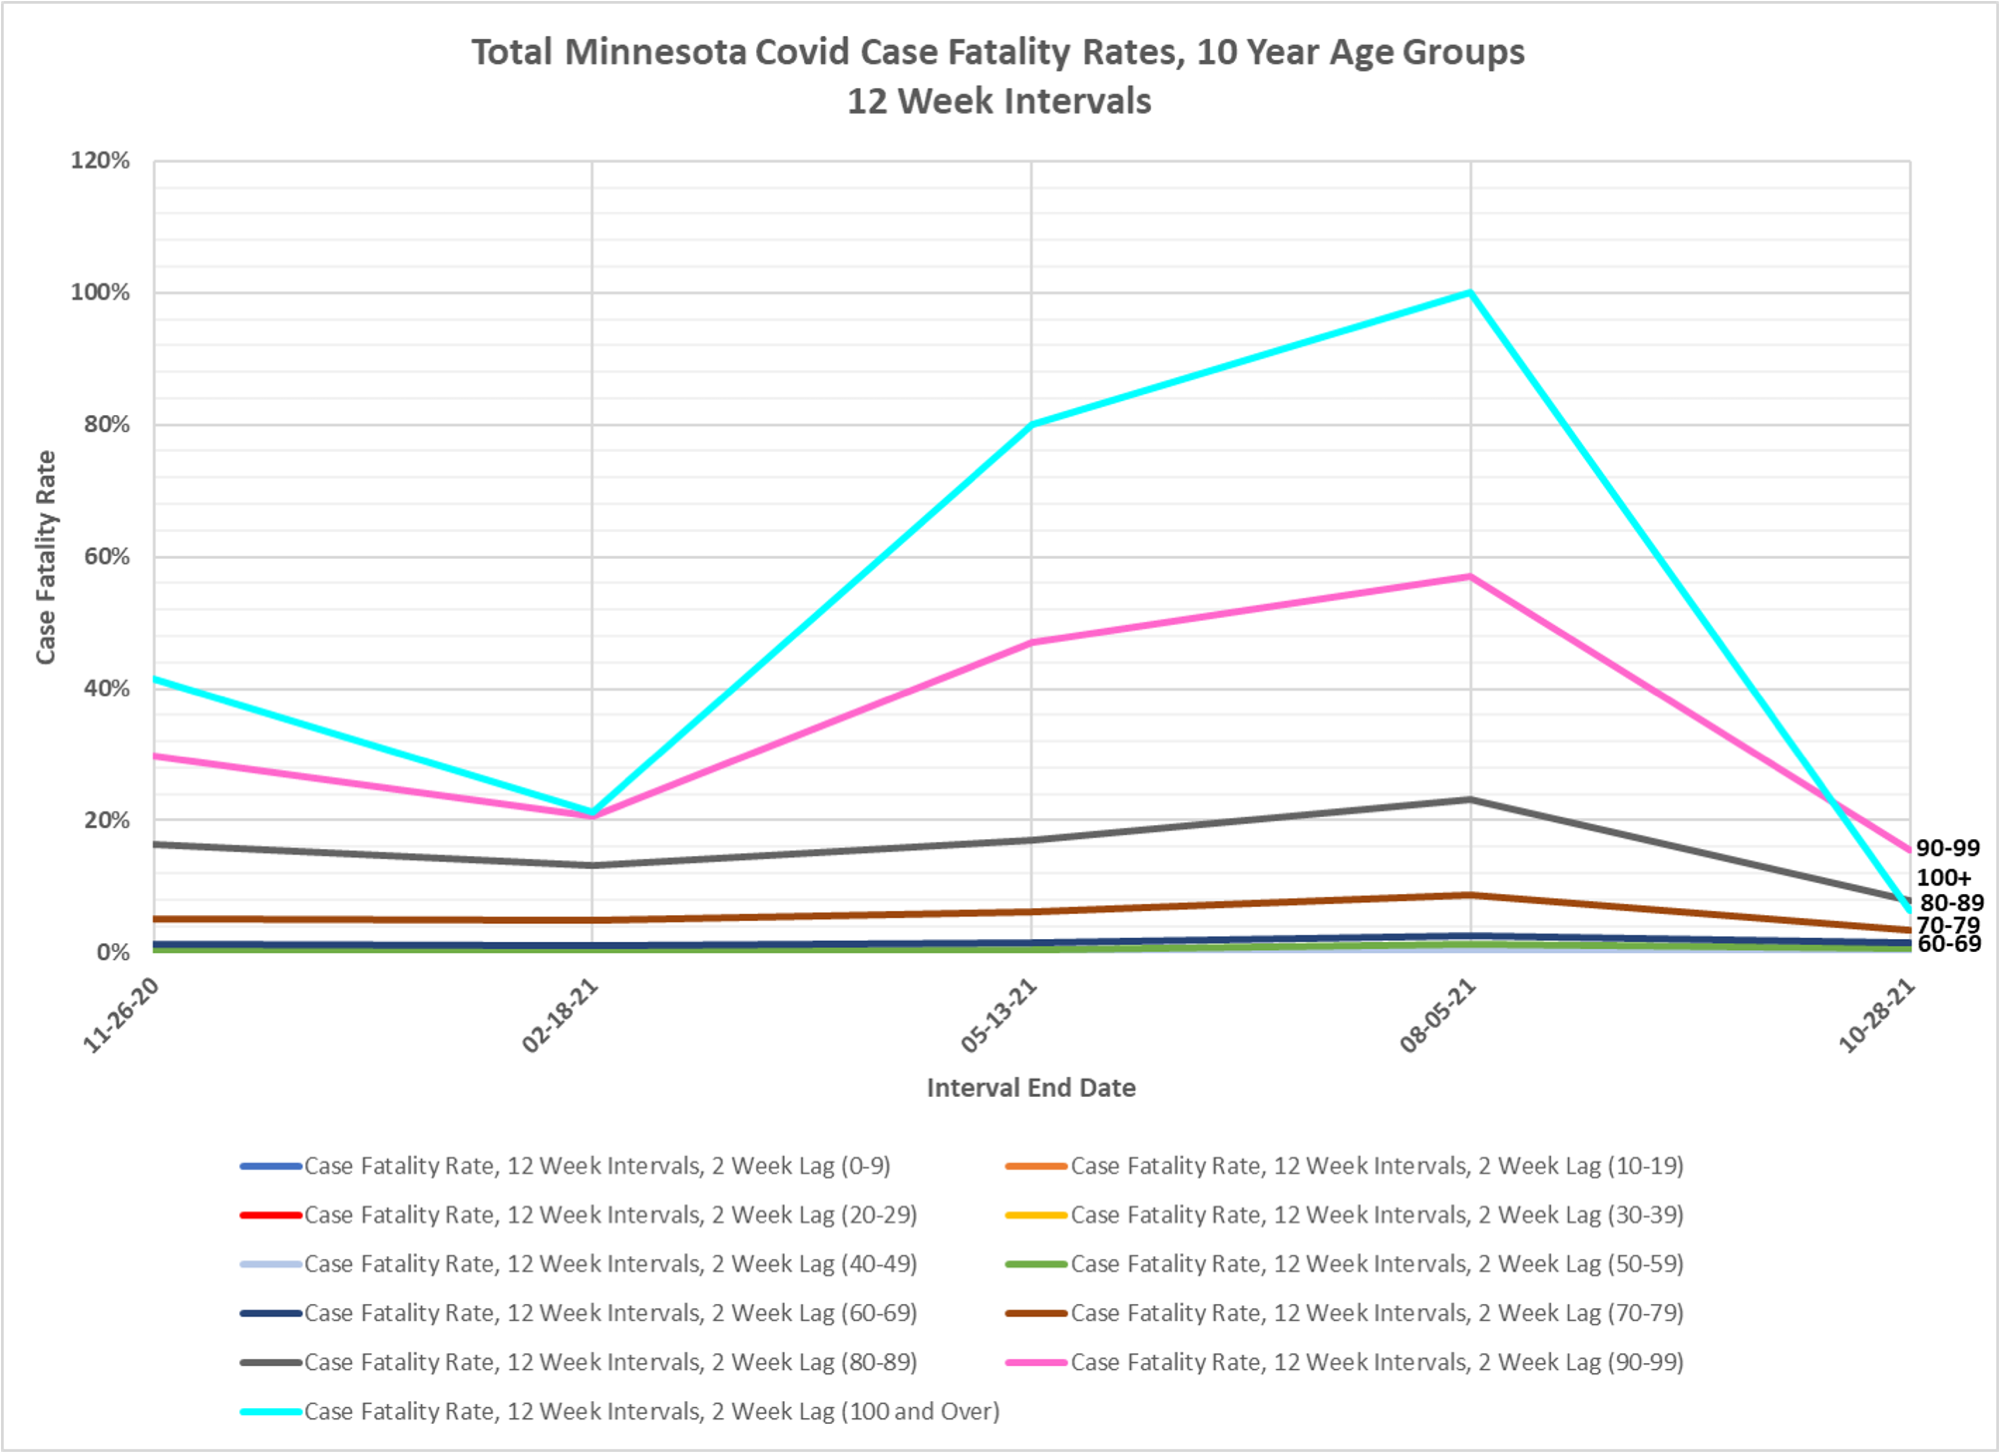
1. These charts show the total hospital admission case rate (the percent of Covid cases who are admitted to a hospital, either ICU or non-ICU) and the fatality case rate (the percent of Covid cases who pass away).
2. All date comes from the Minnesota Weekly Report: https://www.health.state.mn.us/diseases/coronavirus/stats/index.html.
3. There is no lag assumed between the positive Covid case and admission to a hospital. In other analyses we assume a 3 day lag, when daily data is available.
4. A 2 week lag is assumed from positive case to death, the same as assumed in analyses using daily data.
The generally high hospital admission cases rate for the period ending 7/22/21 is at least partially caused by the low testing rates during the summer of 2021, which led to fewer random asymptomatic cases being declared, and therefore elevated the case rates. See, for example, last week’s Age Structure Charts, Fig. 1 and 3, here: https://healthy-skeptic.com/2021/12/13/age-structure-charts-december-10/
5. On the fatality chart you will notice that I have displayed age groups all the way to 100+. The typical age structure charts, referenced above, stop at 80+ mainly so that we can occasionally publish per capita versions. Minnesota demographic data is only available up to the 80+ age group.
There are relatively few cases, hospital admissions, and deaths in the in 100+ age group because of the small population of this group, leading to the 100% fatality data point for 7/22/2021. For the 12 weeks ending 7/22/2021 there were only 3 cases and 3 deaths reported for the 100+ age group.
6. The widespread testing in Minnesota makes it difficult to discern the true trend in these rates. It would be more useful to only have testing data for symptomatic people, and evaluate case rates based on this population.