More of Dave’s excellent work keeping these updated and allowing tracking of the epidemic by age group. Dave’s notes:
1. There are 2 slides for each set of data, one showing data for the whole pandemic and a second chart showing only data since early July, 2021. Note that the full pandemic slides have different start dates, because Minnesota Department started publishing different data on different dates.
2. The data for the charts on testing, hospital admissions, and deaths comes from the Minnesota Weekly Report (available here: https://www.health.state.mn.us/diseases/coronavirus/stats/index.html). The data in the Weekly Report is presented as cumulative totals for each data type each week. I am taking weekly differences and assembling the data into charts. This data is by date of report, meaning the charts are documenting new events reported this week, even though the underlying event occurred sometime in the past. The data is provided for 5 year age groups, and I am assembling into 10 year age groups to make the charts more readable.
3. The data for the Covid cases per week come from a data file published along with the Minnesota Weekly Report, here: https://www.health.state.mn.us/diseases/coronavirus/stats/index.html#wagscd1 This data is published by date of specimen collection, rather than by date of report as the other data is. The data is provided as cases per week in 5 year age groups. I am compiling the data into 10 year age groups in order for the charts to be more readable.
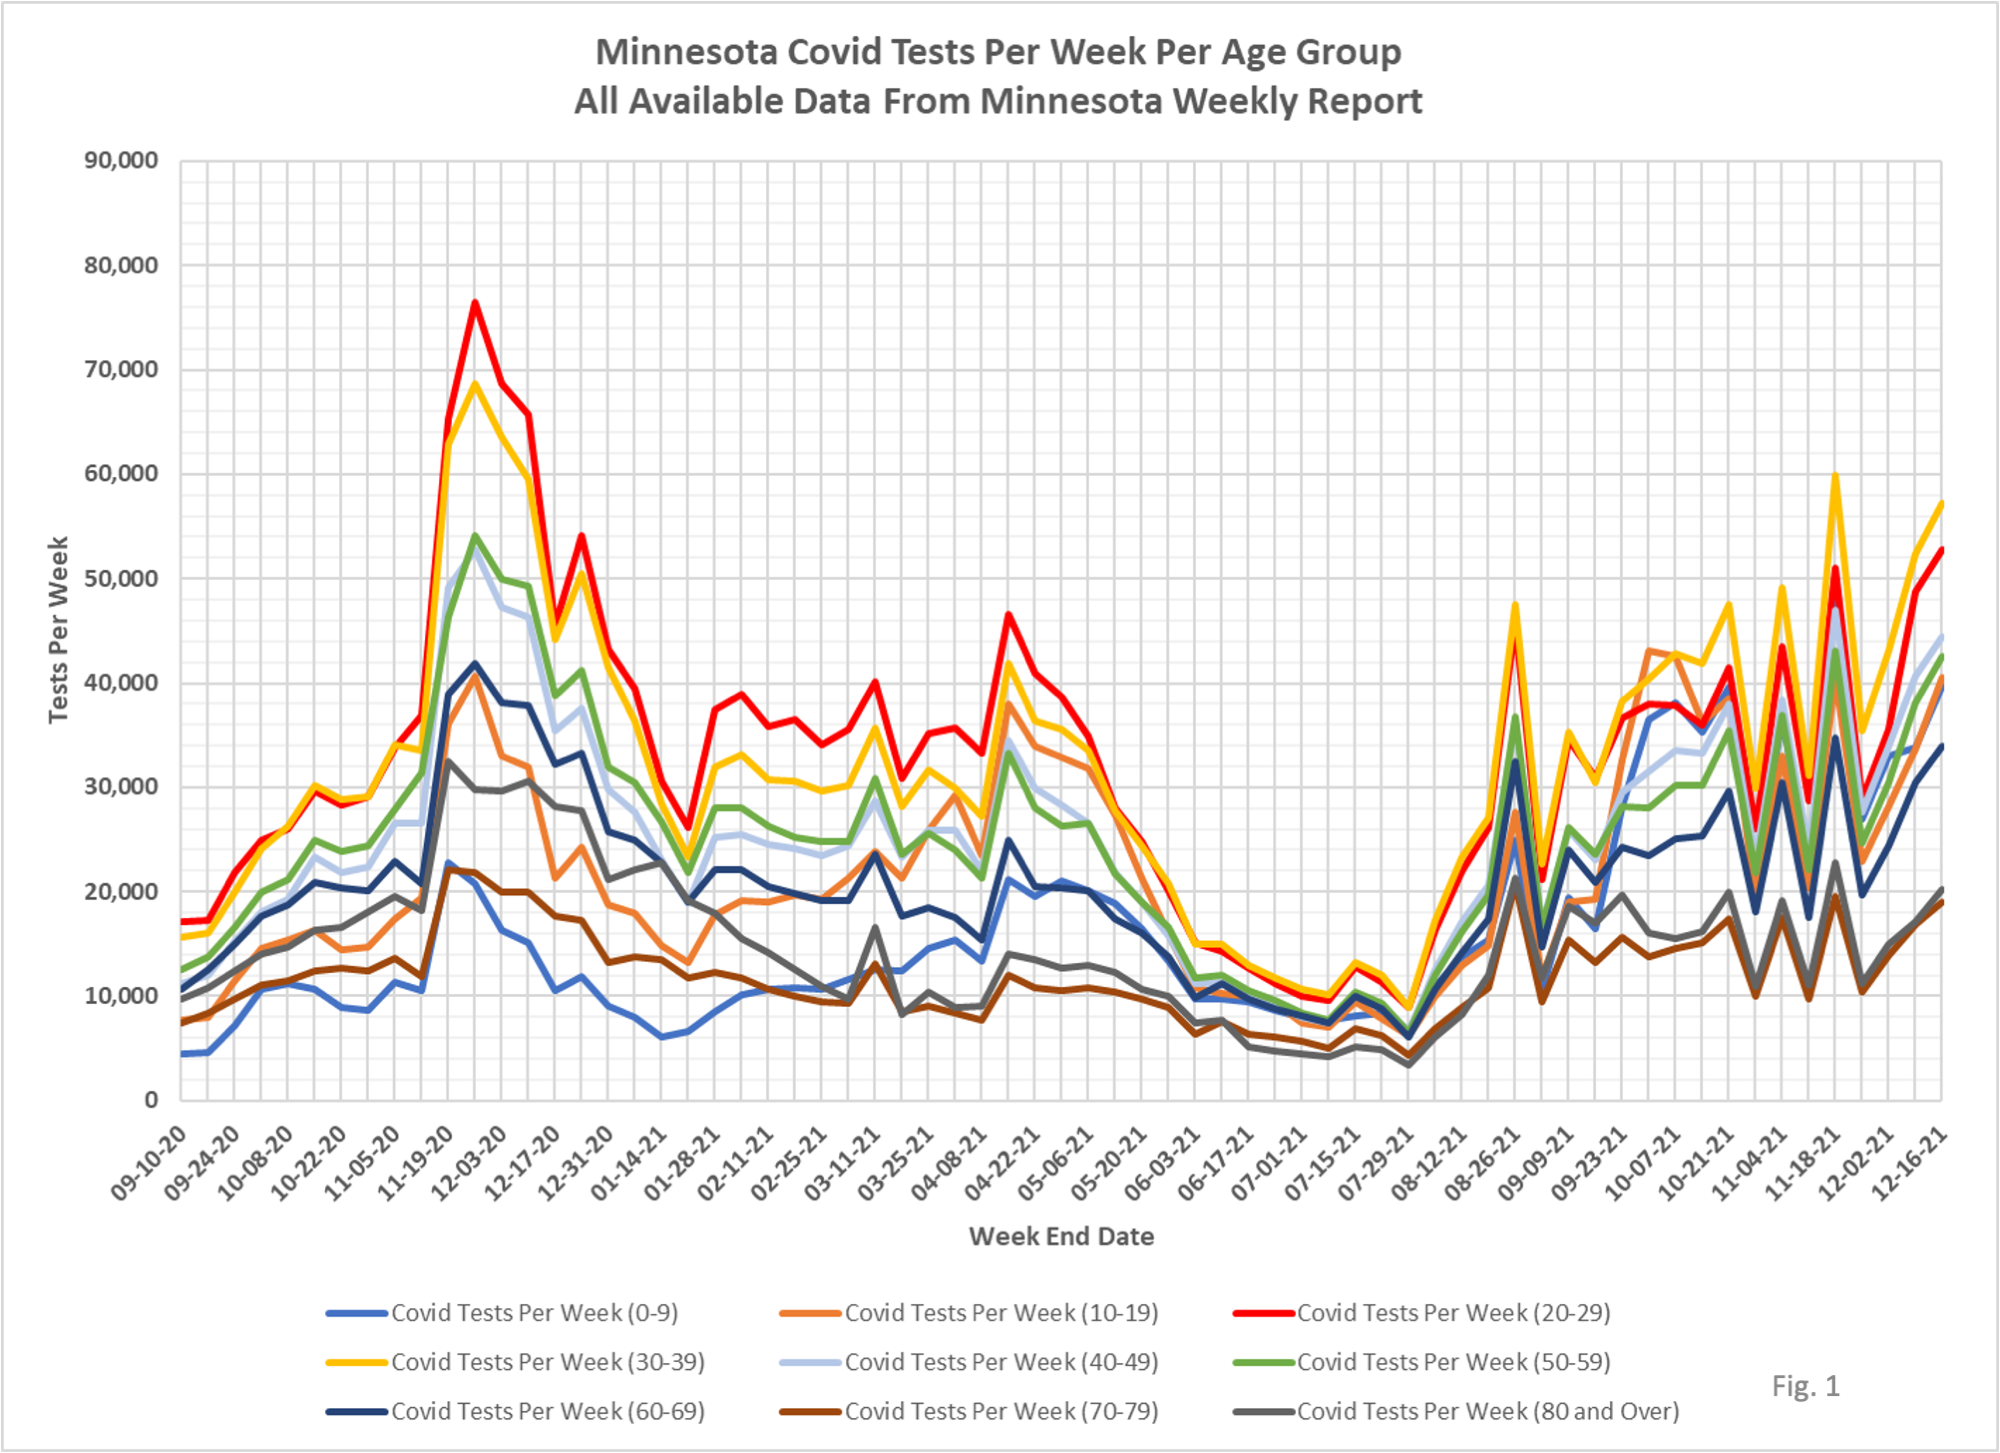
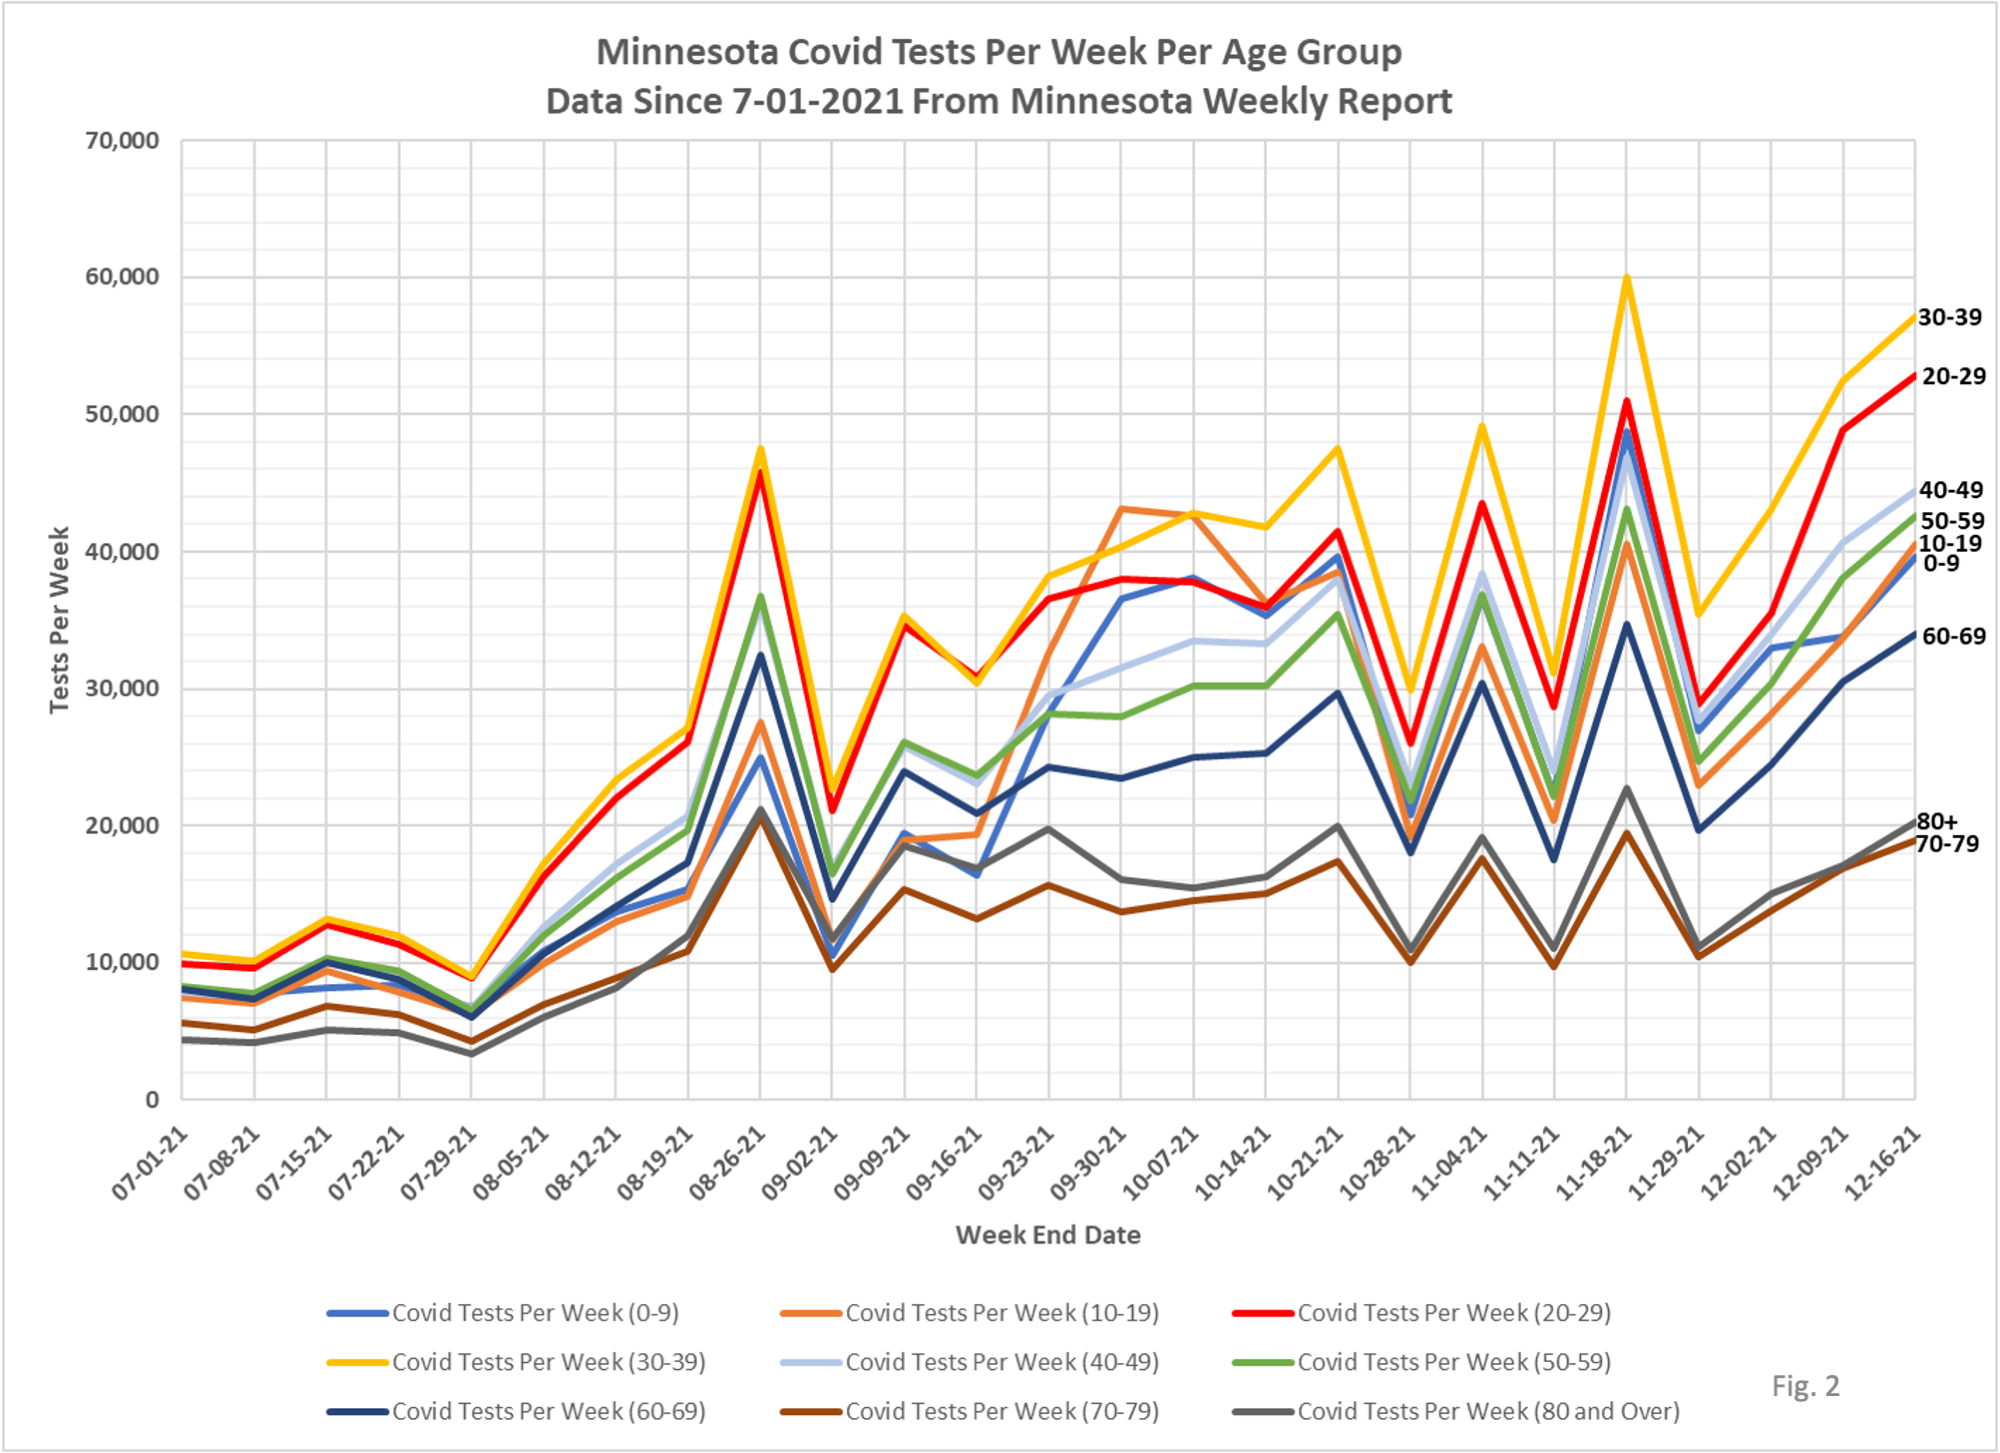
4. Fig. 1 and 2: Covid Tests Per Week. For 3 weeks now the week over week trend in testing has abandoned the prior sawtooth pattern. However, the weekly trend still does bear a lot of resemblance to the total daily testing trends as seen on the Minnesota Dial Back Dashboard https://mn.gov/covid19/data/response-prep/public-health-risk-measures.jsp.
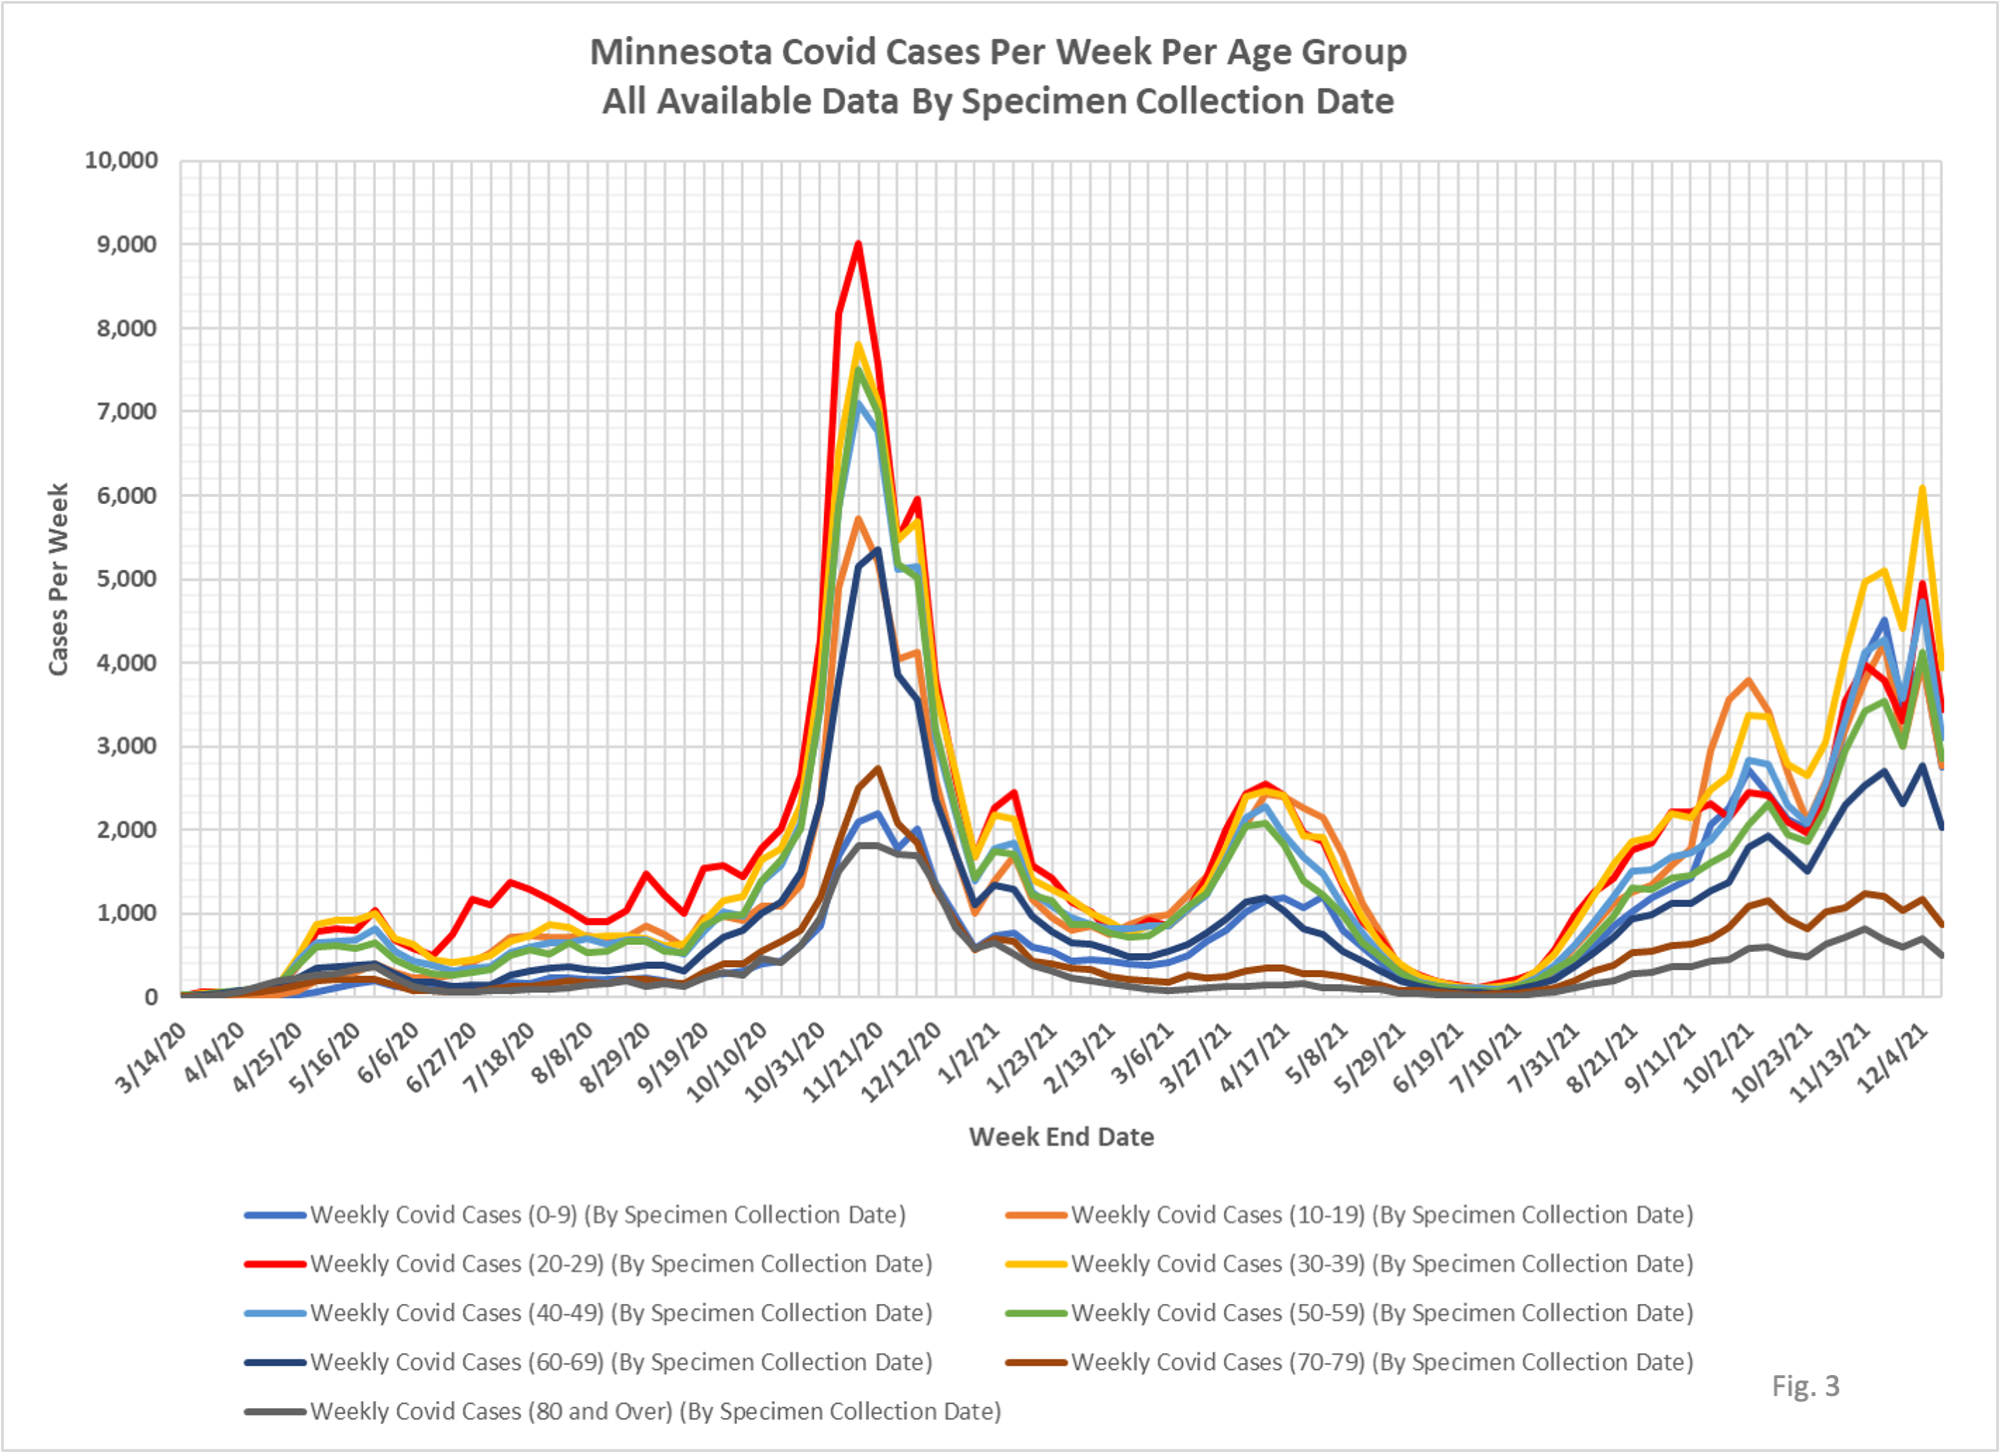
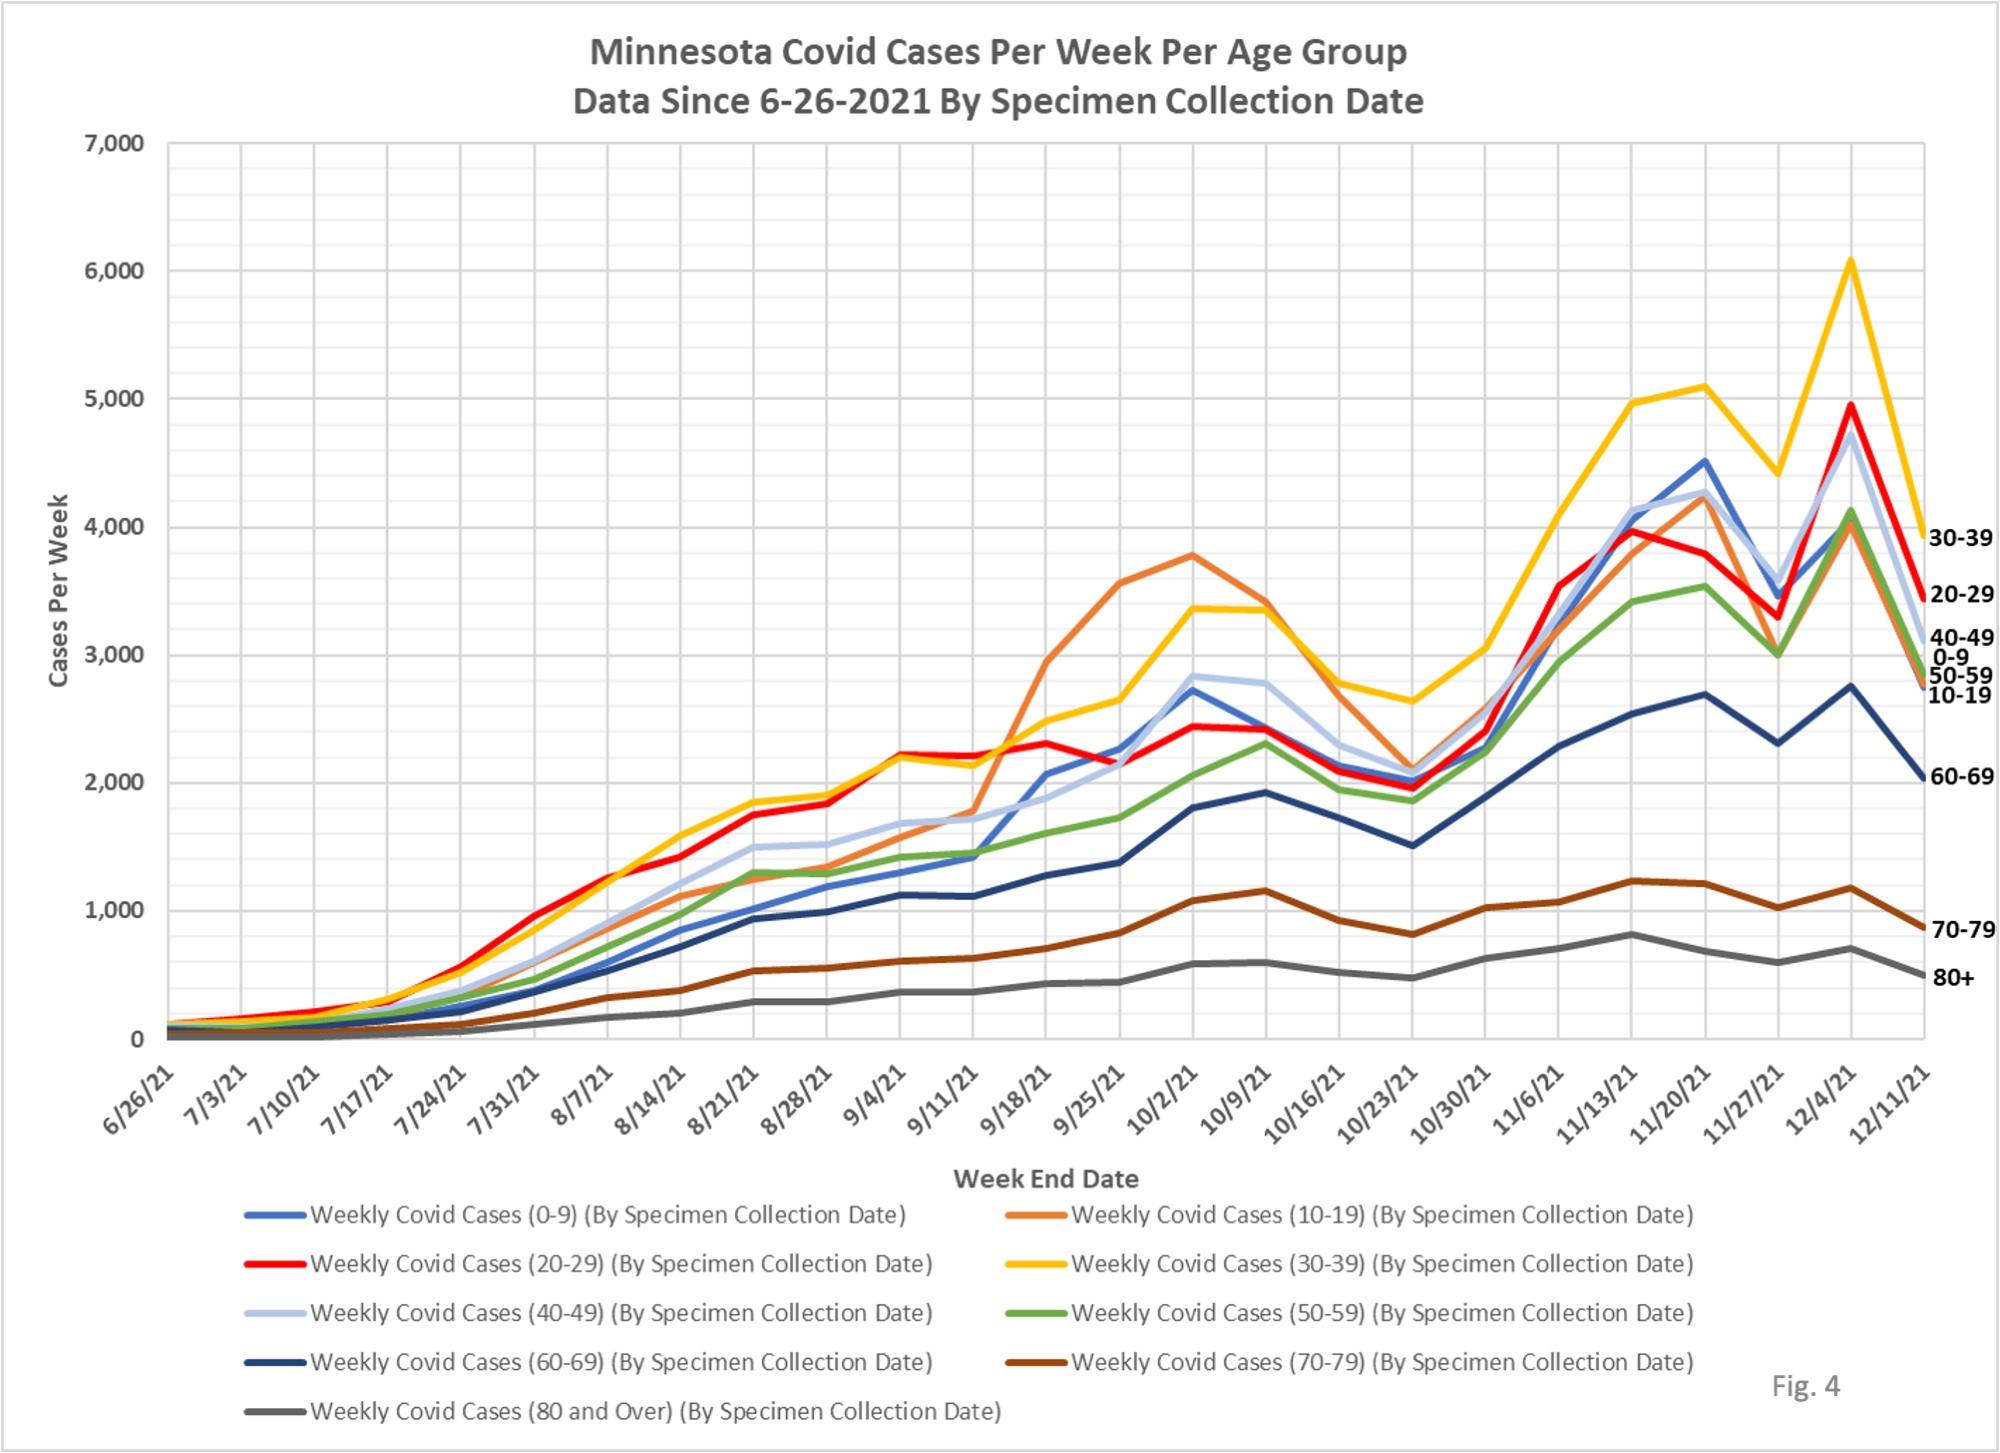
5. Fig. 3 and 4: Covid Cases Per Week. The Covid cases per week were sharply lower this week for all age groups, following the case trend seen in data published on the Situation Update page. As seen in Fig. 2 reported tests were higher this week, so hopefully the lower reported cases truly reflects the start of a downward trend in the current surge in cases. Total cases for the week were reported as 22,270, an decrease of 31.7% from last week’s total.
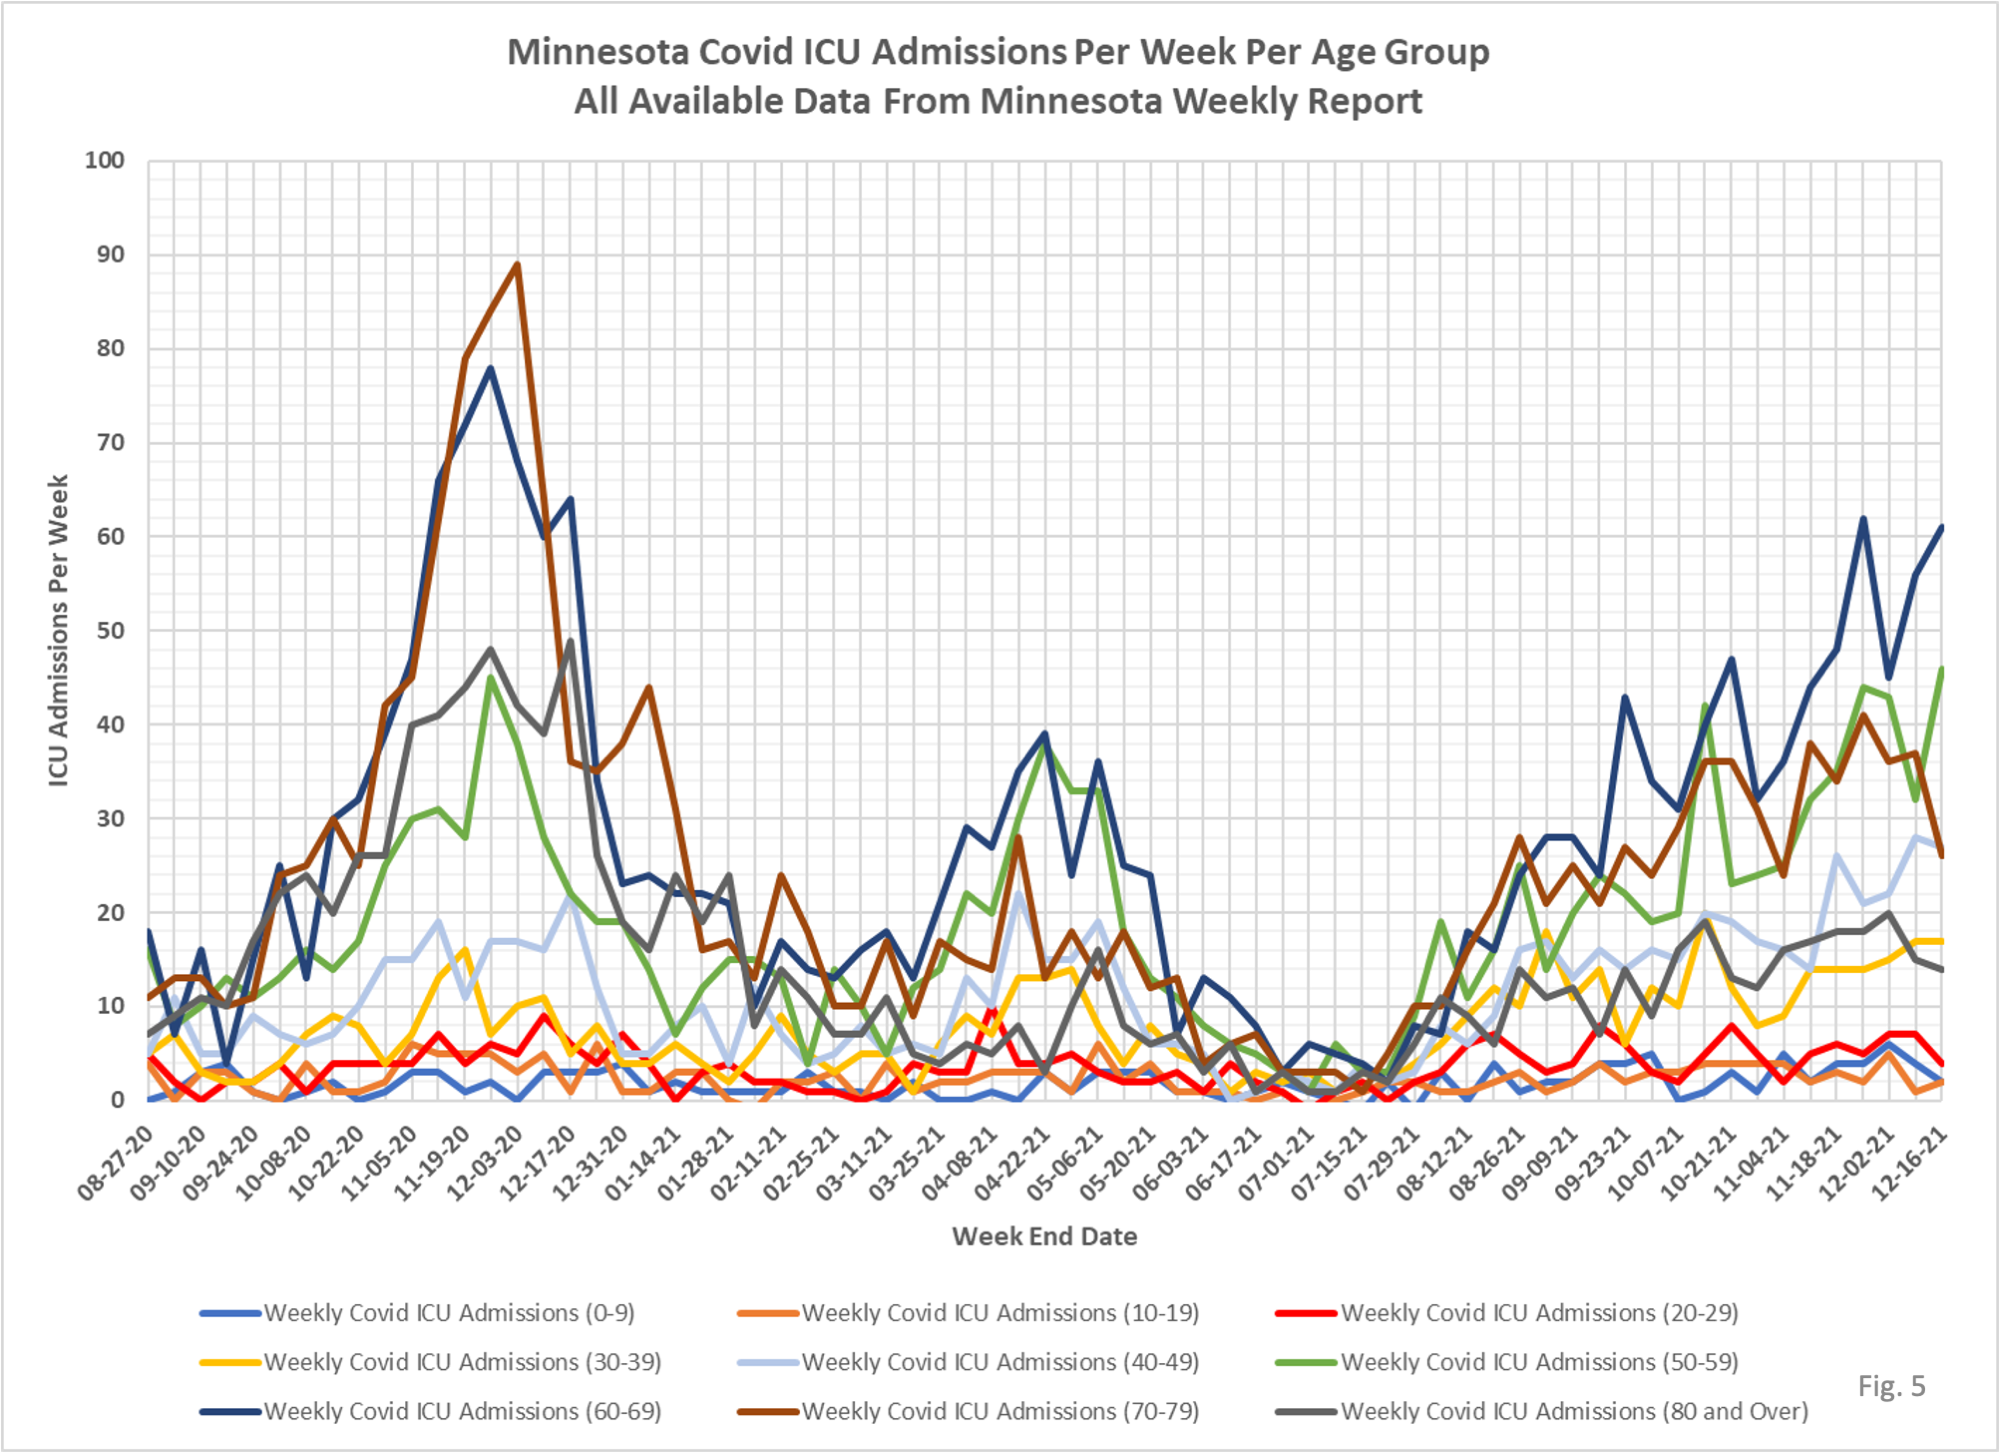
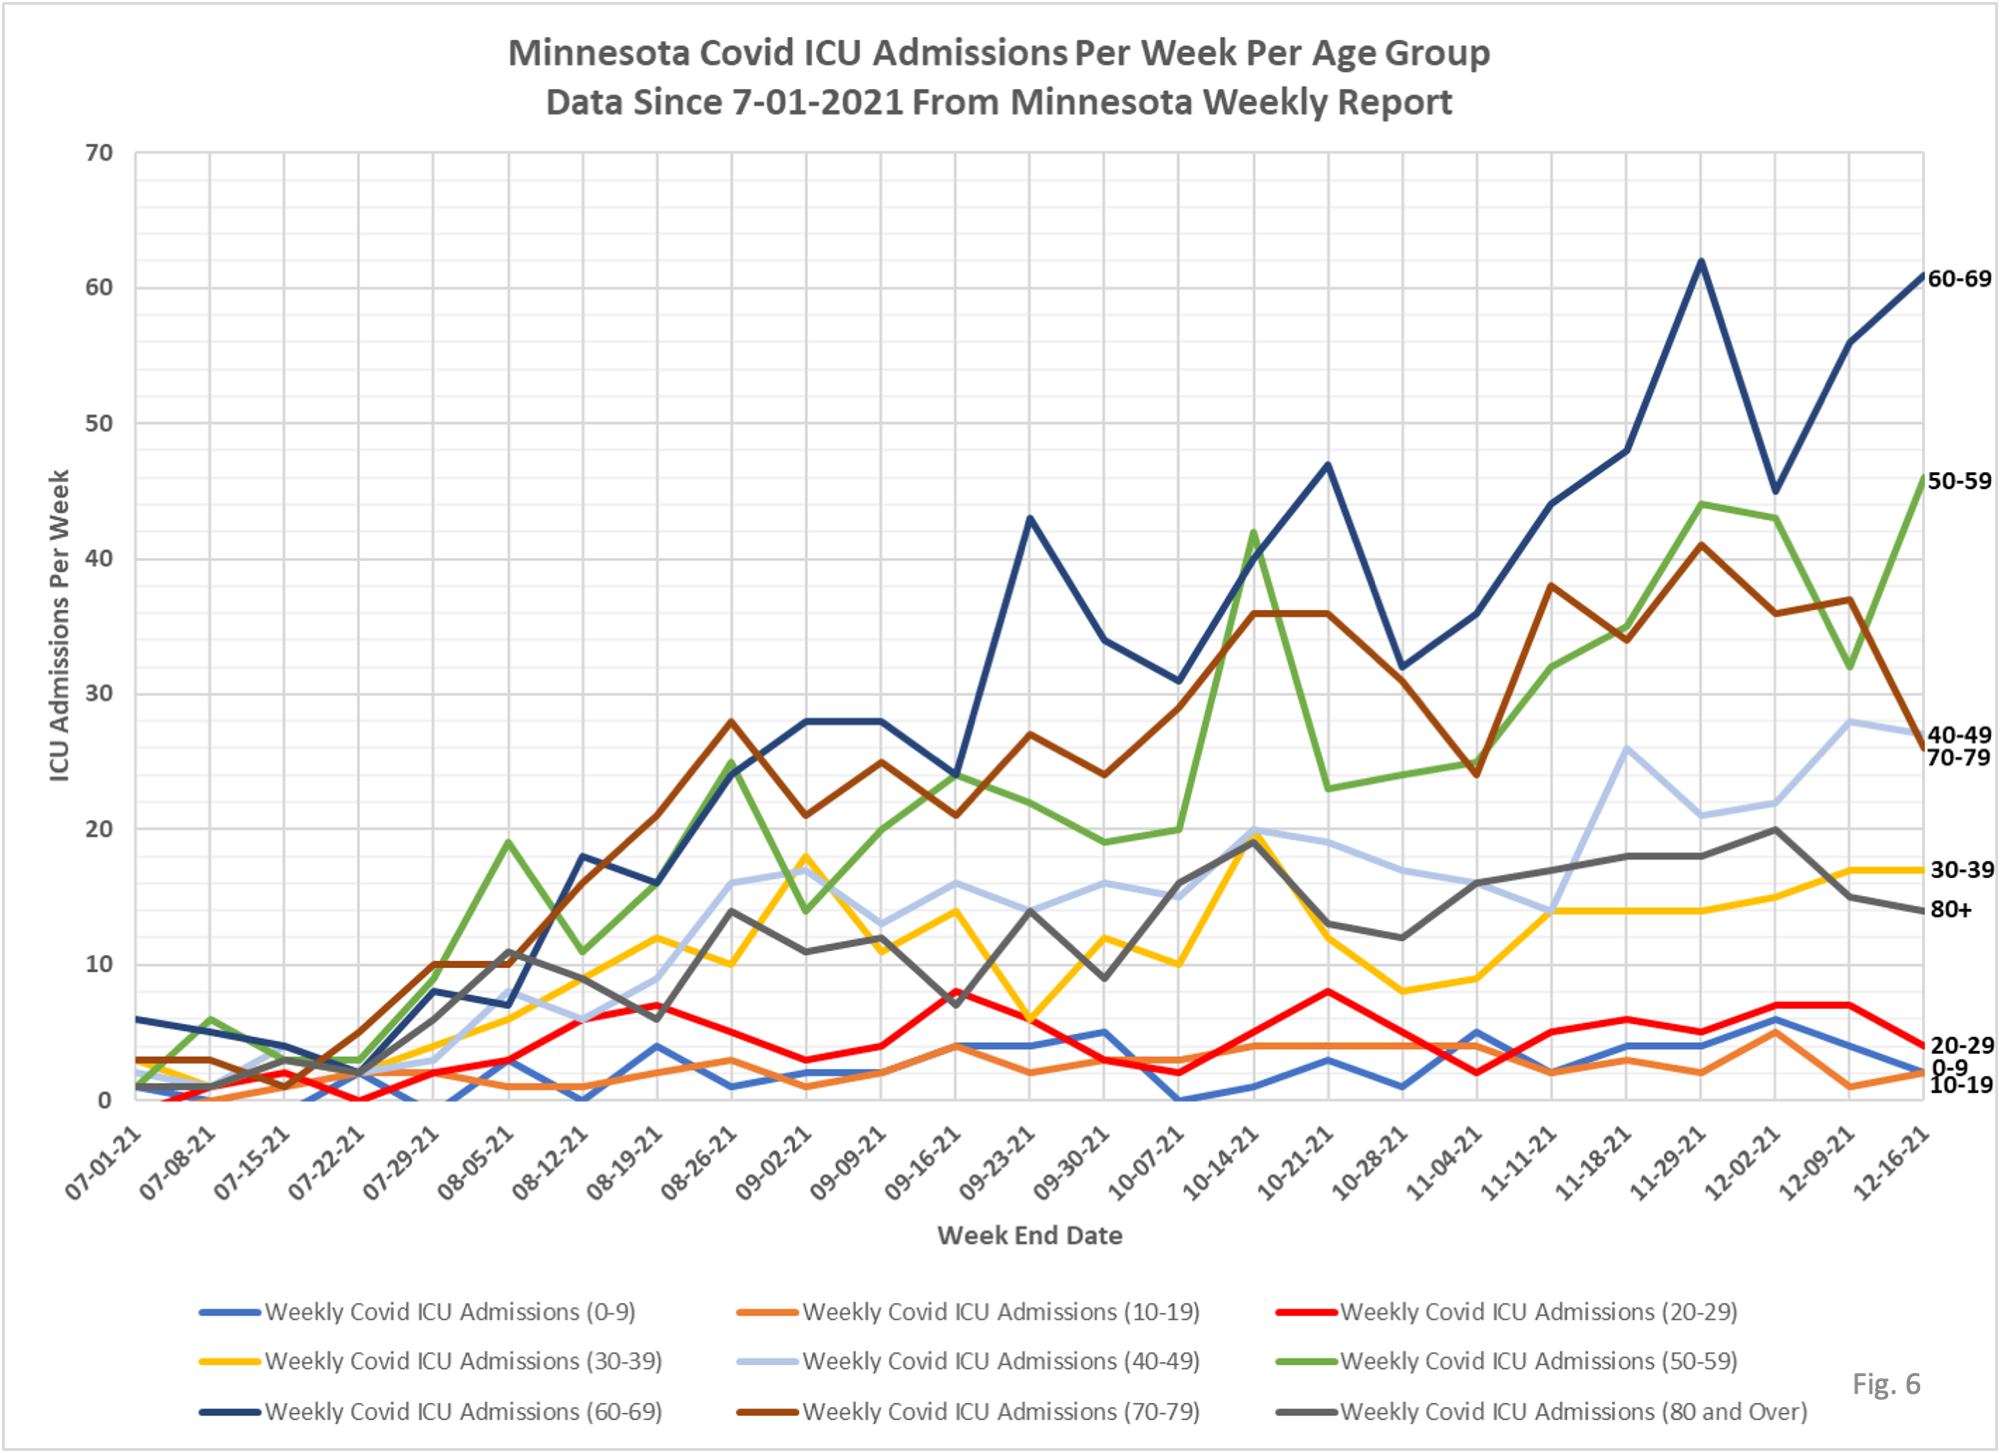
6. Fig. 5 and 6: ICU Admissions Per Week. ICU admissions were a bit mixed, with increases in admissions for the 50-59 and 60-69 age groups offset by a large reduction in the 70-79 age group. The young age groups did well, with only 2 admissions each in the 0-9 and 10-19 age groups, and 4 in the 20-29 age group. Total ICU admissions for the week were 199, little changed from 197 and 199 the prior two weeks.
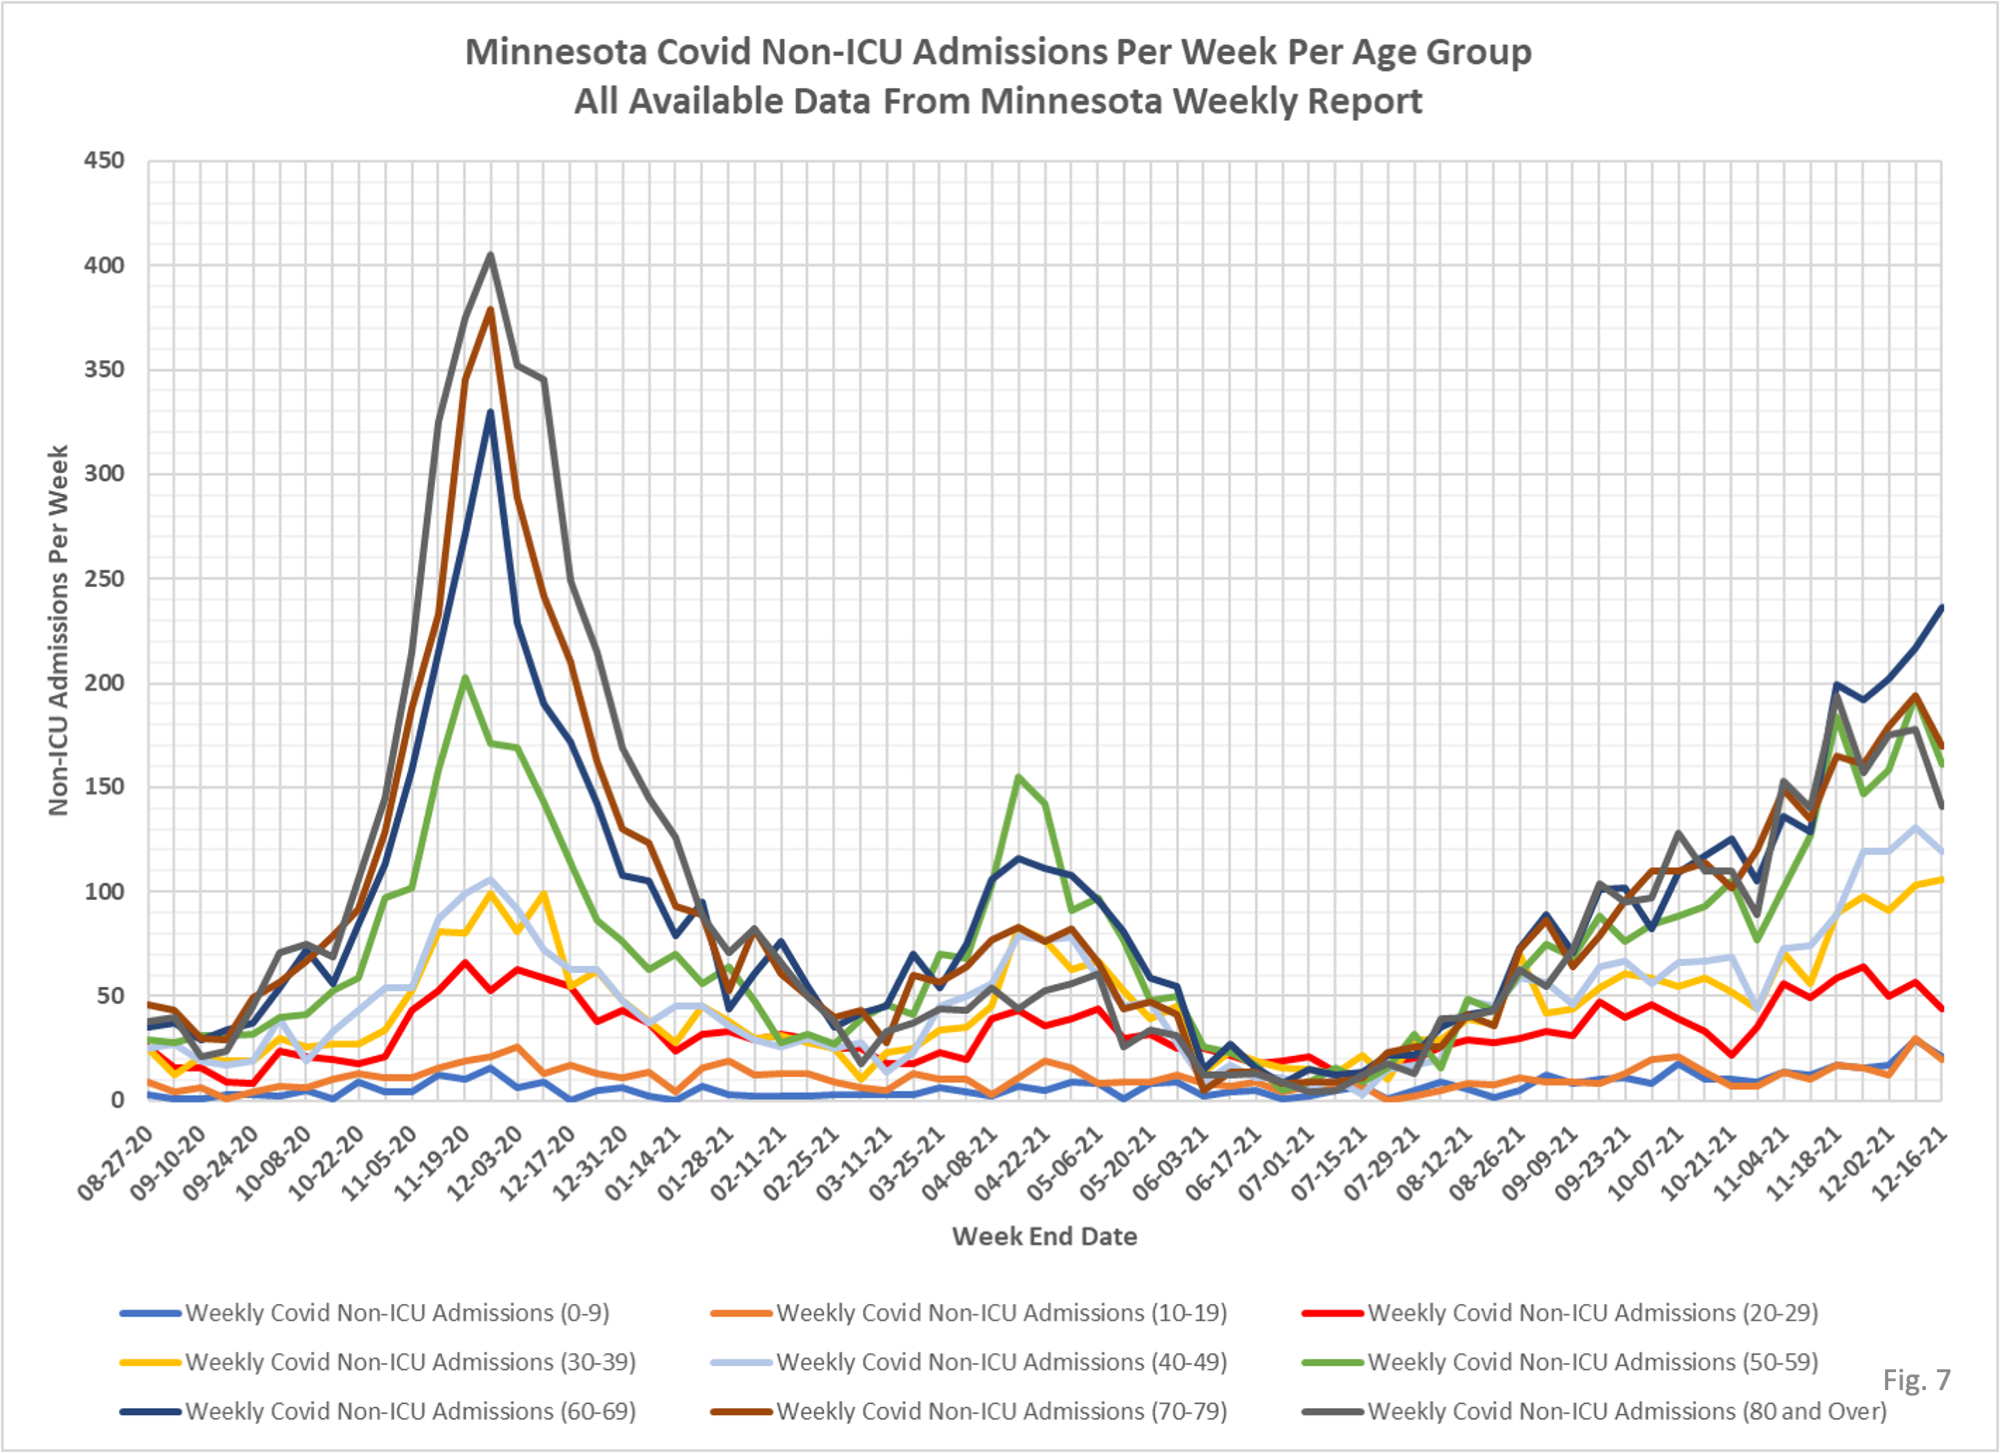
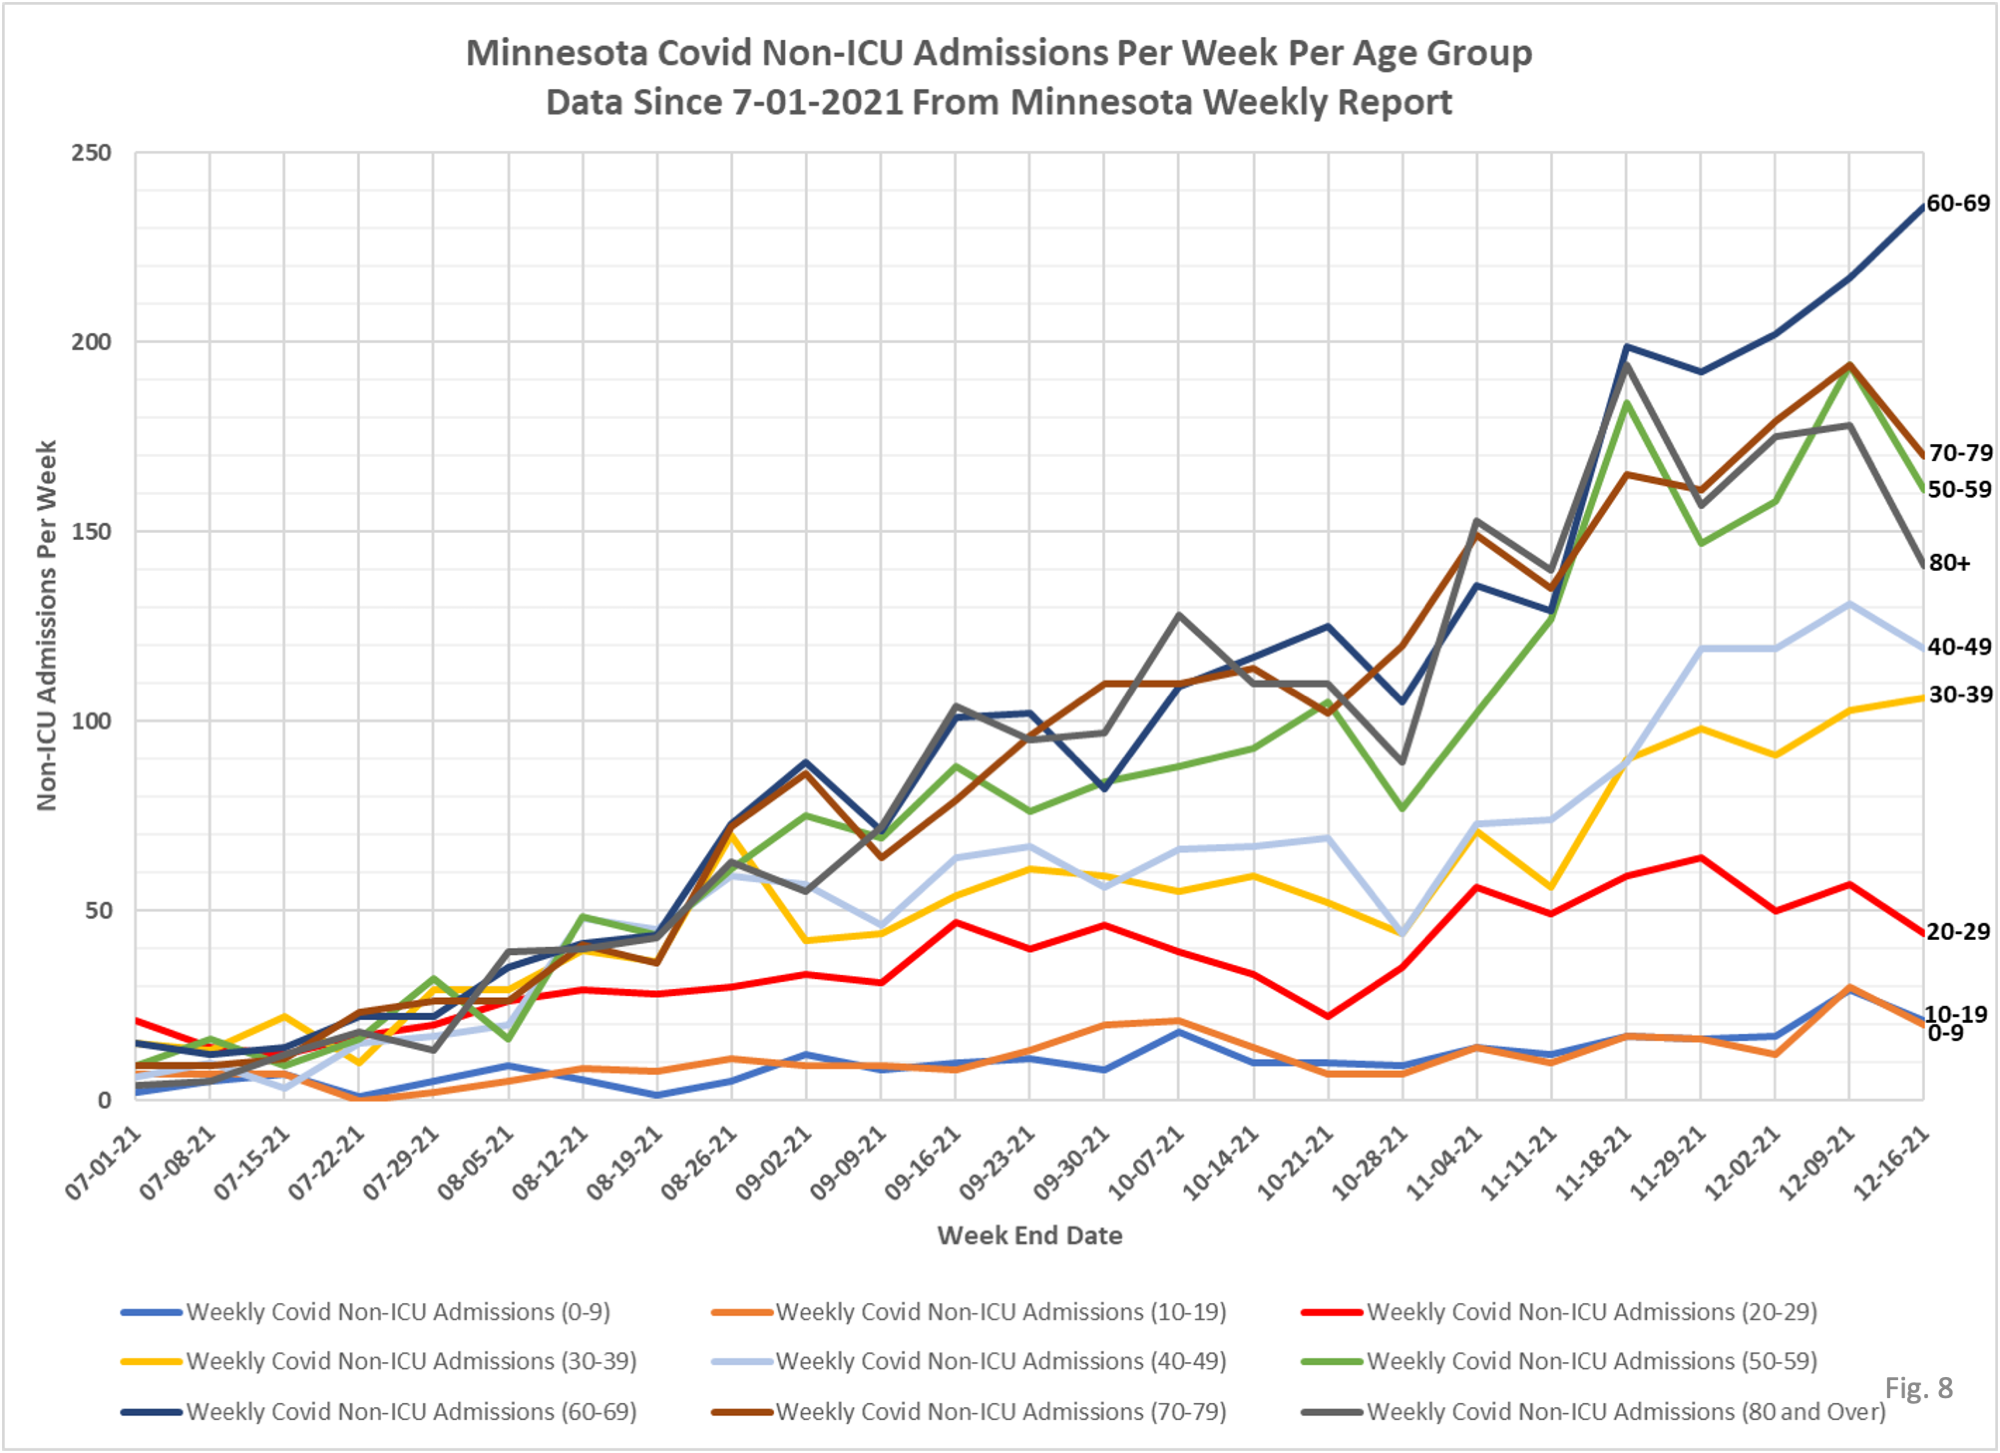
7. Fig. 7 and 8: Non-ICU Admissions Per Week. Non-ICU admissions were greatly higher in the 60-69 age group (236 admissions) while all other groups saw a reduction in admissions (except 30-39 which increased from 103 to 106 admissions). Total Non-ICU Covid admissions for the week were 1018, a decrease of 115 admissions from the 1133 admissions last week.
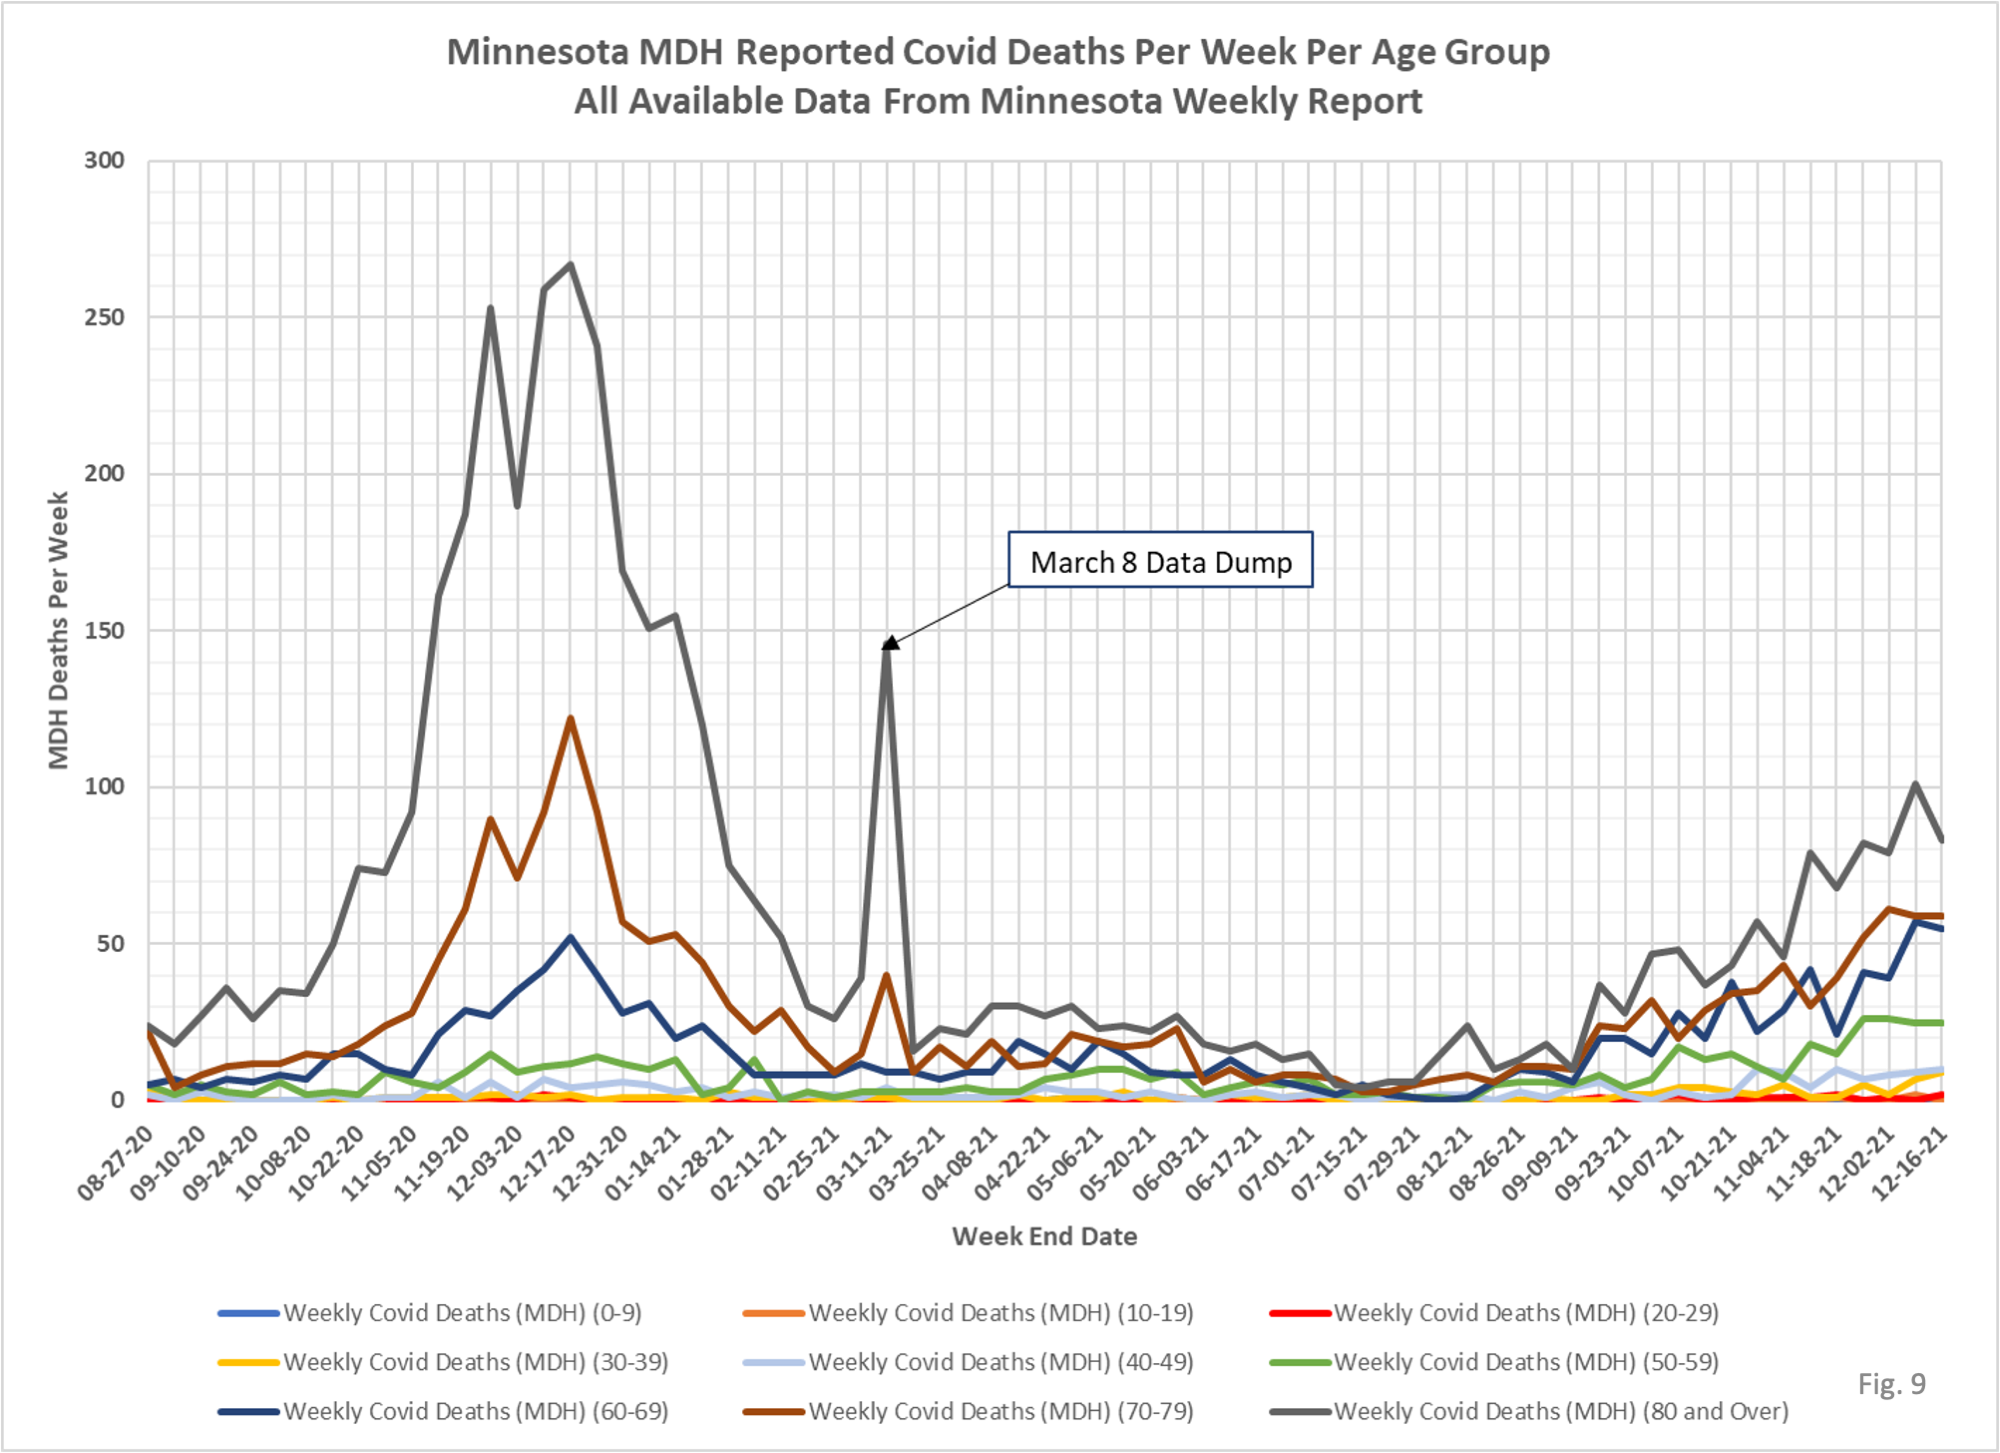
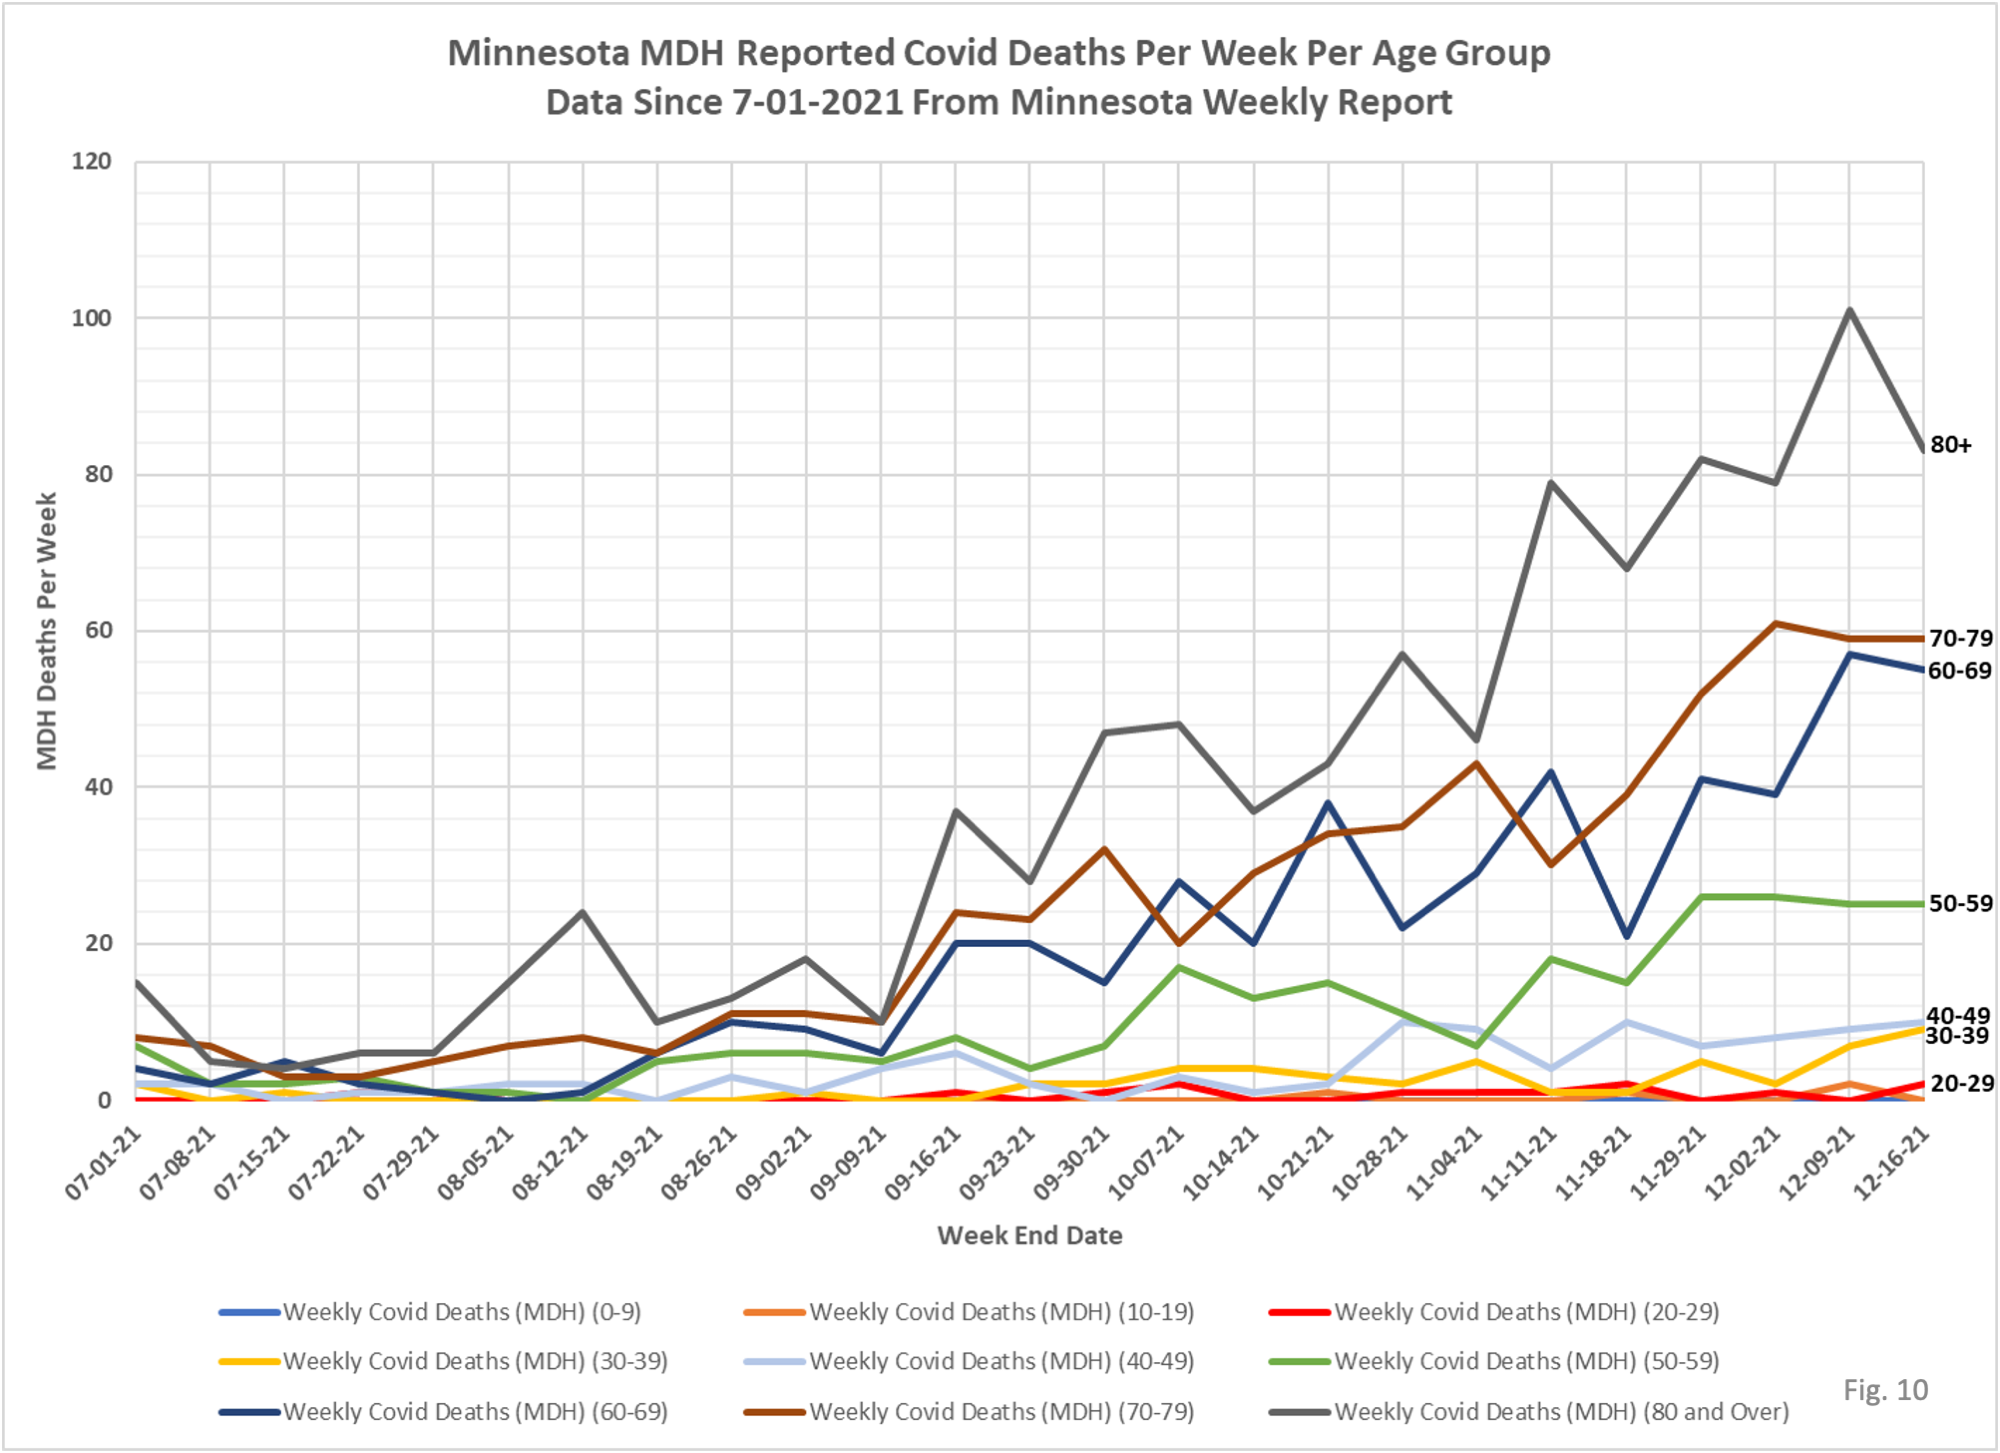
8. Fig. 9 and 10: Deaths Per Week. Total reported deaths for the week were 243, a small decrease from 260 reported deaths the week before. The 80+ age group decreased from 101 to 83 deaths reported for the week. All other groups were little changed from the prior week.