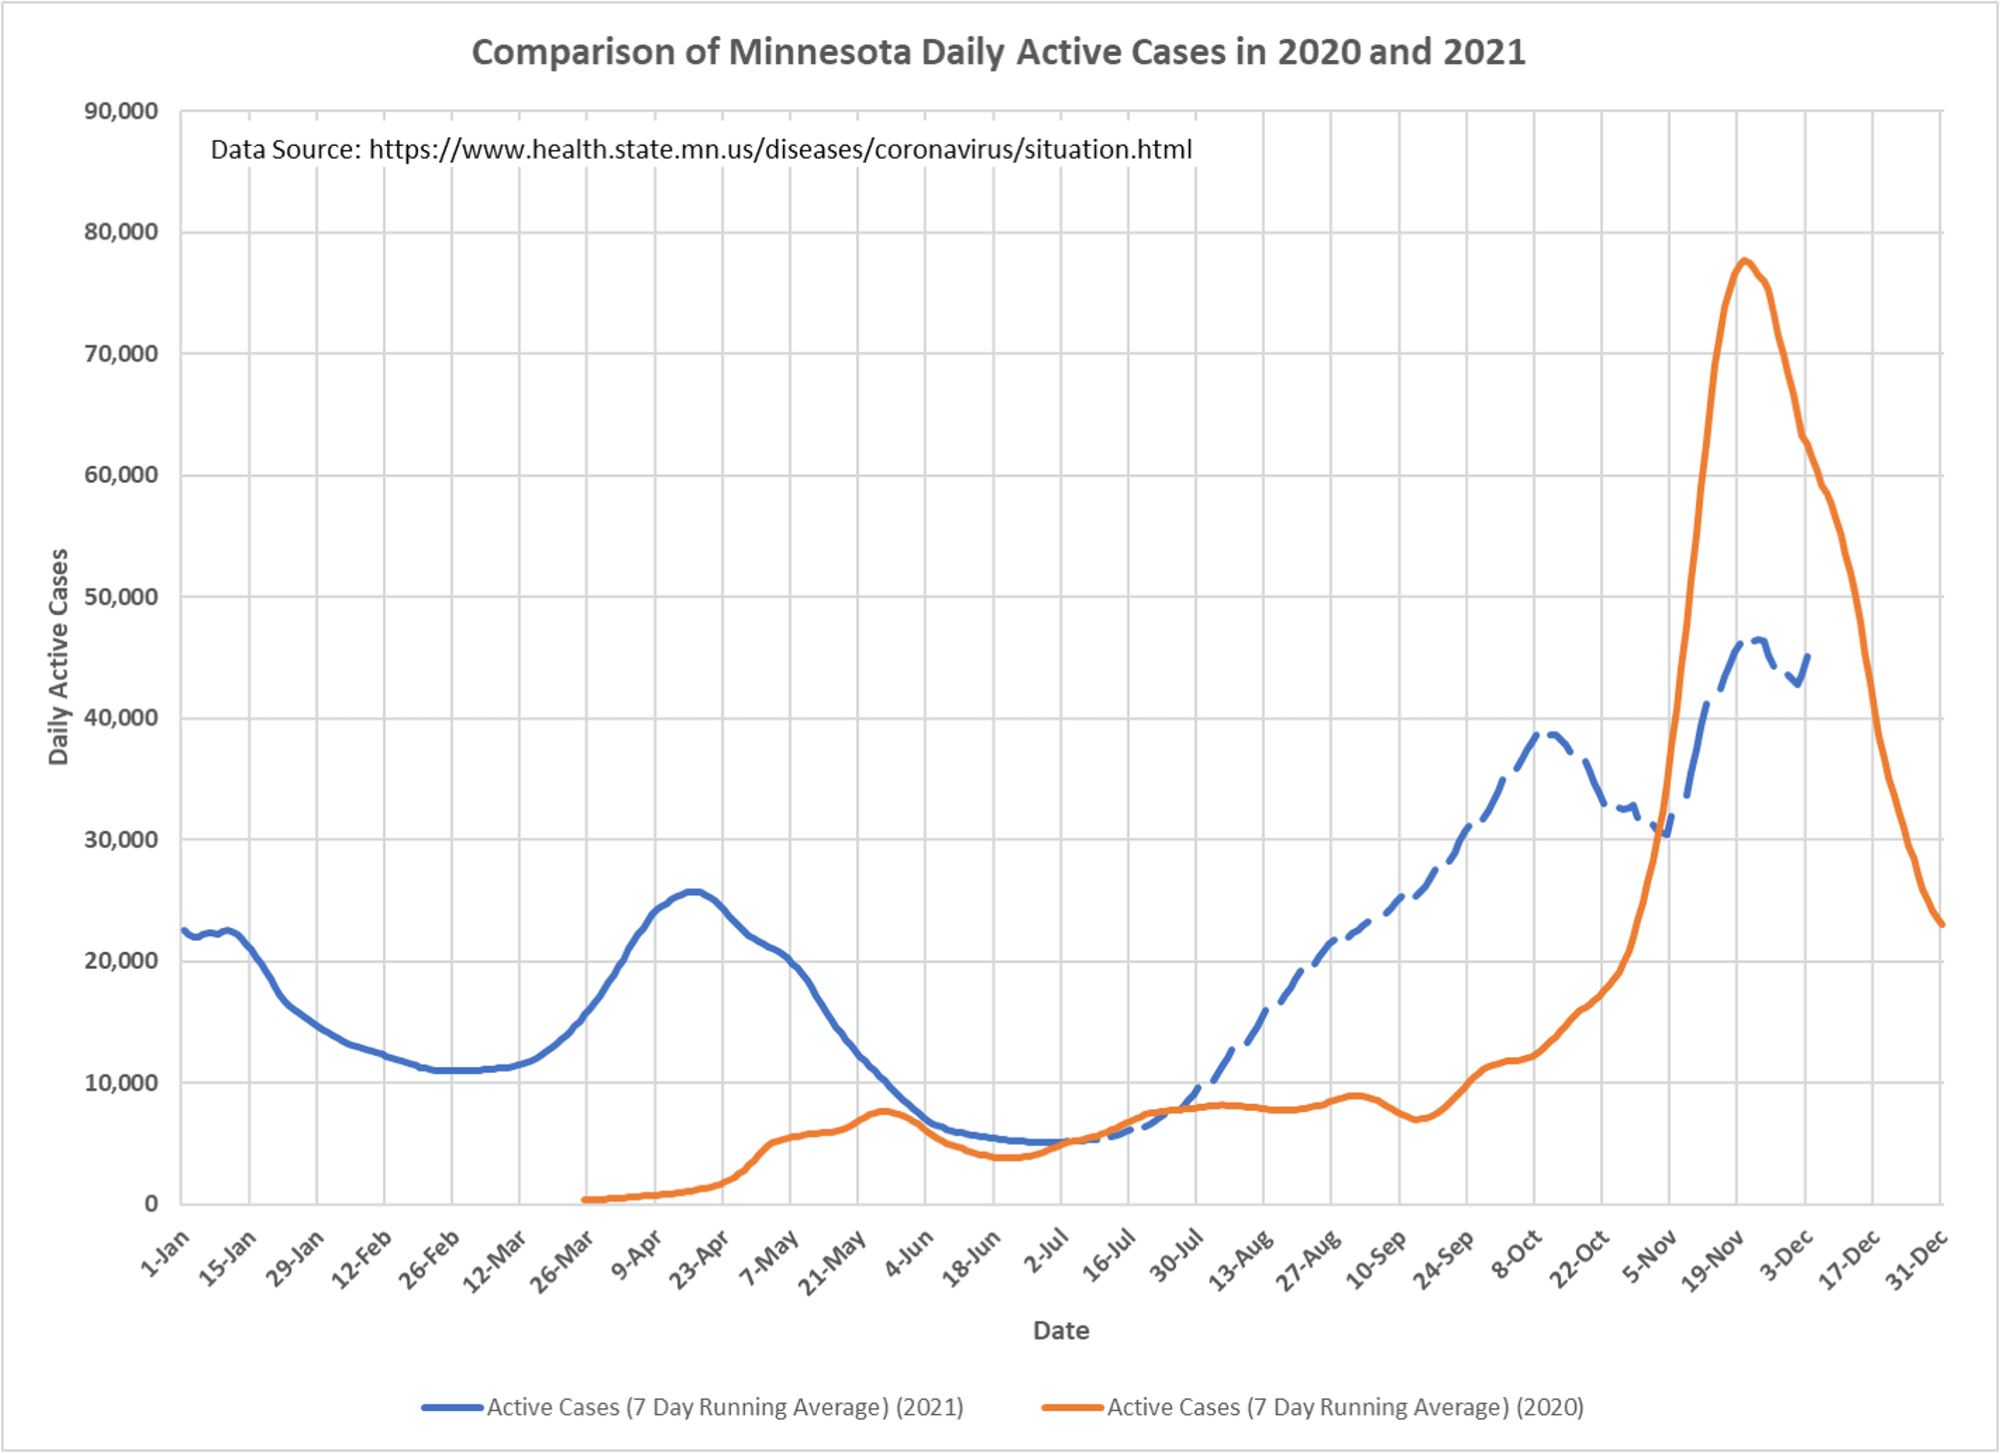
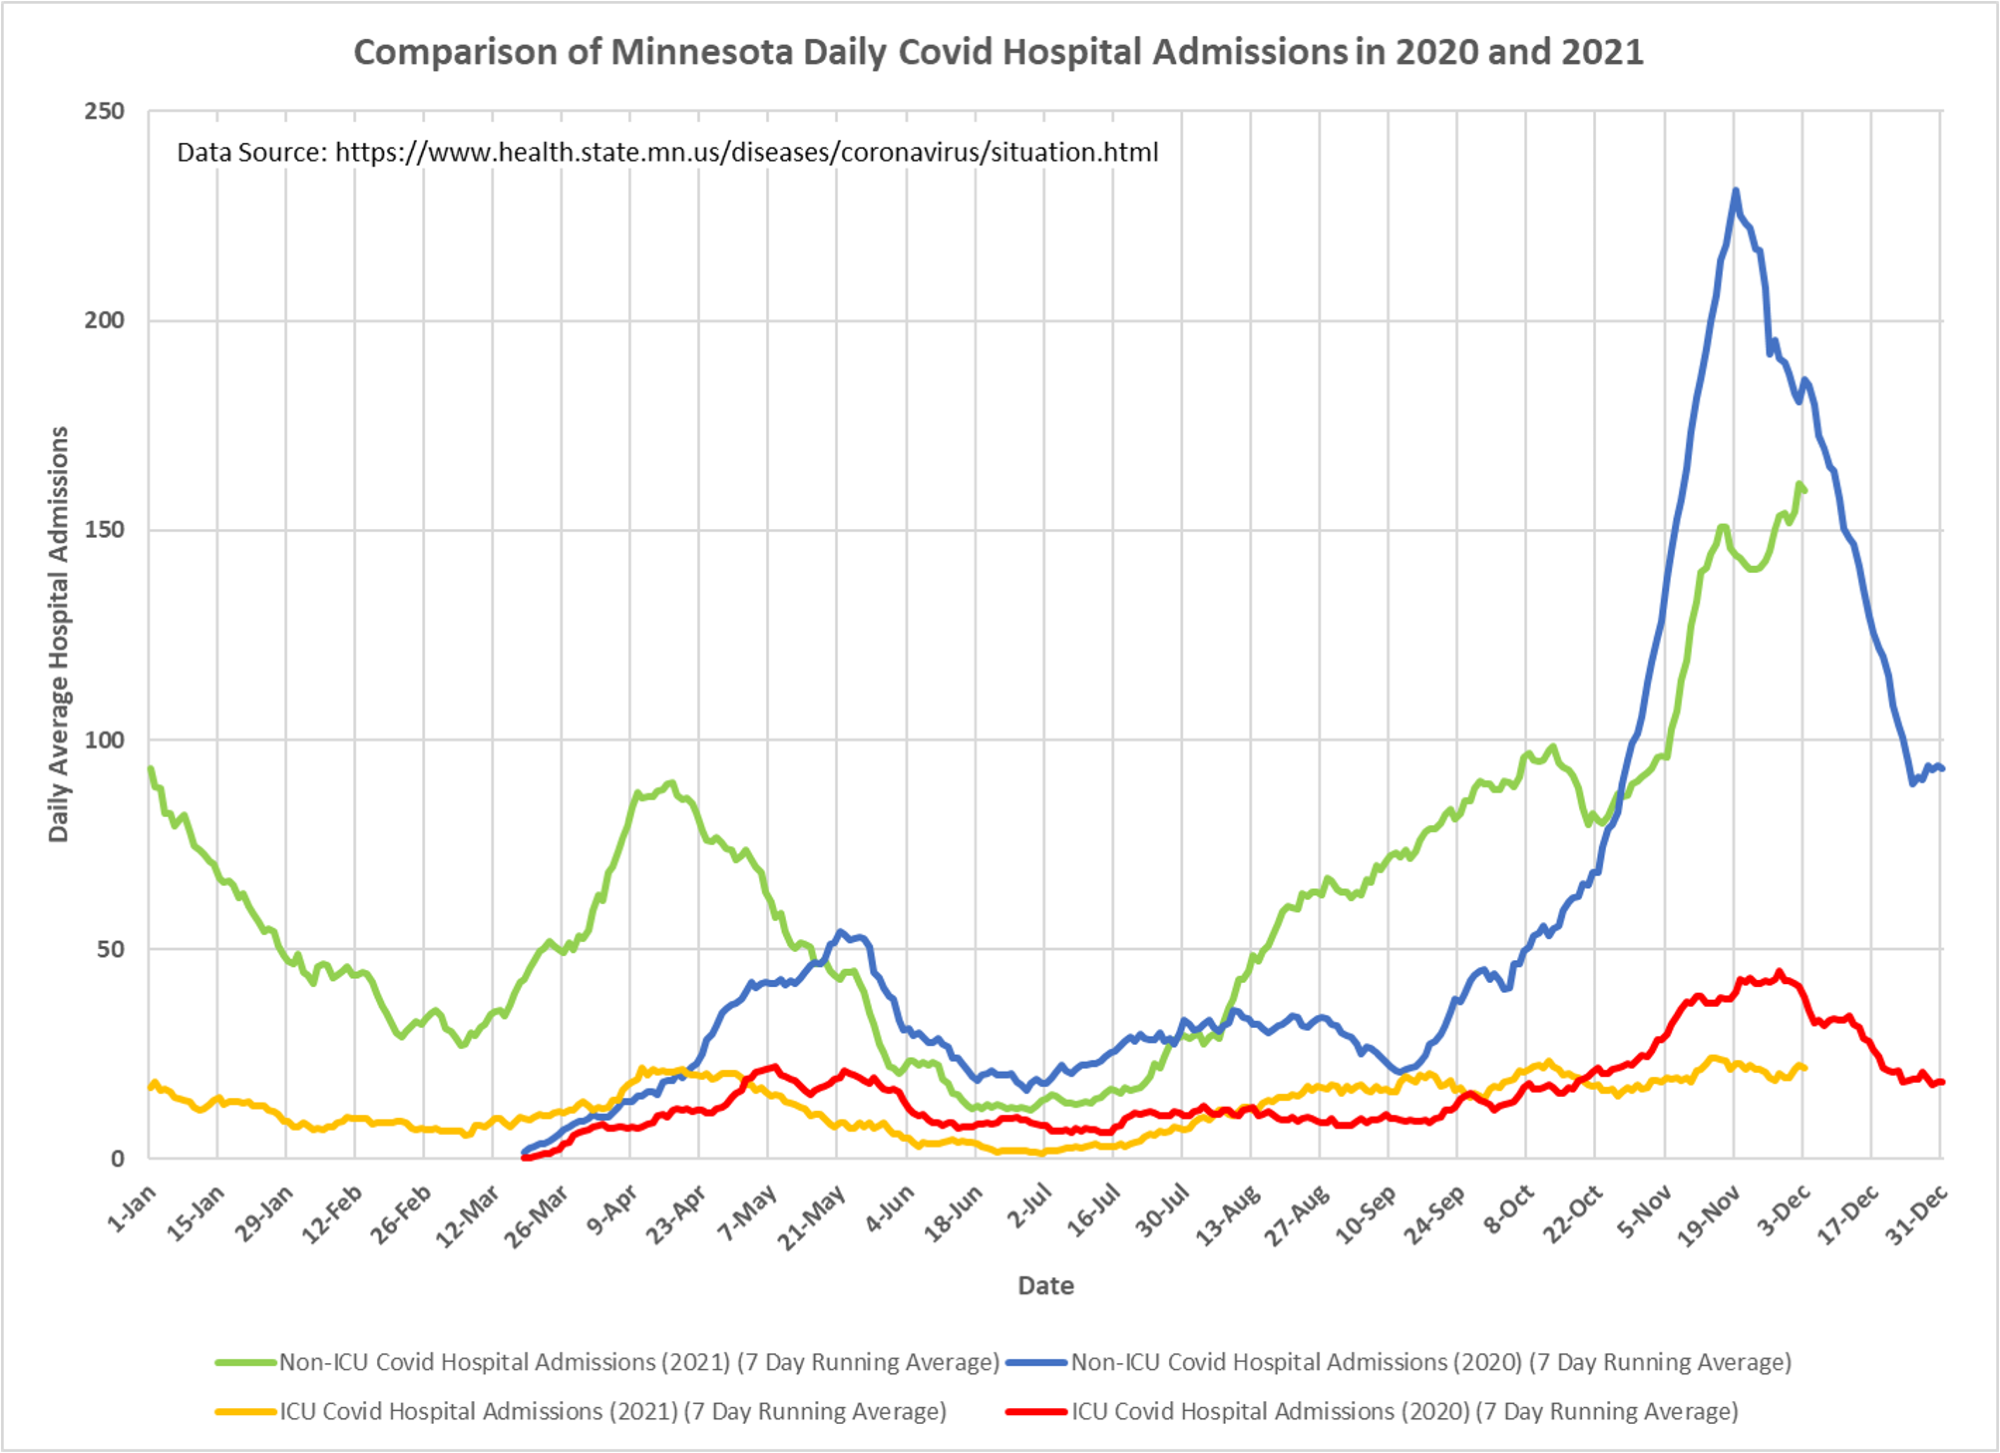
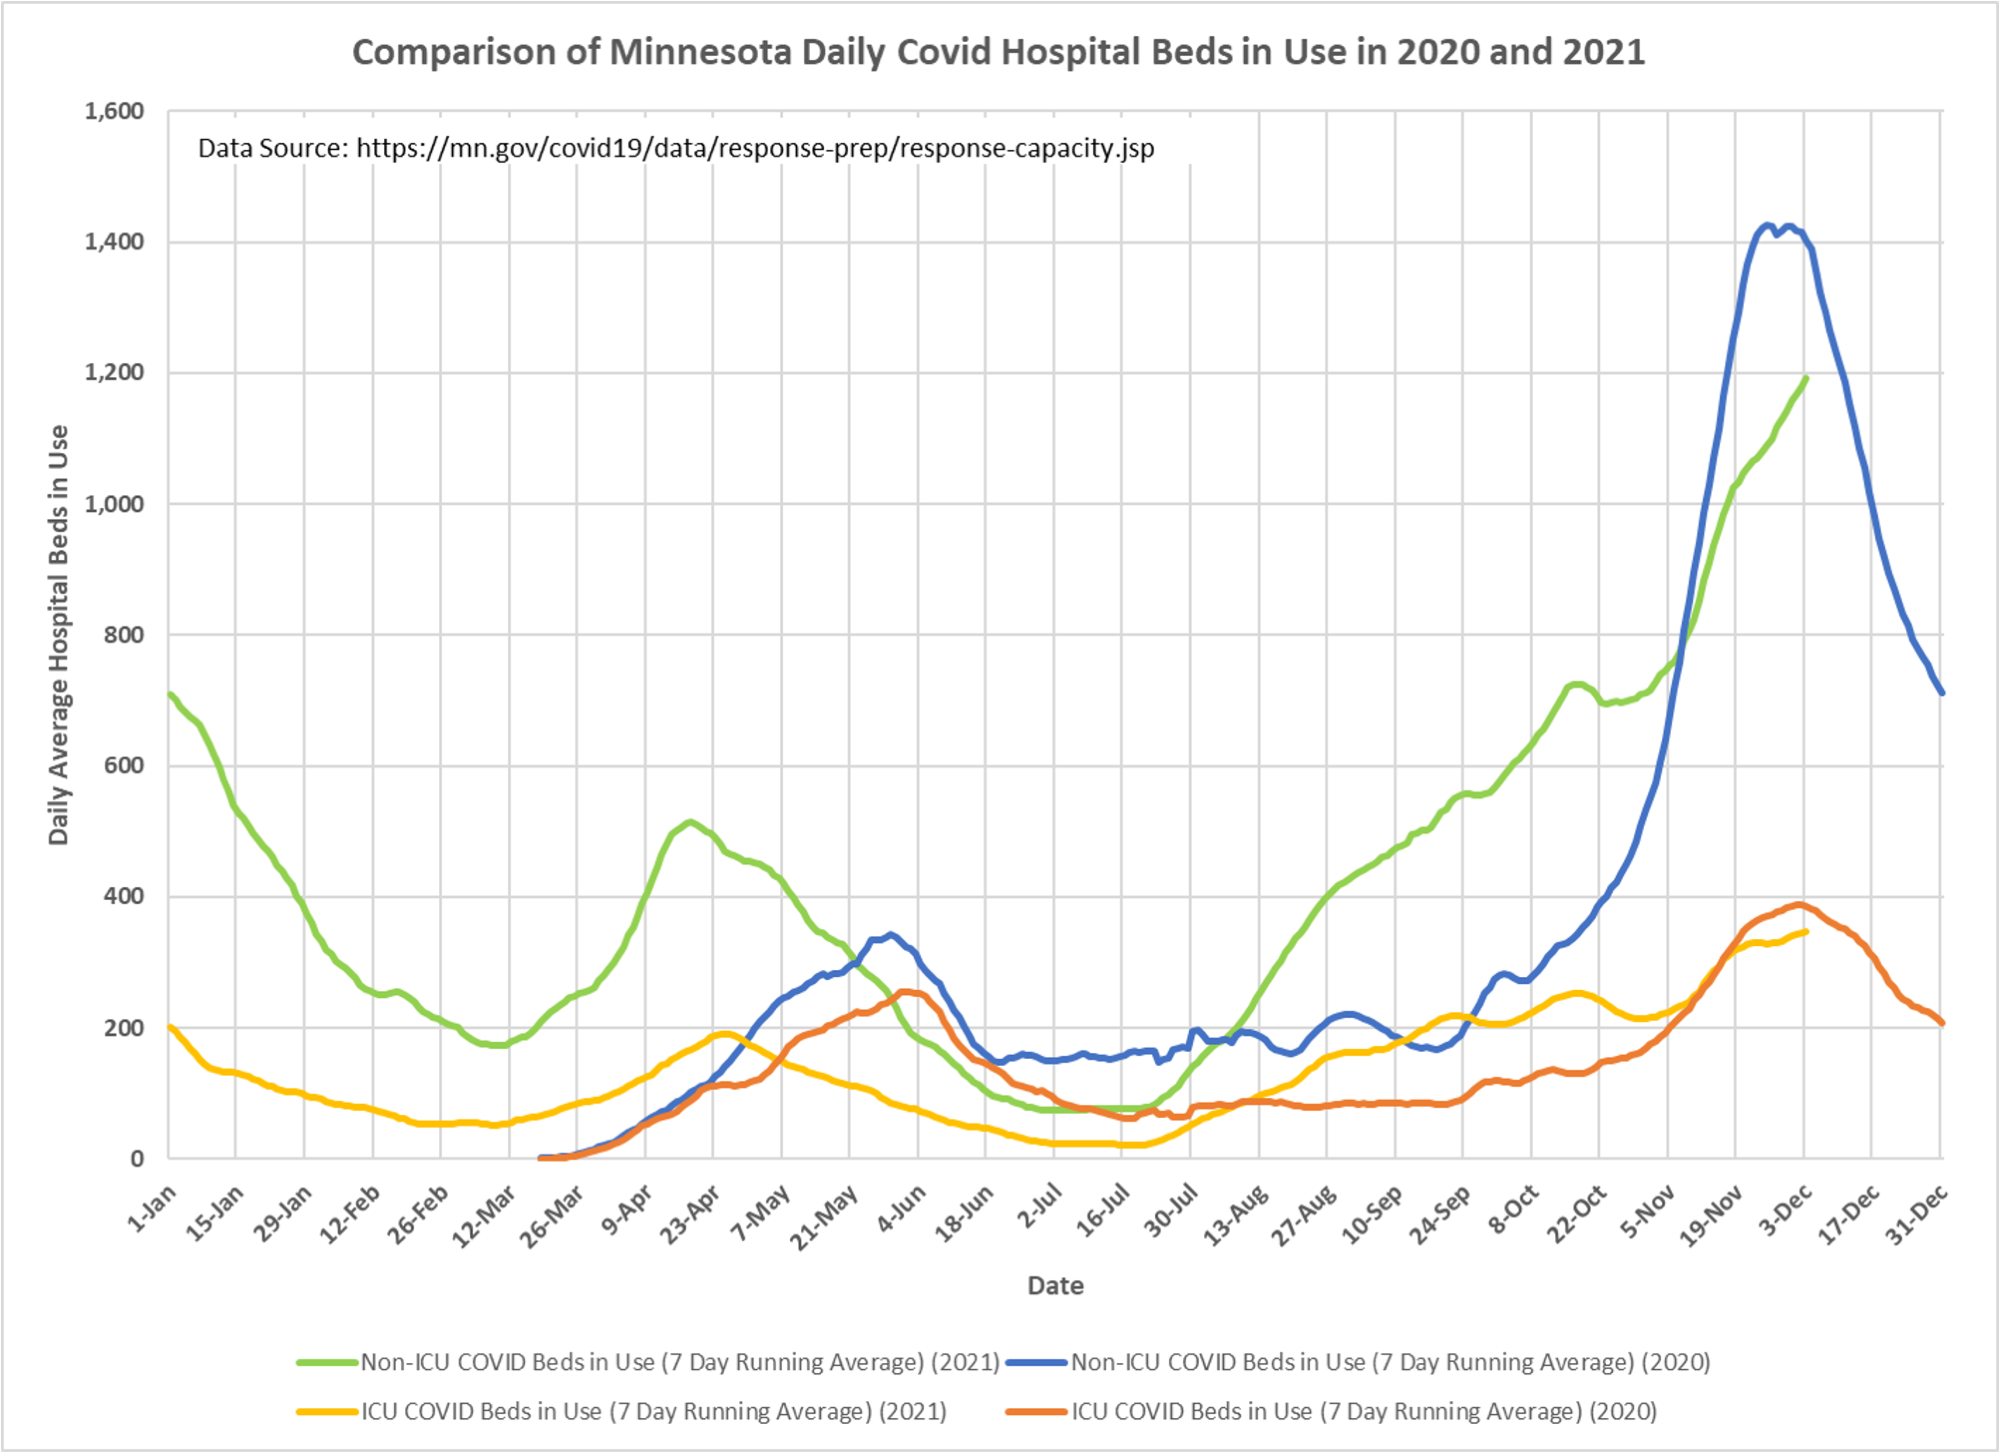
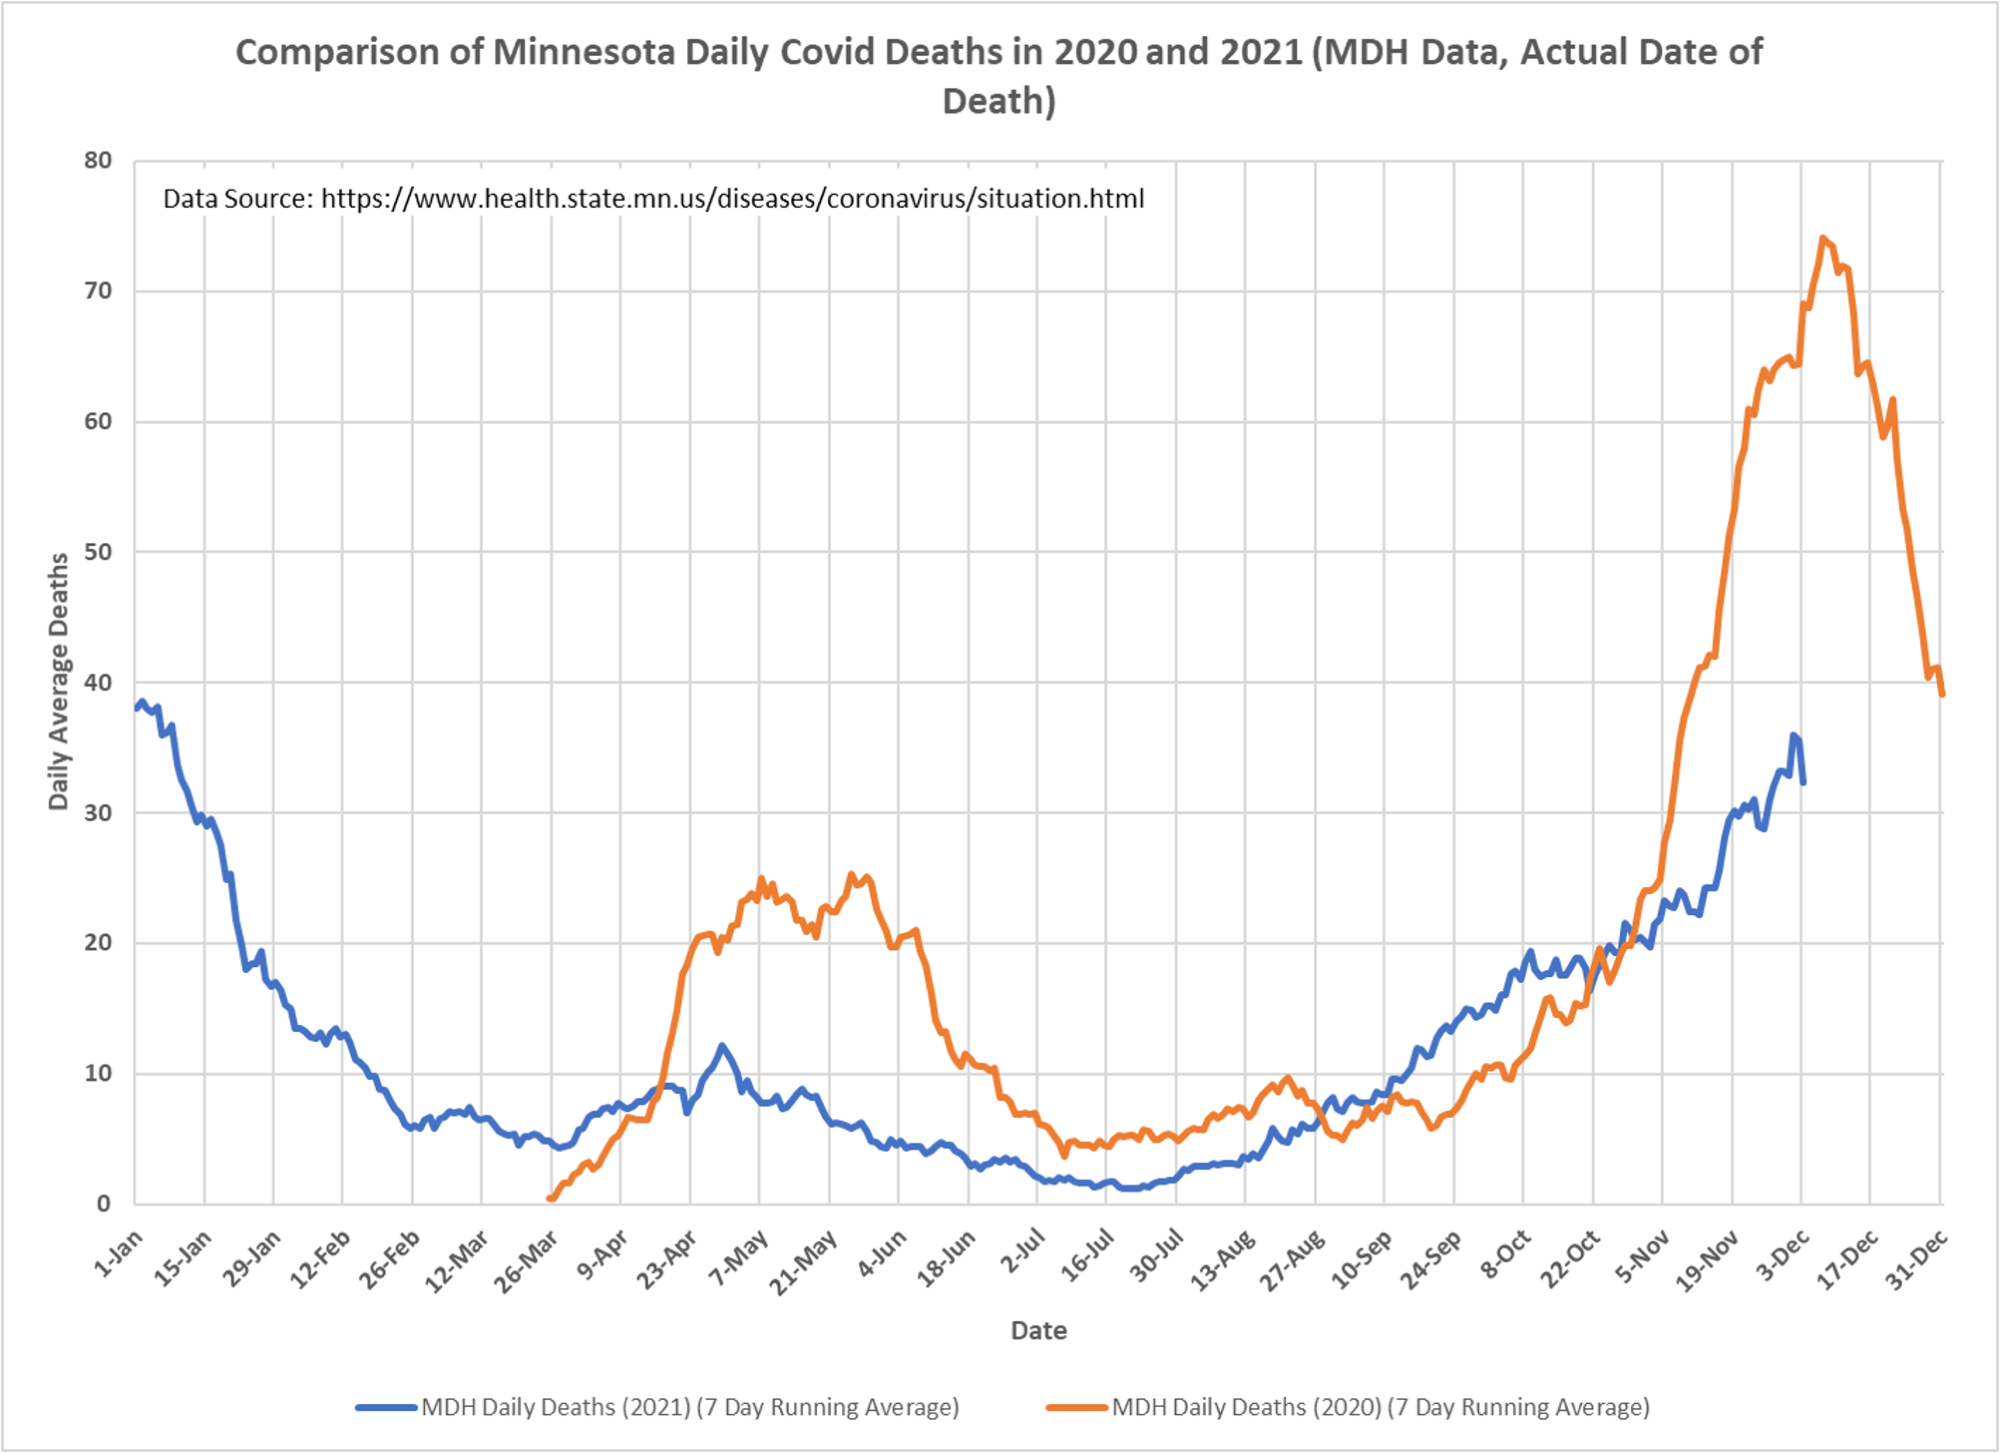
Regretfully, active cases appear to be returning upward, driven by a lot of vax cases, whether the state wants to acknowledge it or not. Generally, however, cases and deaths are at lower levels than last year at a similar time. I don’t know what is up with hospitalizations, which don’t seem quite as much reduced YOY, but I suggest many are mischaracterized as CV-19, and I suggest that many are for things like remdesivir administration. We could see a slight offset on timing, we are having a relatively warm late fall, early winter, and we see the long-awaited downturn, but the curve doesn’t look great for that yet. Dave Dixon’s comments:
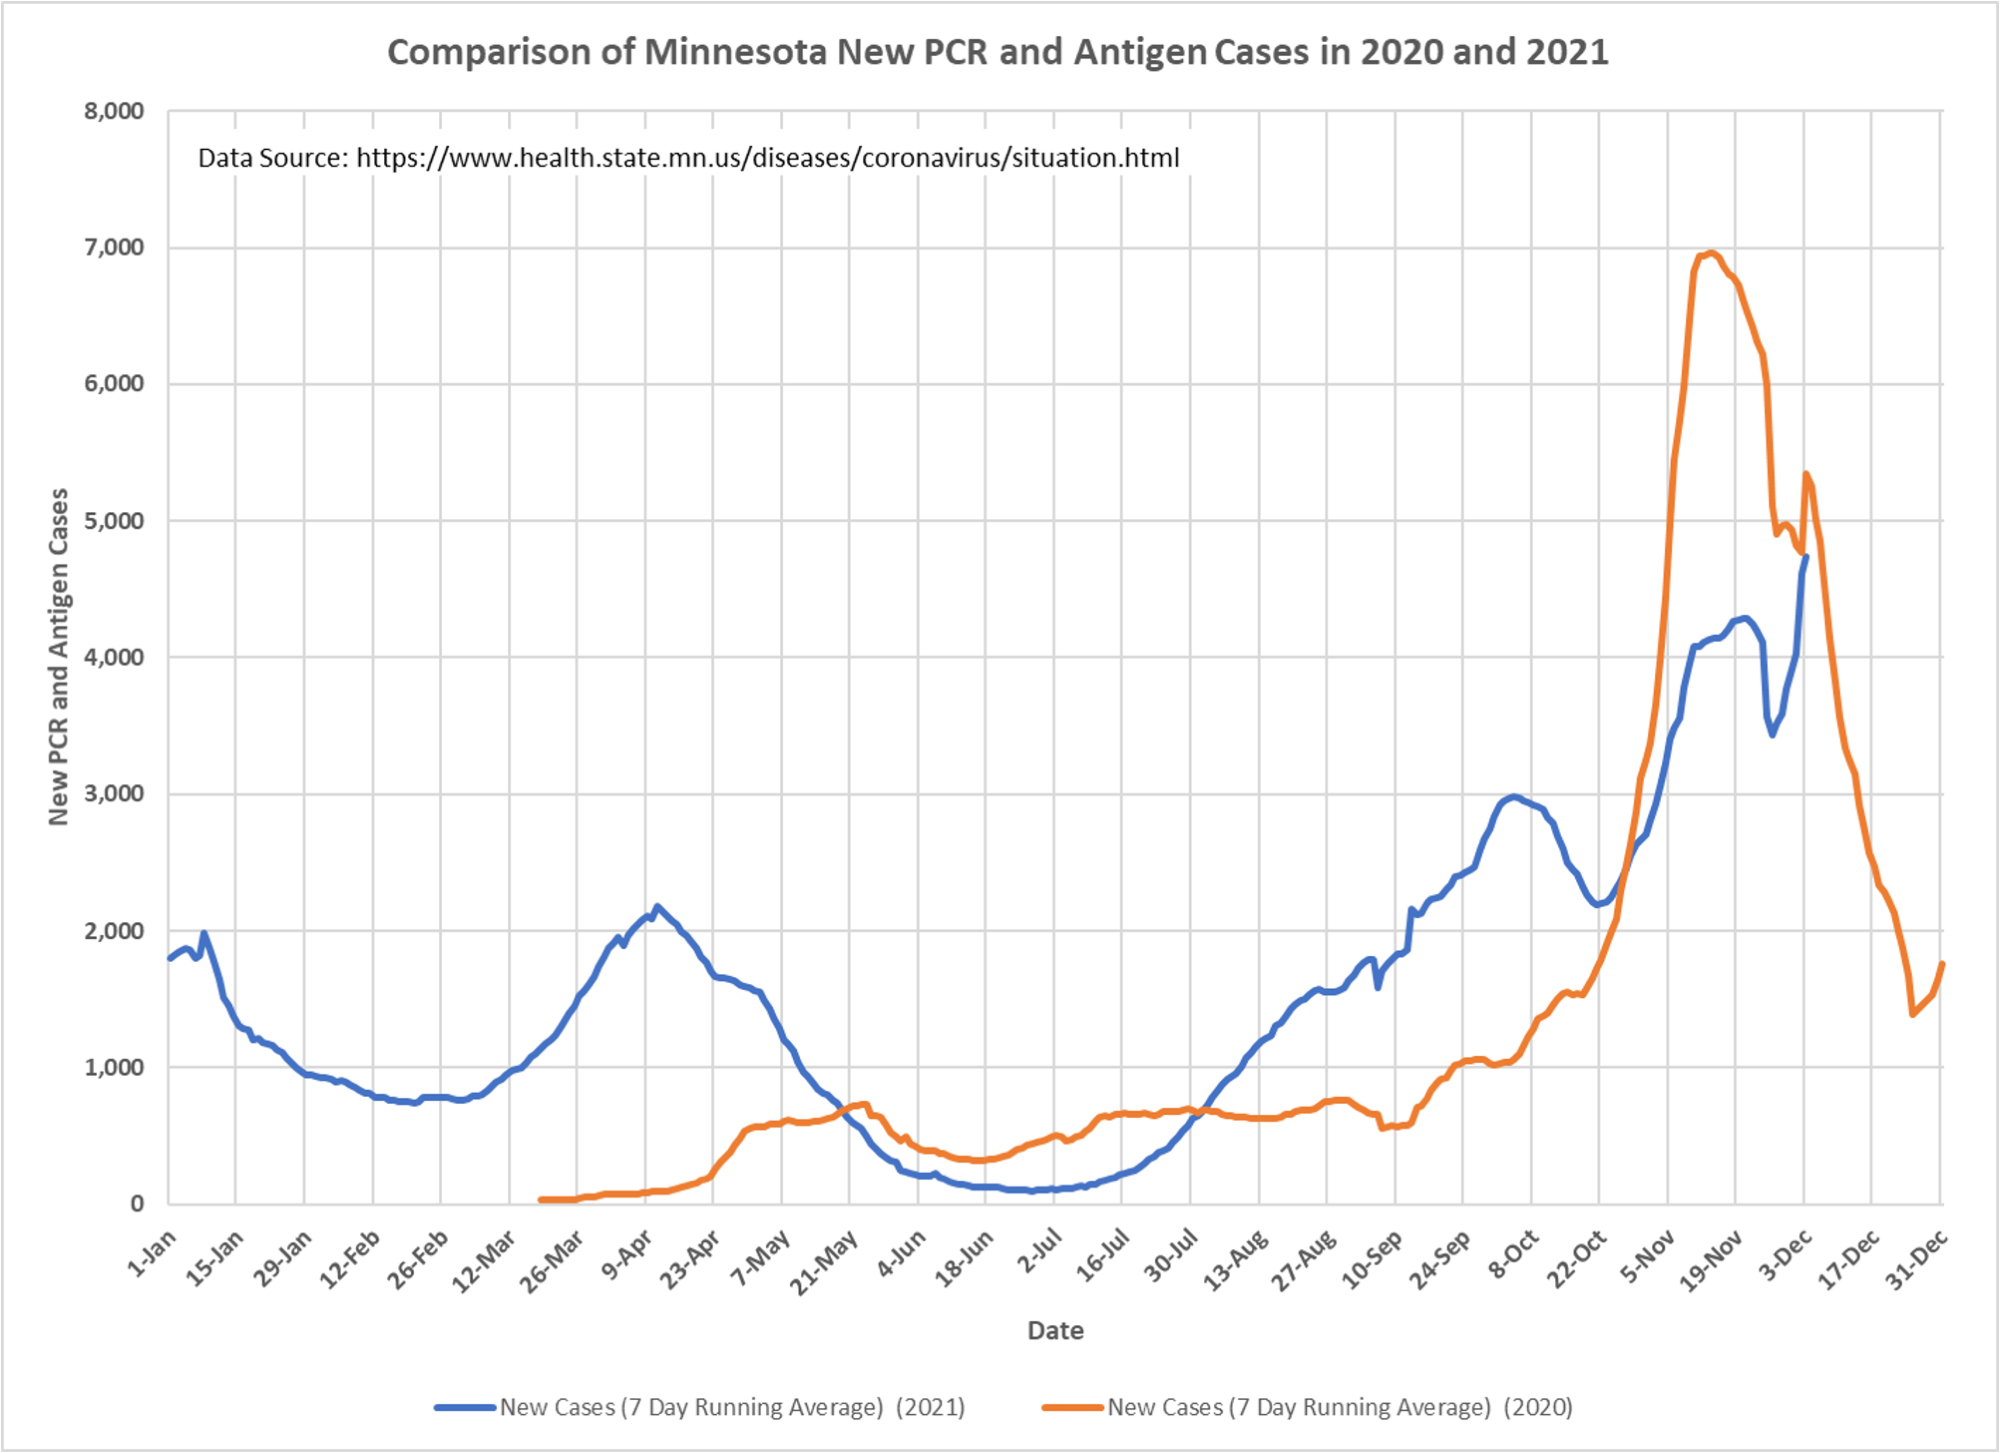
1. After having peaked on November 20, cases are resuming their upward climb.
2. Hospital admissions also reversed higher, while hospital beds in use continue to climb without a Thanksgiving holiday pause.
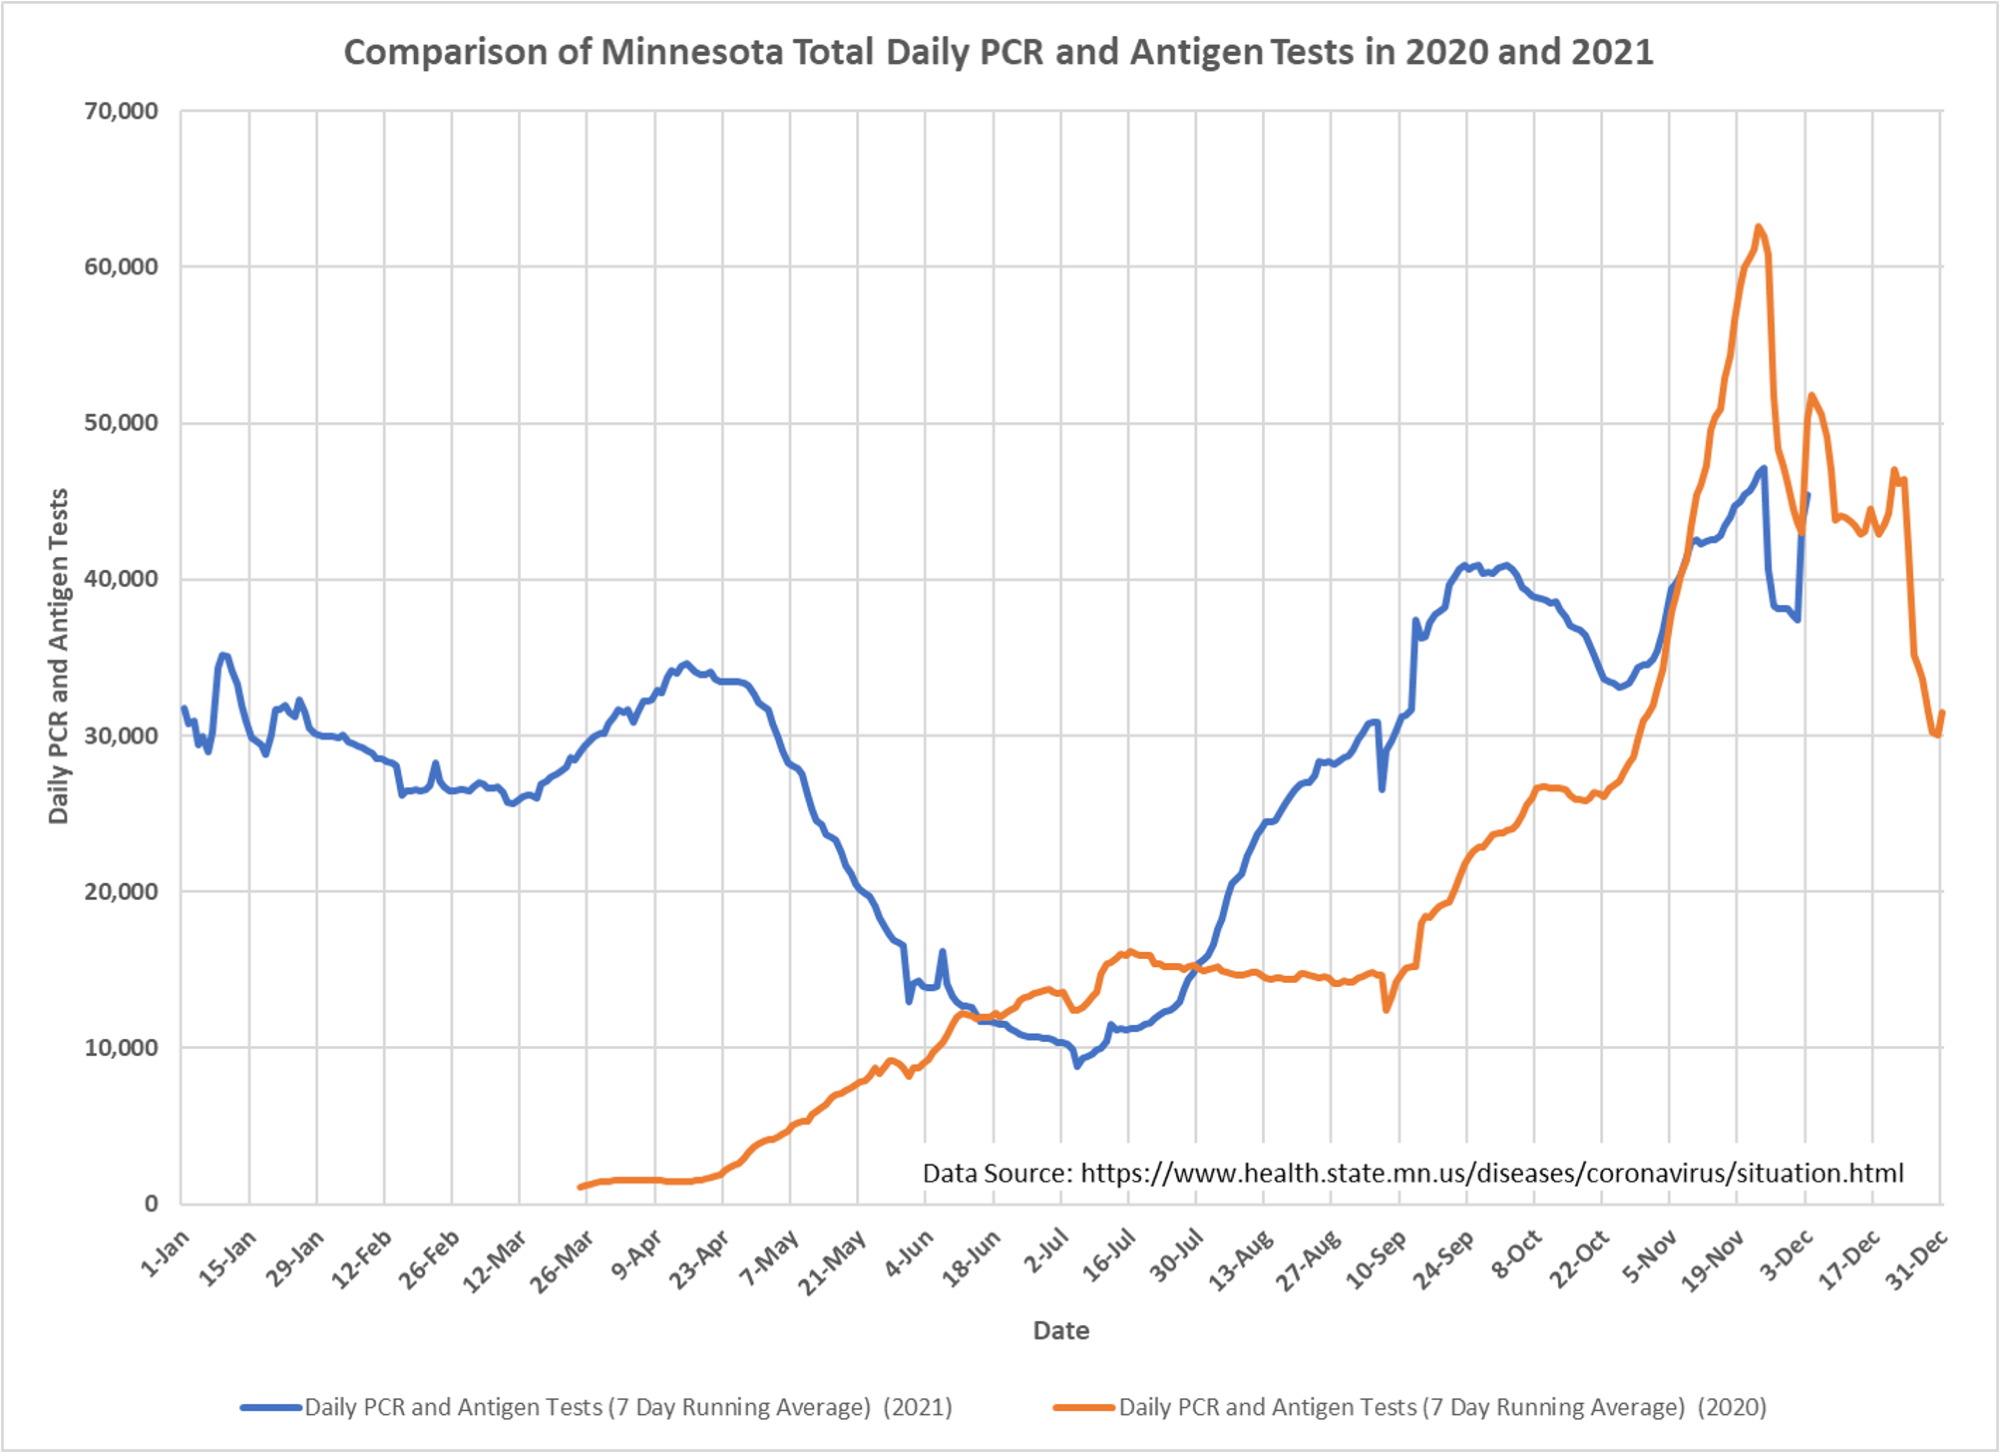
2, All data for testing, cases, hospital admissions, and deaths are taken from the data table on the Minnesota Situation Update page: https://www.health.state.mn.us/diseases/coronavirus/situation.html The only modification to the data is to calculate 7 day running averages in order to make the trends easier to see.
3. The underlying data for hospital beds in use is taken from the Teletracking data file found on the Response and Preparation web page: https://mn.gov/covid19/data/response-prep/response-capacity.jsp The Teletracking data file is also cited as the data source for the graphic on this same page. 7 day running averages are calculated for beds in use as well.
4. Active cases are calculated as the cumulative PCR and antigen positive cases minus cumulative deaths minus the people No Longer Needing Isolation. The No Longer Needing Isolation total is found on the Situation Update page. IN recent days MDH has started publishing the Total Positive People (Cumulative) statistic. It is on our to-do list to figure out the impact of this reporting change on Active Cases.
5. For all charts the most recent 7 days of data is excluded, in order to avoid charting incomplete data.
6. The sharp drop in cases on 11/26/2021 and 11/27/2021 are caused by dramatically reduced testing on the Thanksgiving holiday. Both years there was a single day with much lower testing and cases than the days before and after. These days with low cases are part of the 7 days running average for 7 days, after which the 7 day running average rebounds to the underlying trend. The same 7 day effect can be seen for the Labor Day holiday in both 2020 and 2021, although with a smaller reduction in the running average.

“…driven by a lot of vax cases…”
Kevin,
How do you know this is the case? My understanding is that it’s difficult, even for a guru like Dave, to extract this information from MDH.