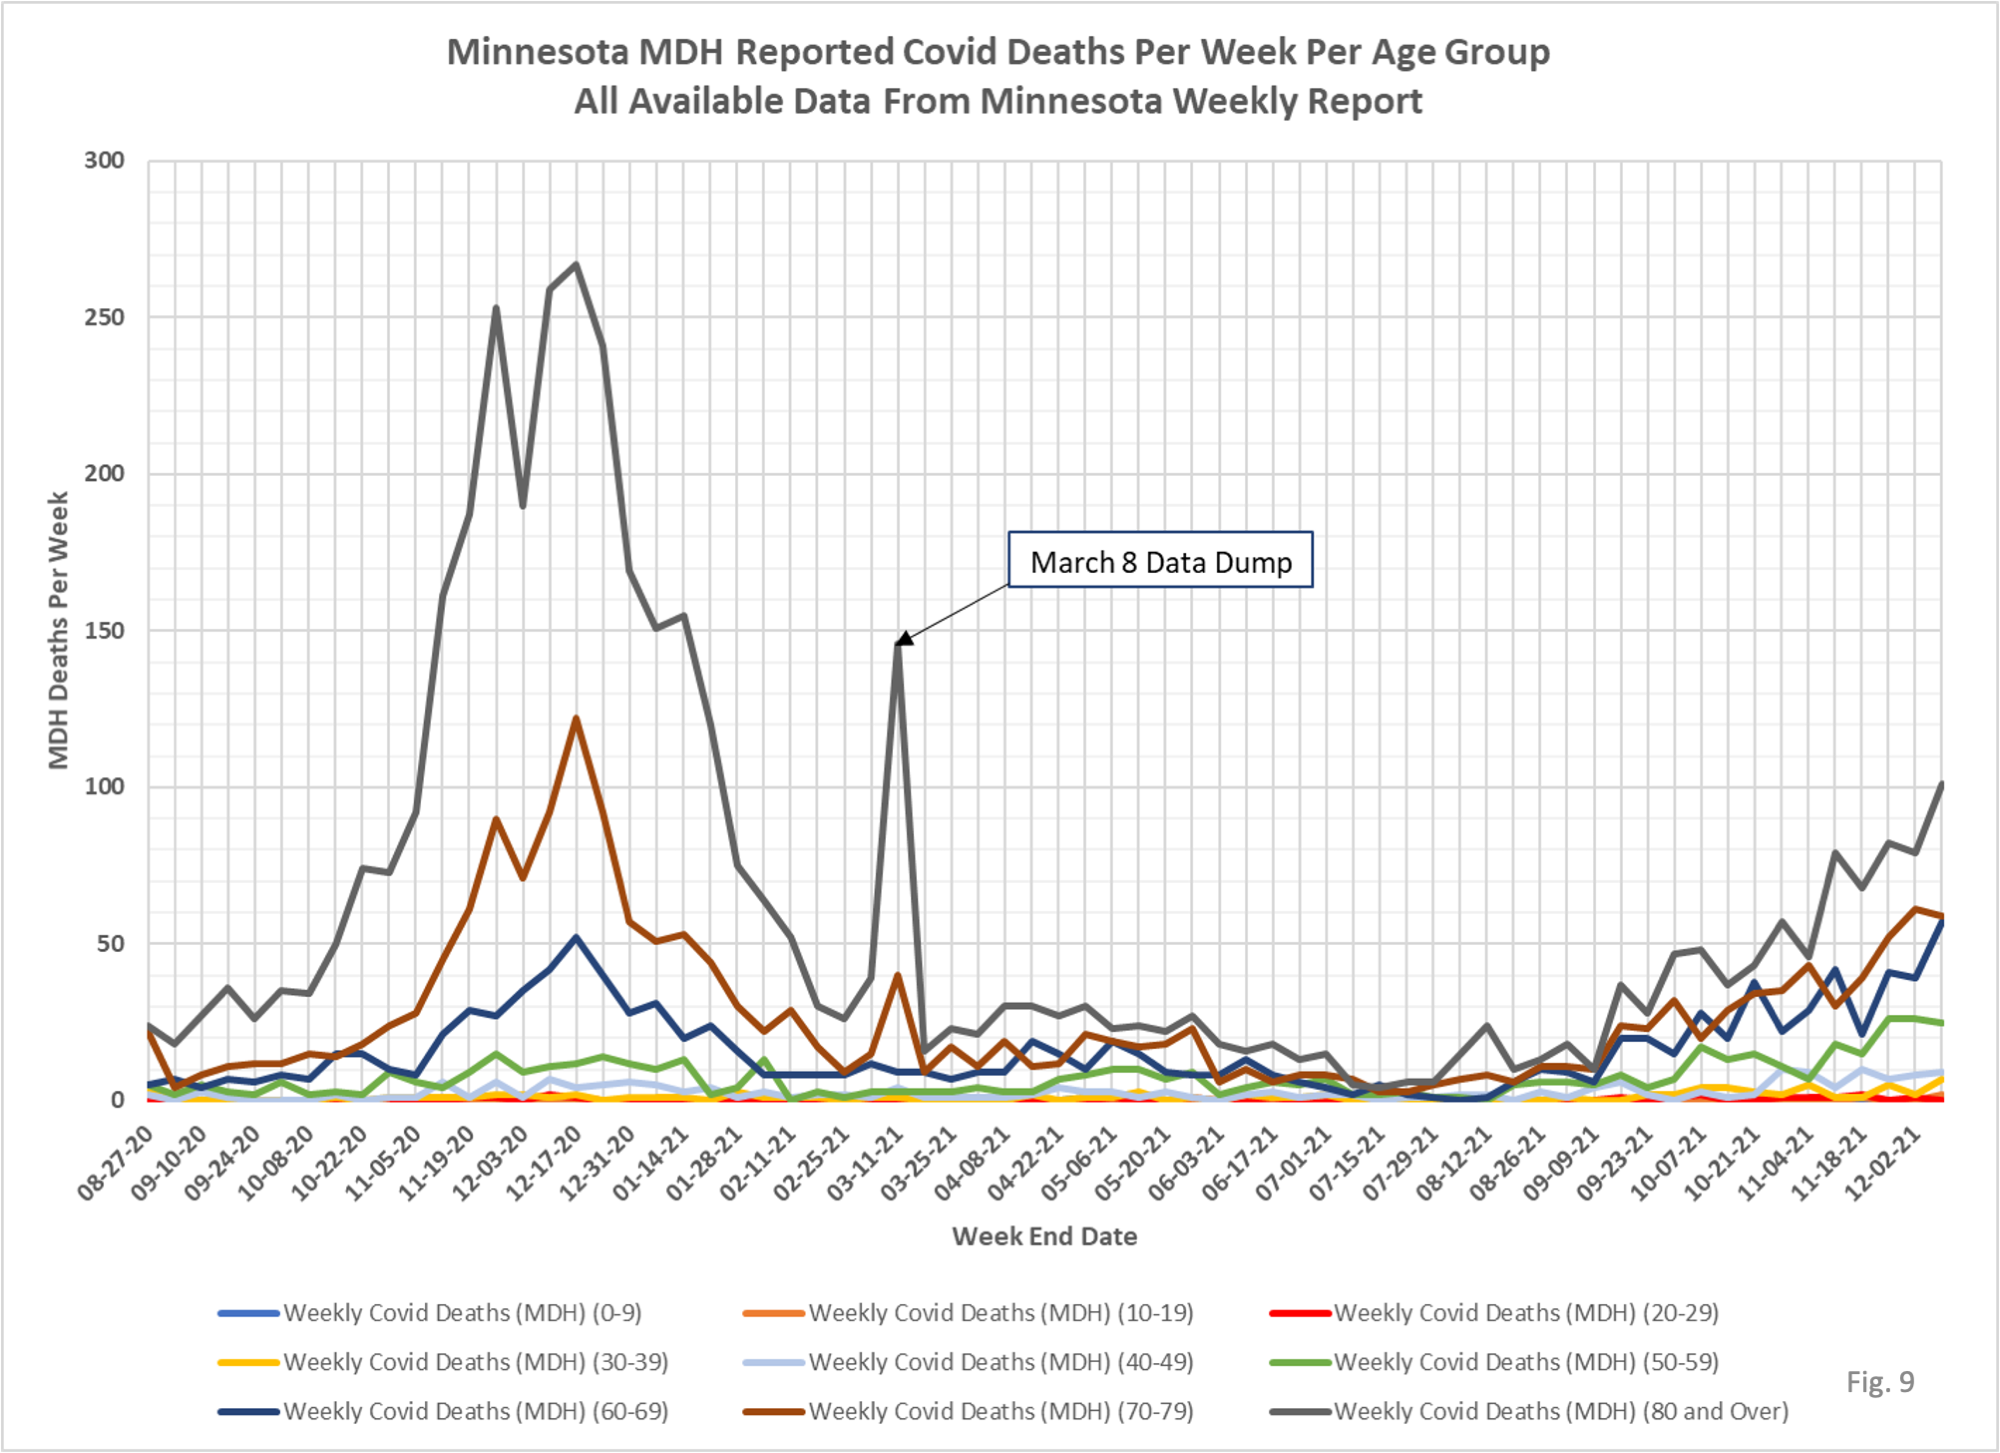
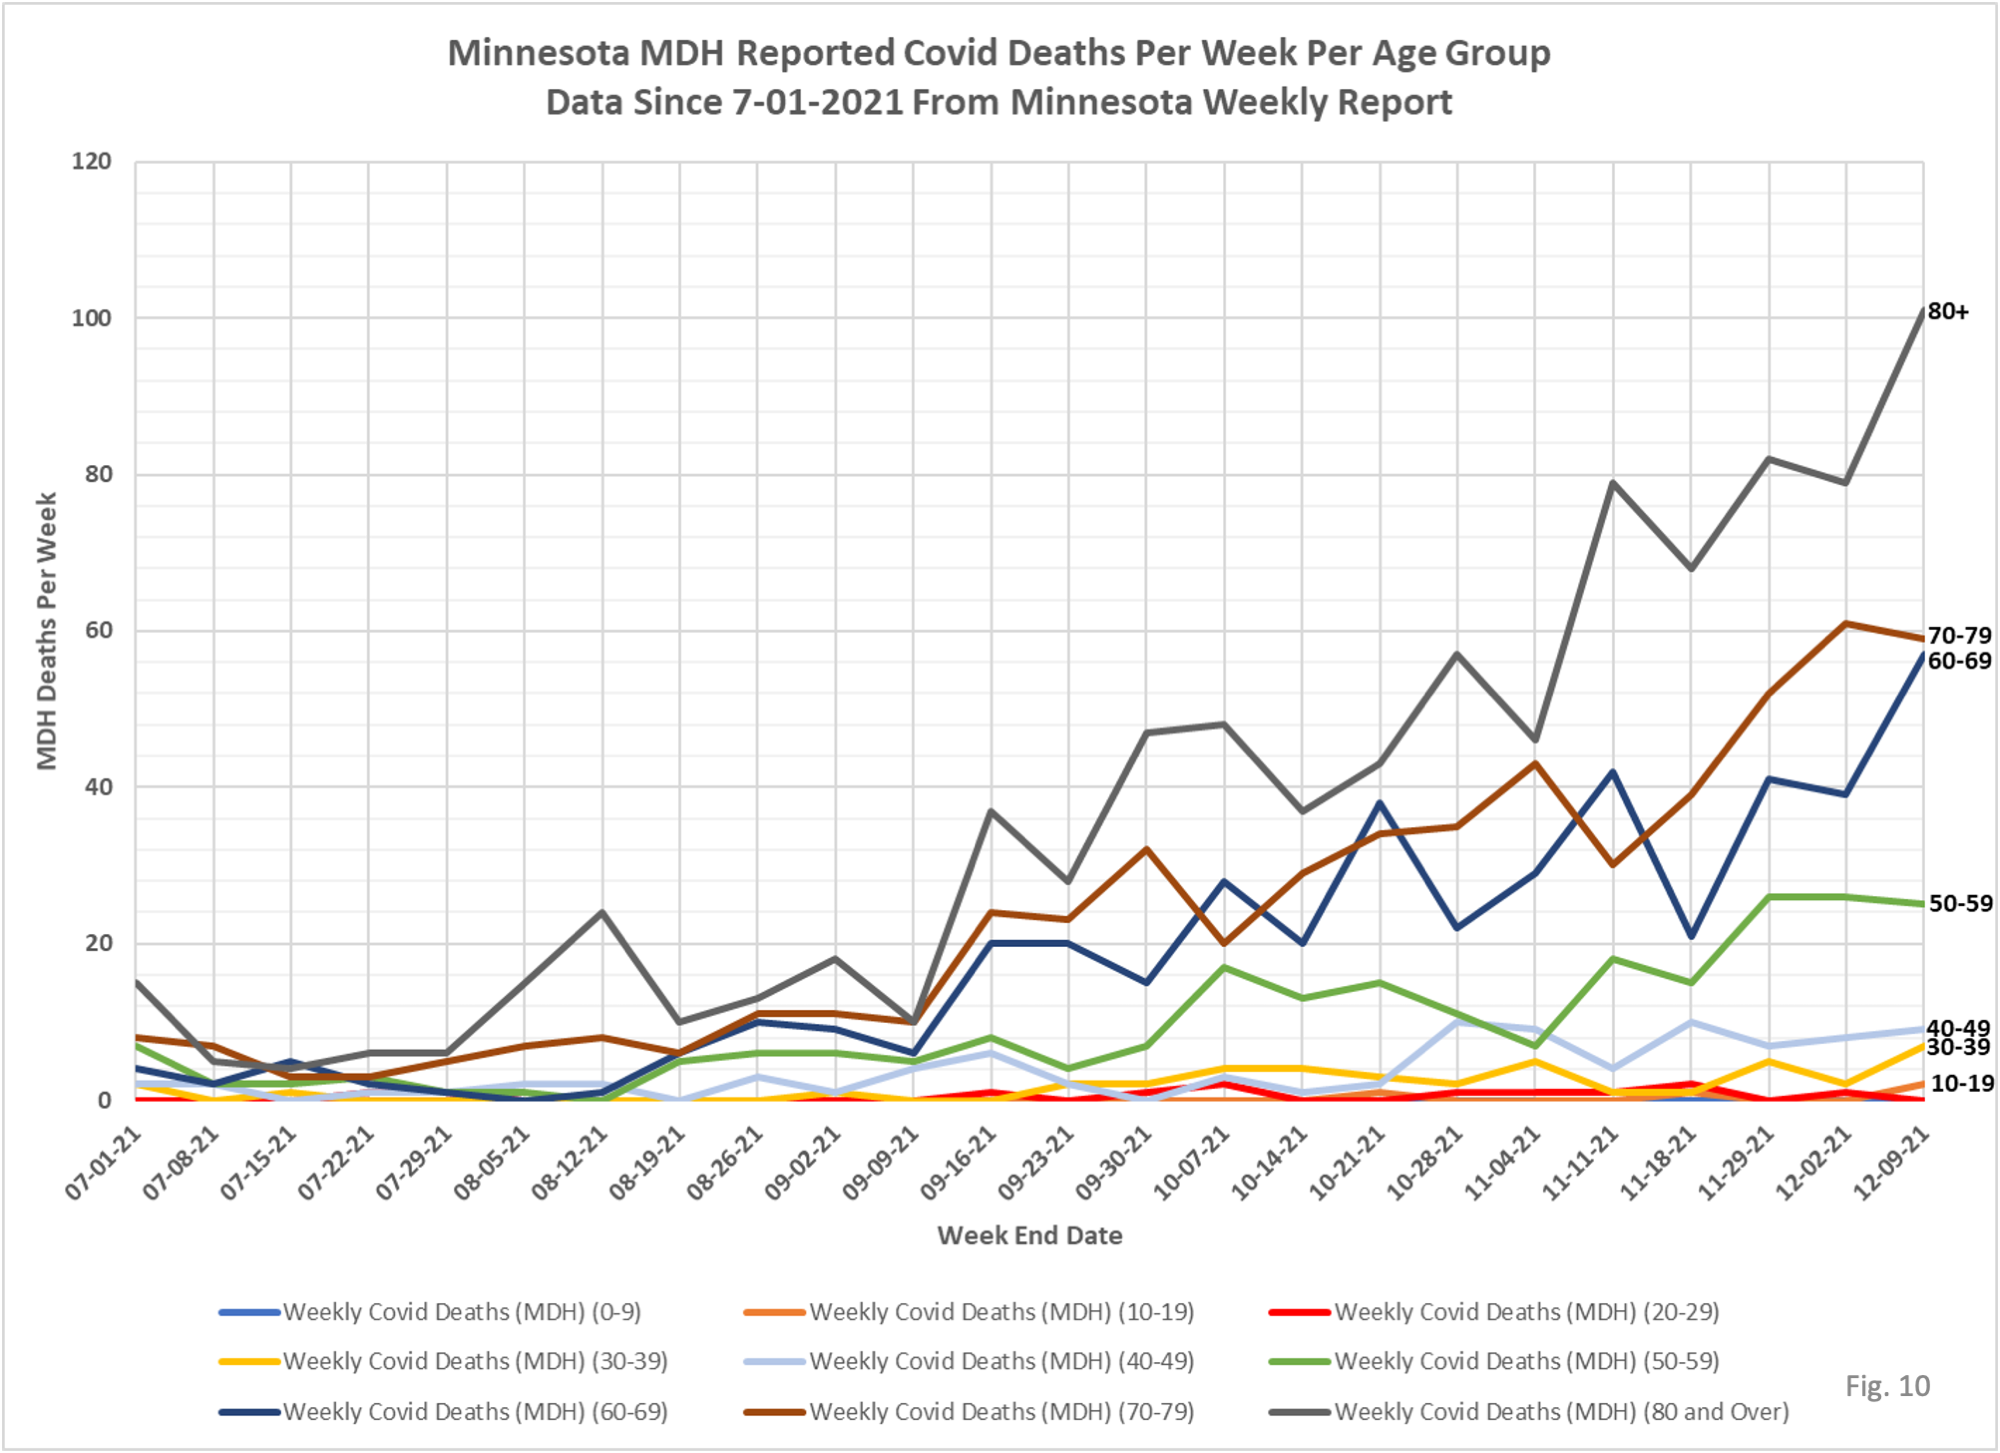
The usual update from Dave Dixon to help look at the age structure charts. Uptick in child hospitalizations, still at low levels and I don’t think many are actually for CV-19 treatment. Deaths in heavily-vaxed 80 year olds still growing rapidly. Dave’s notes:
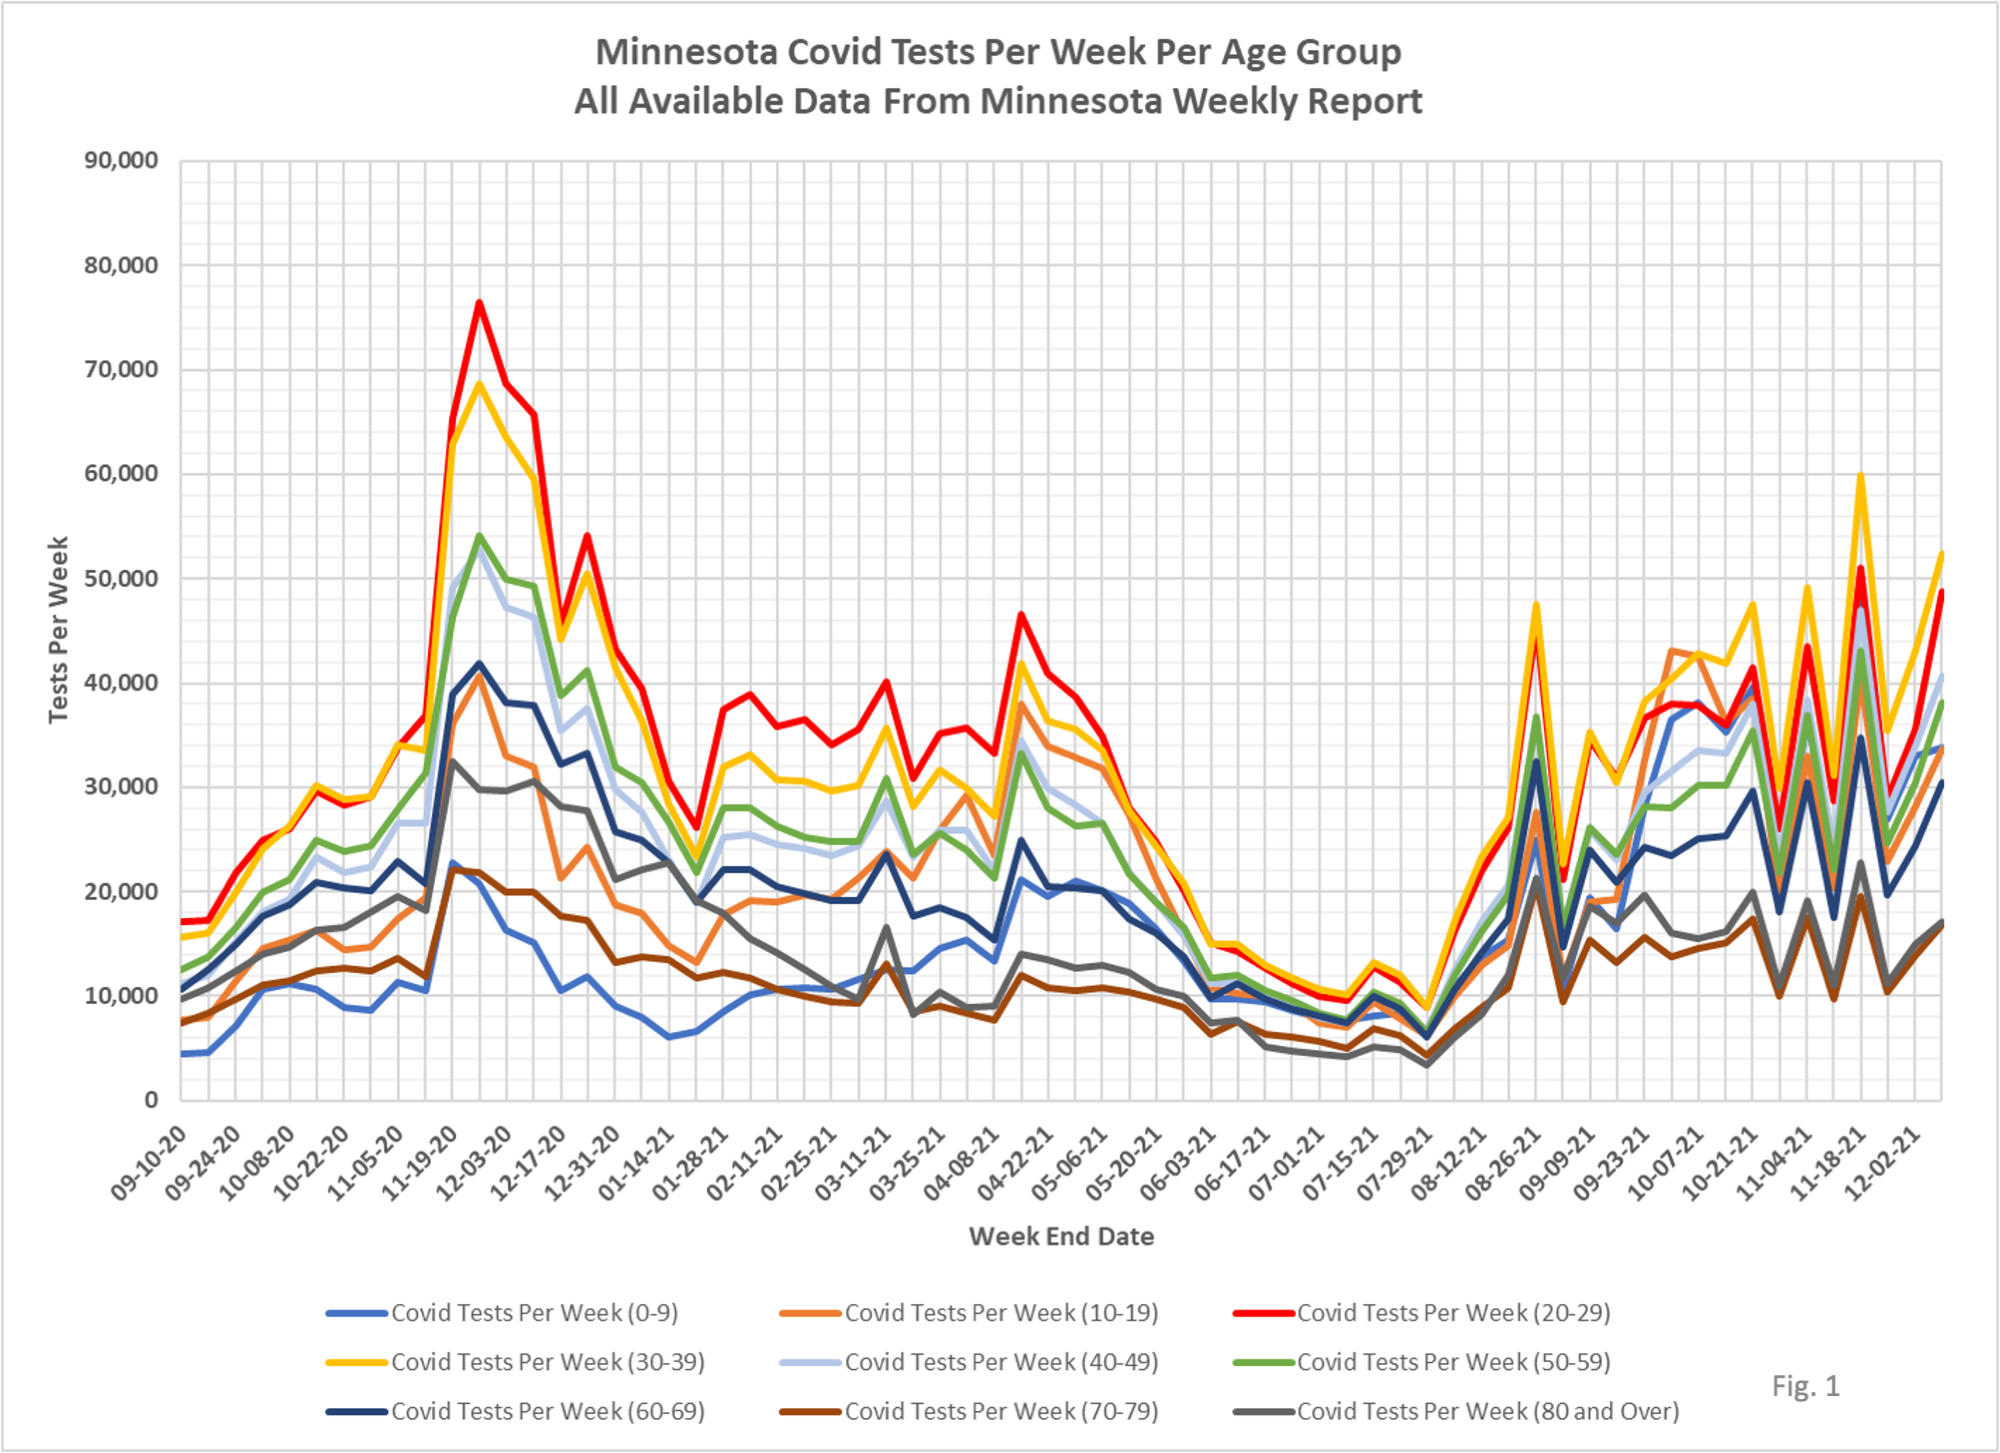
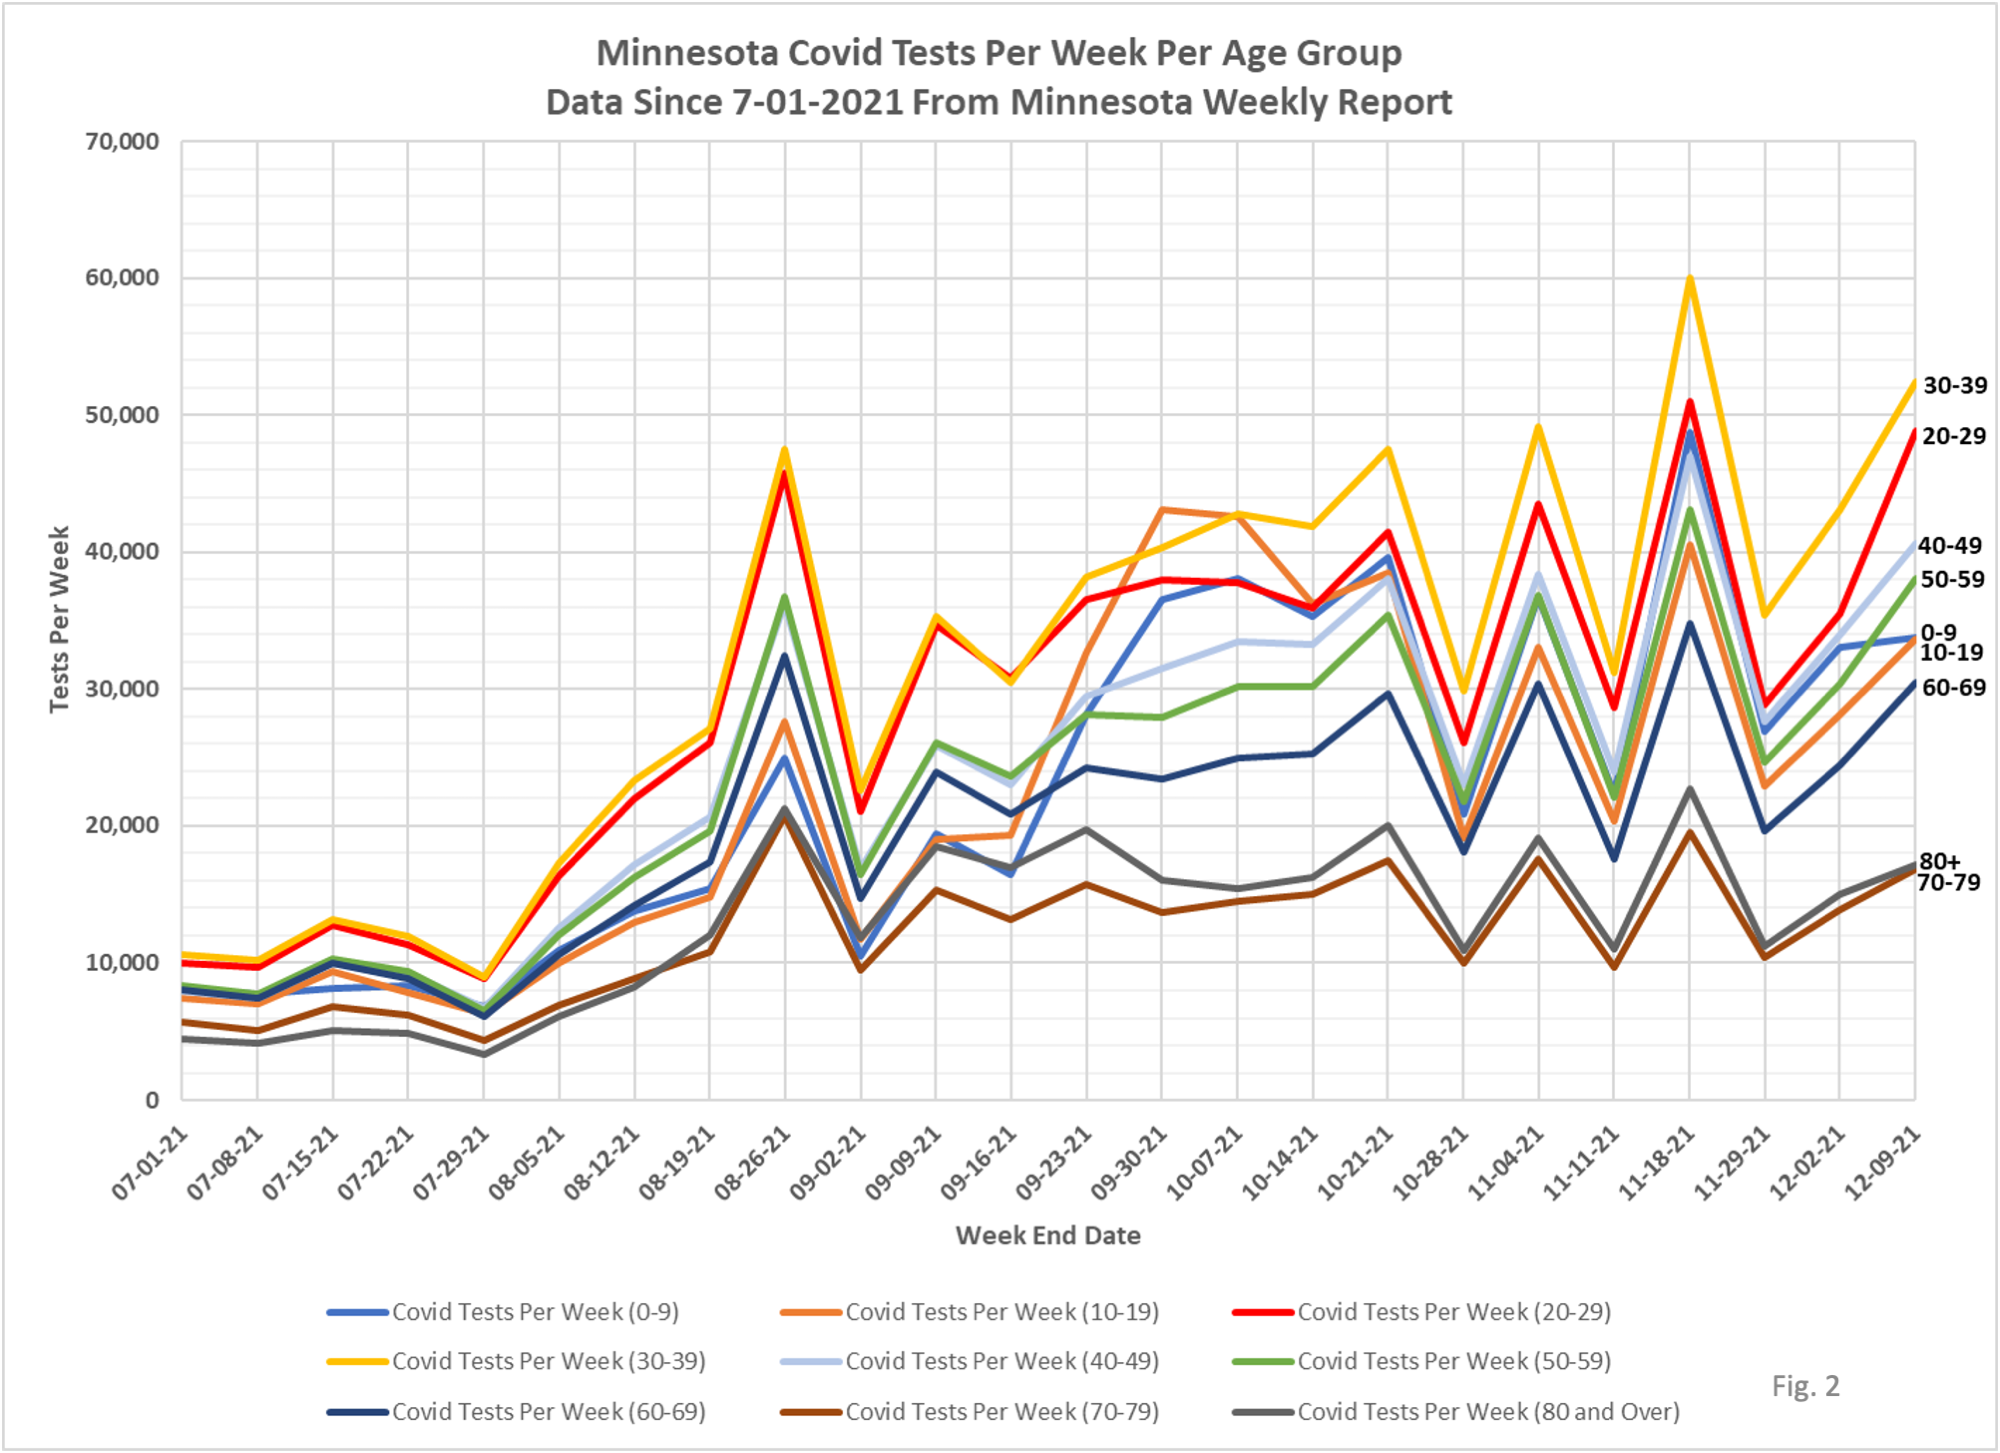
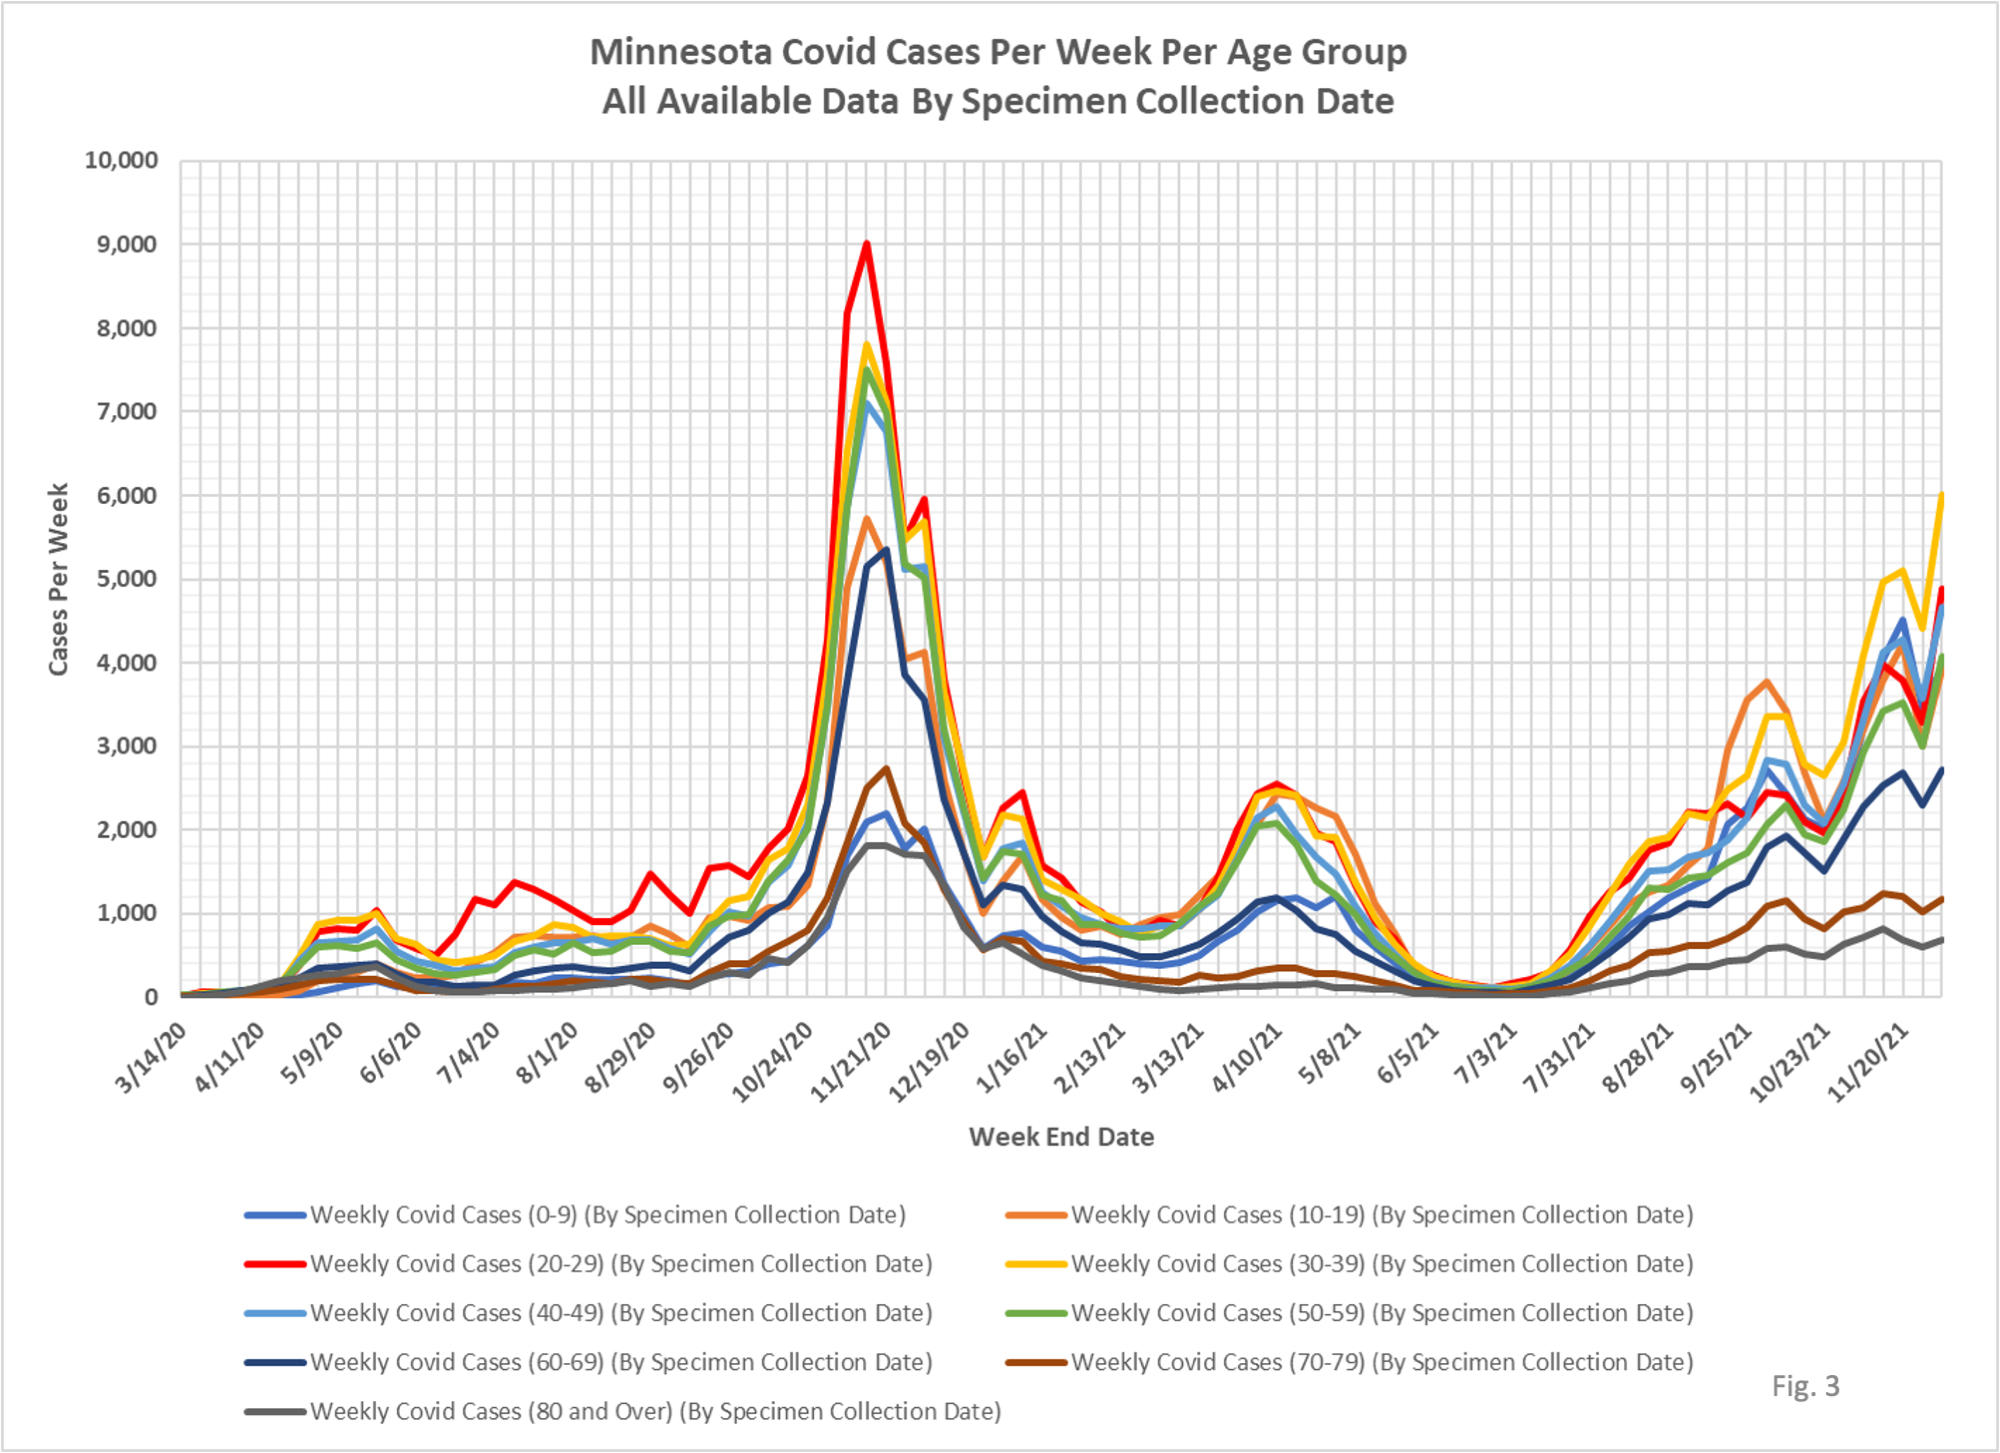
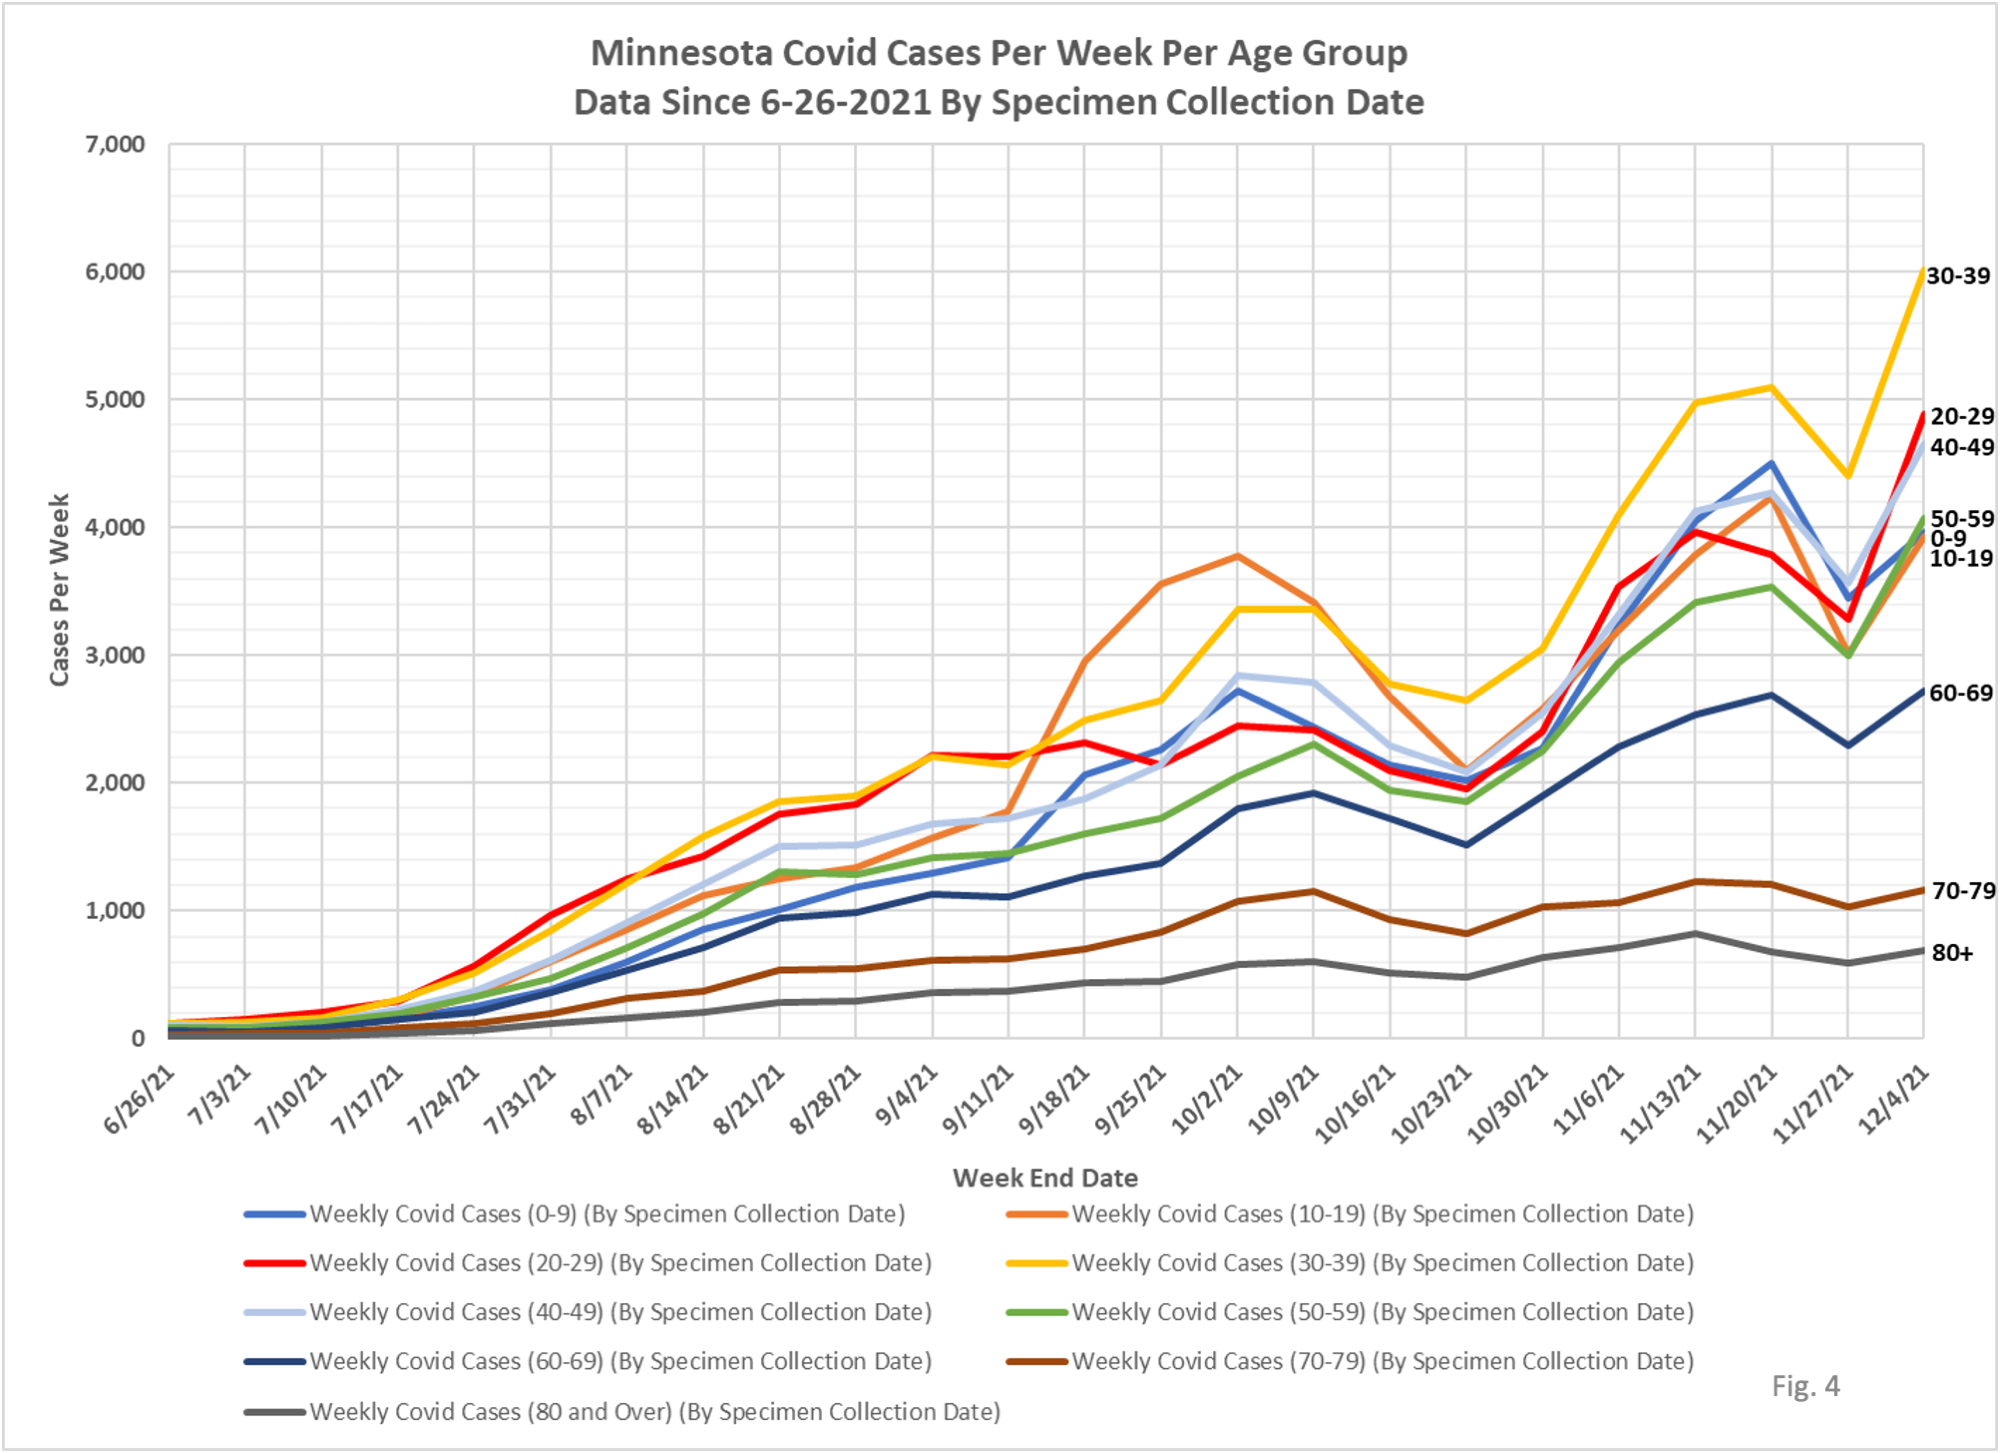
1. As always, there are 2 slides for each set of data, one showing data for the whole pandemic and a second chart showing only data since early July, 2021.
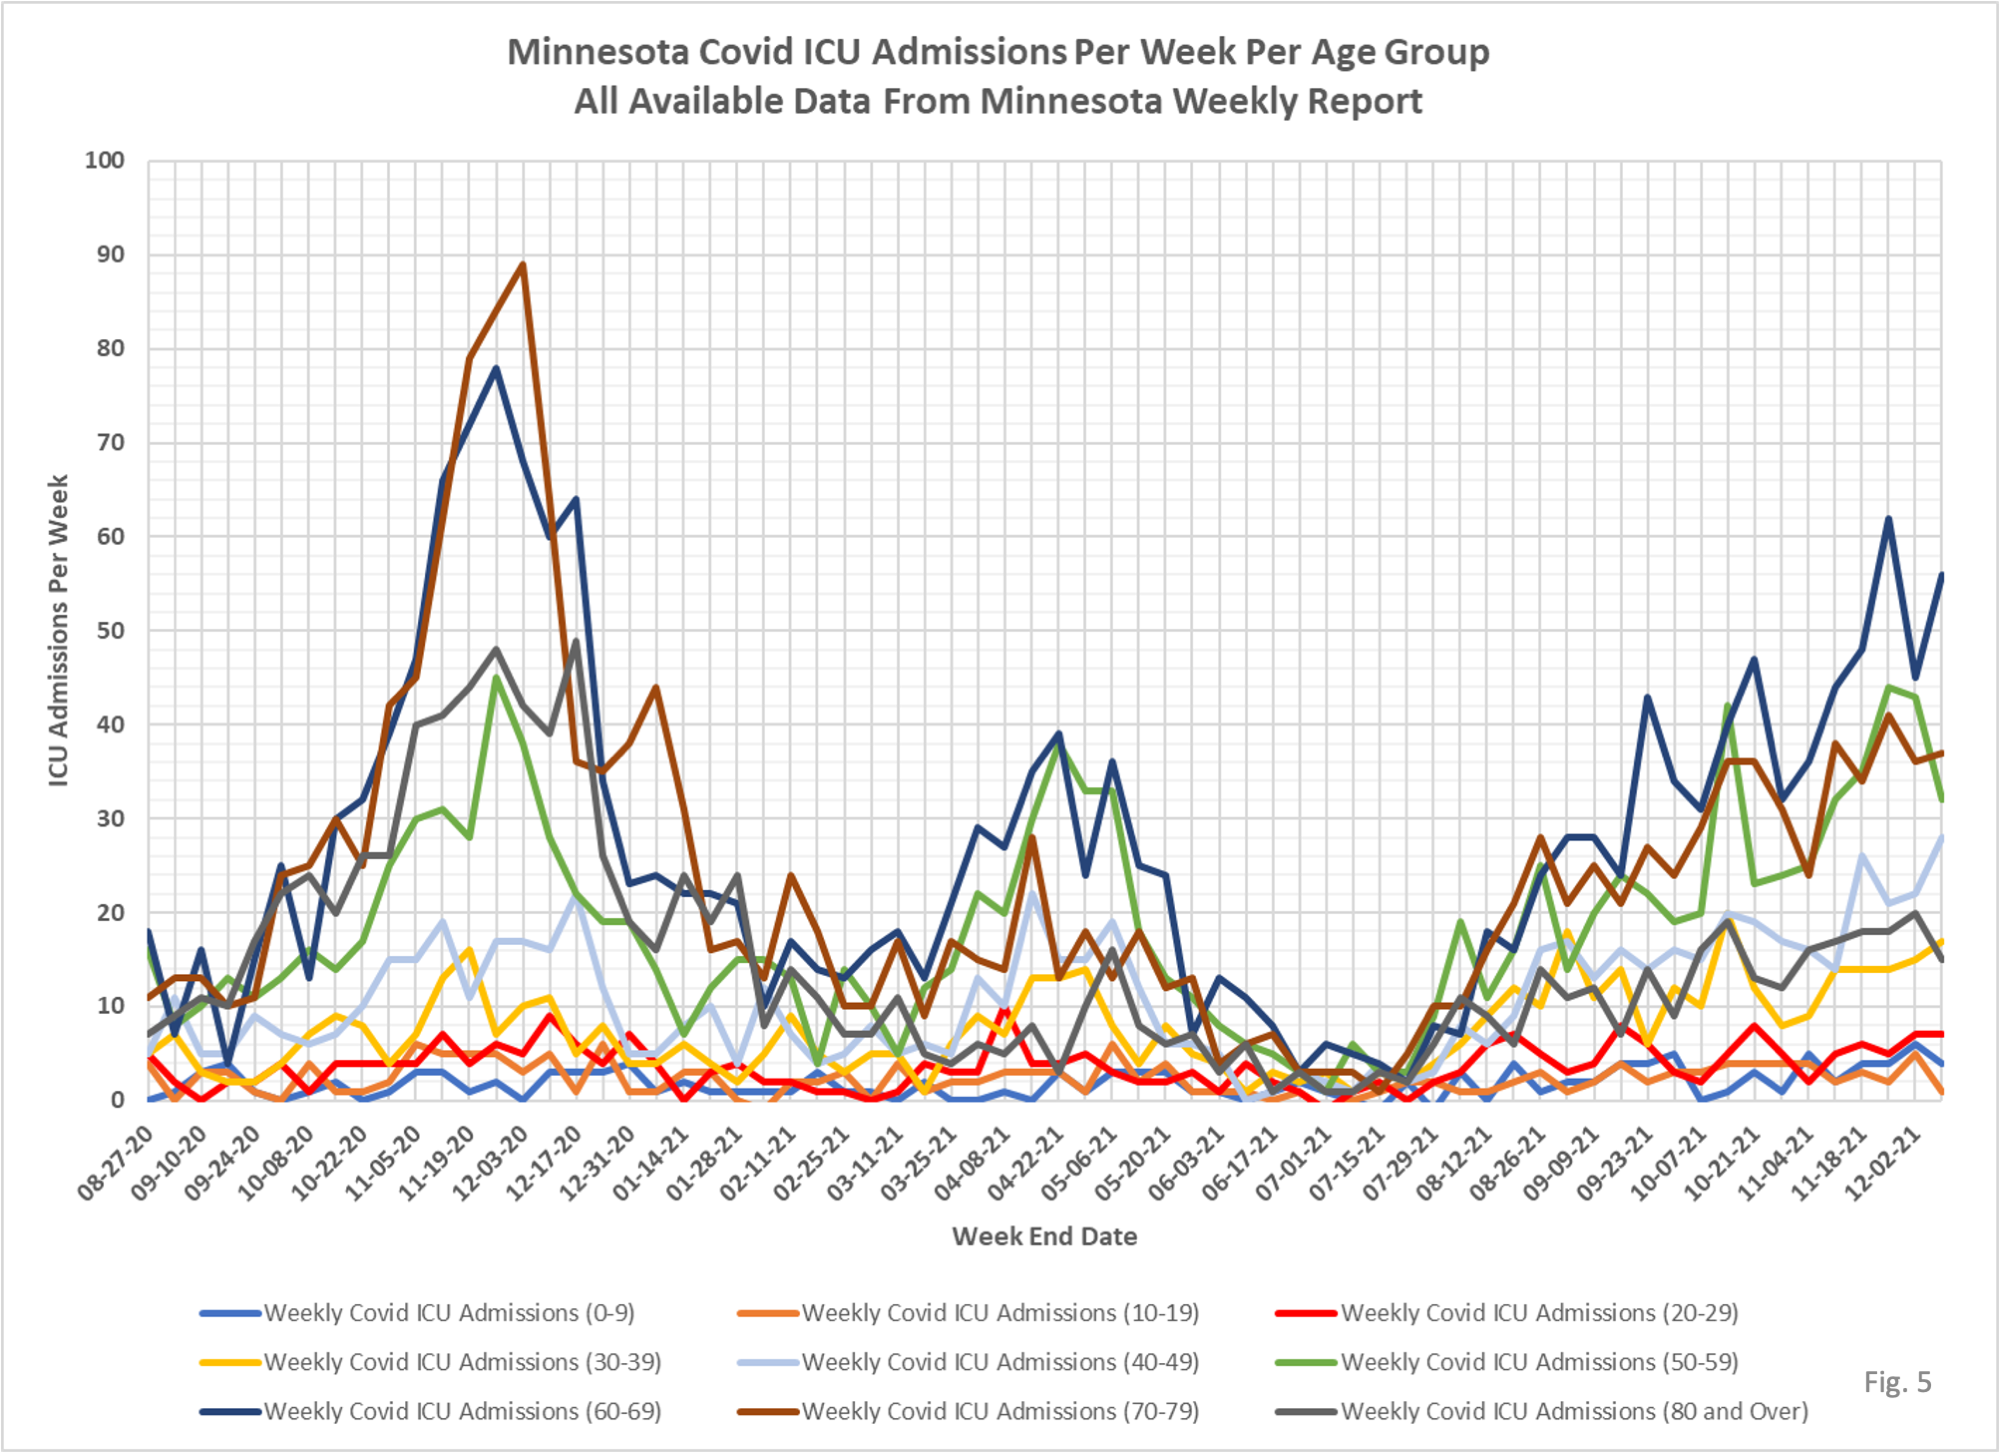
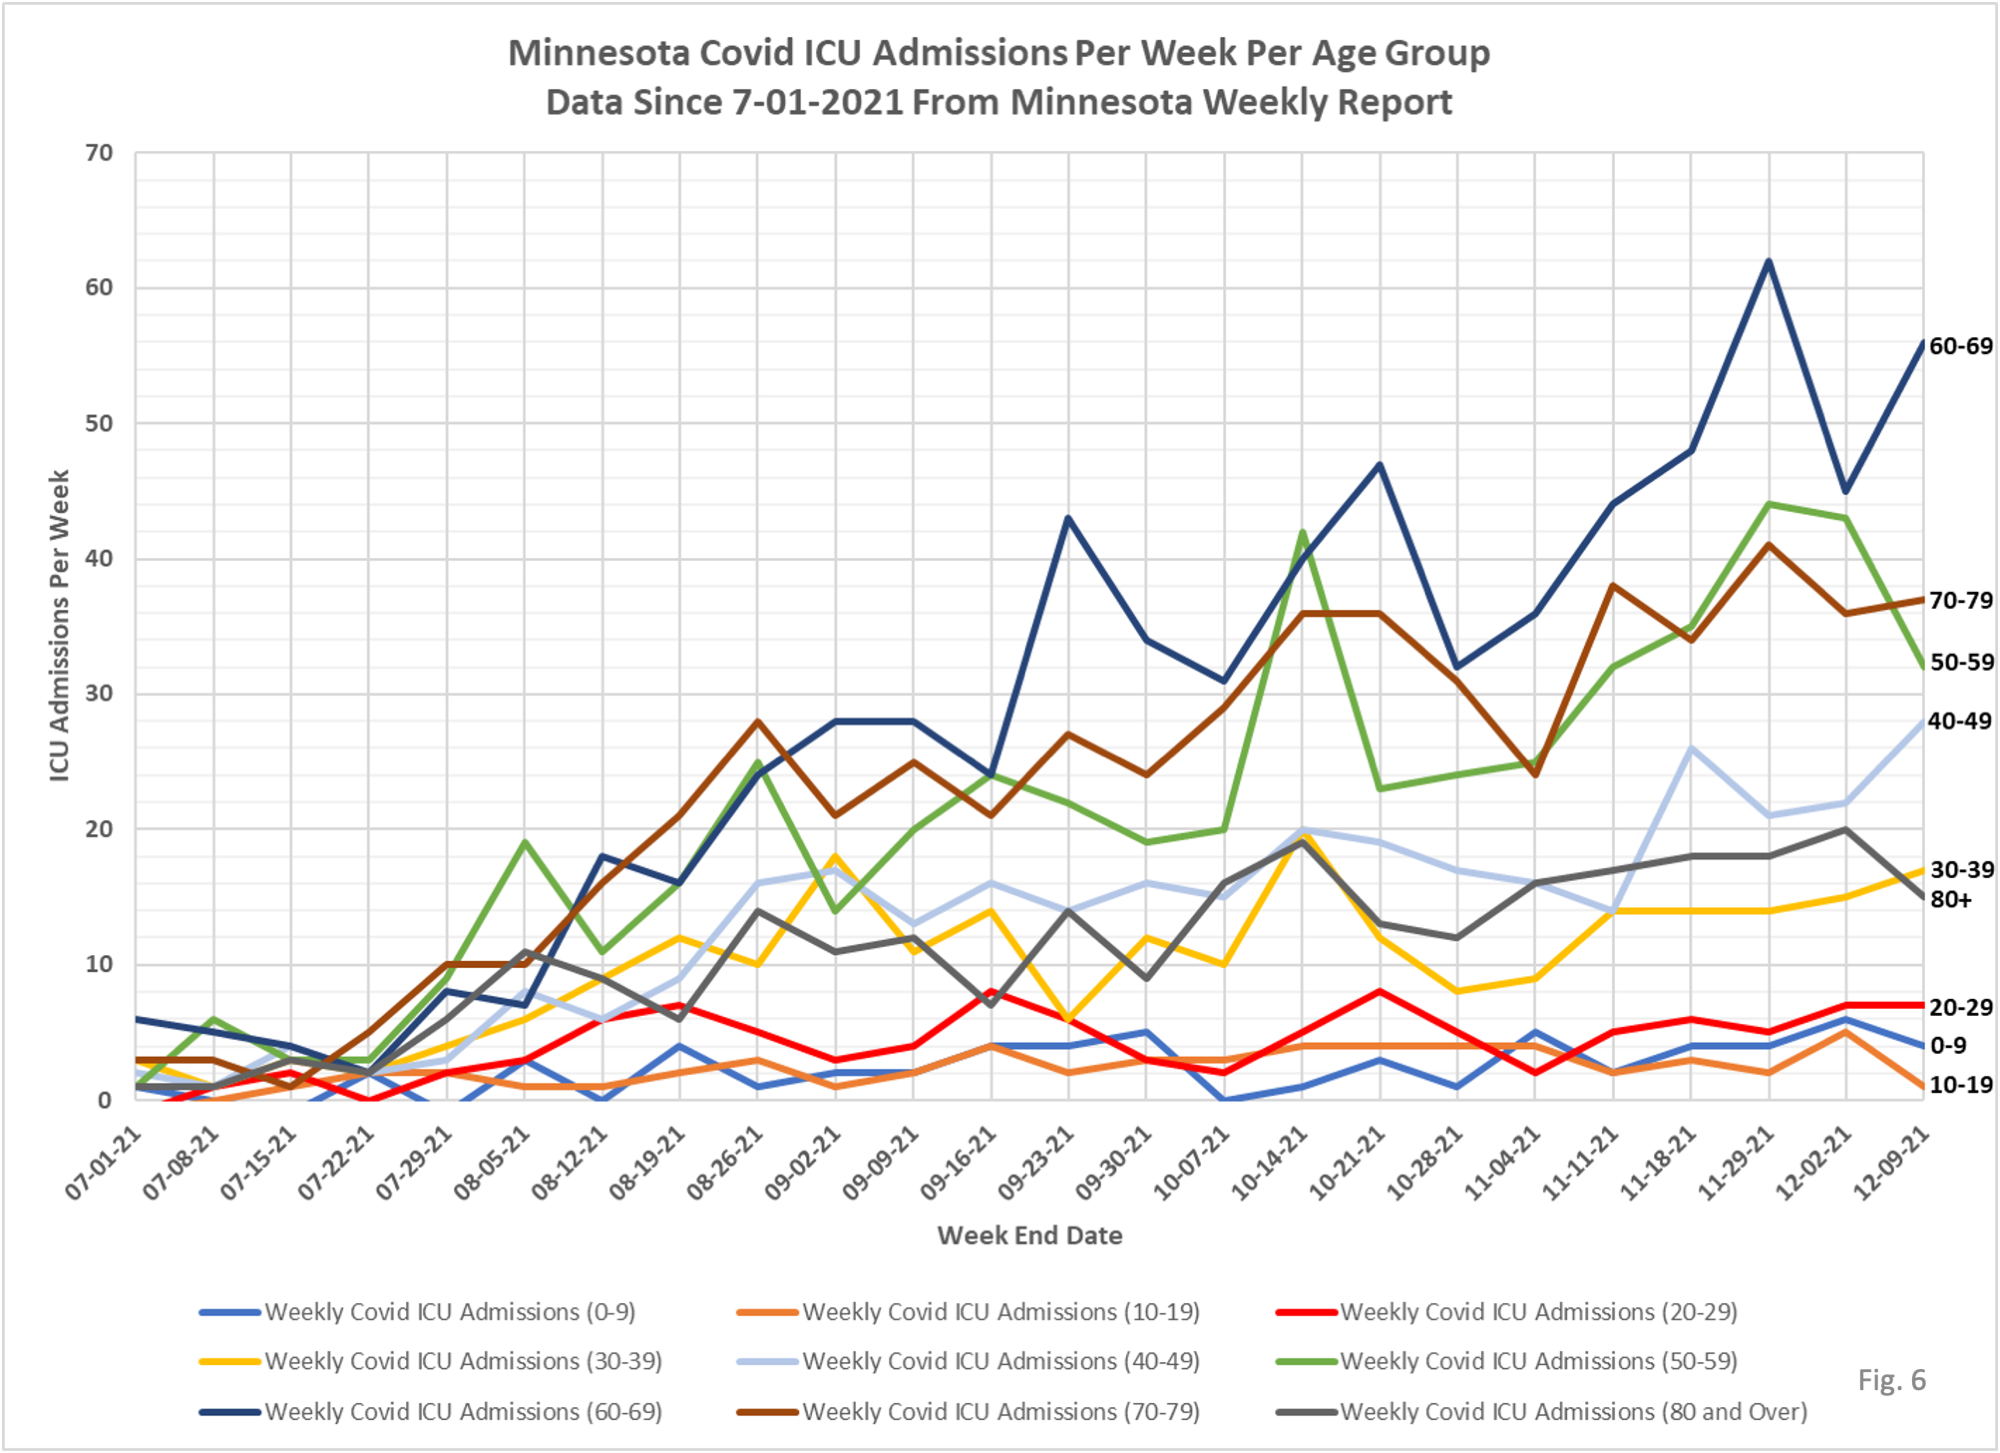
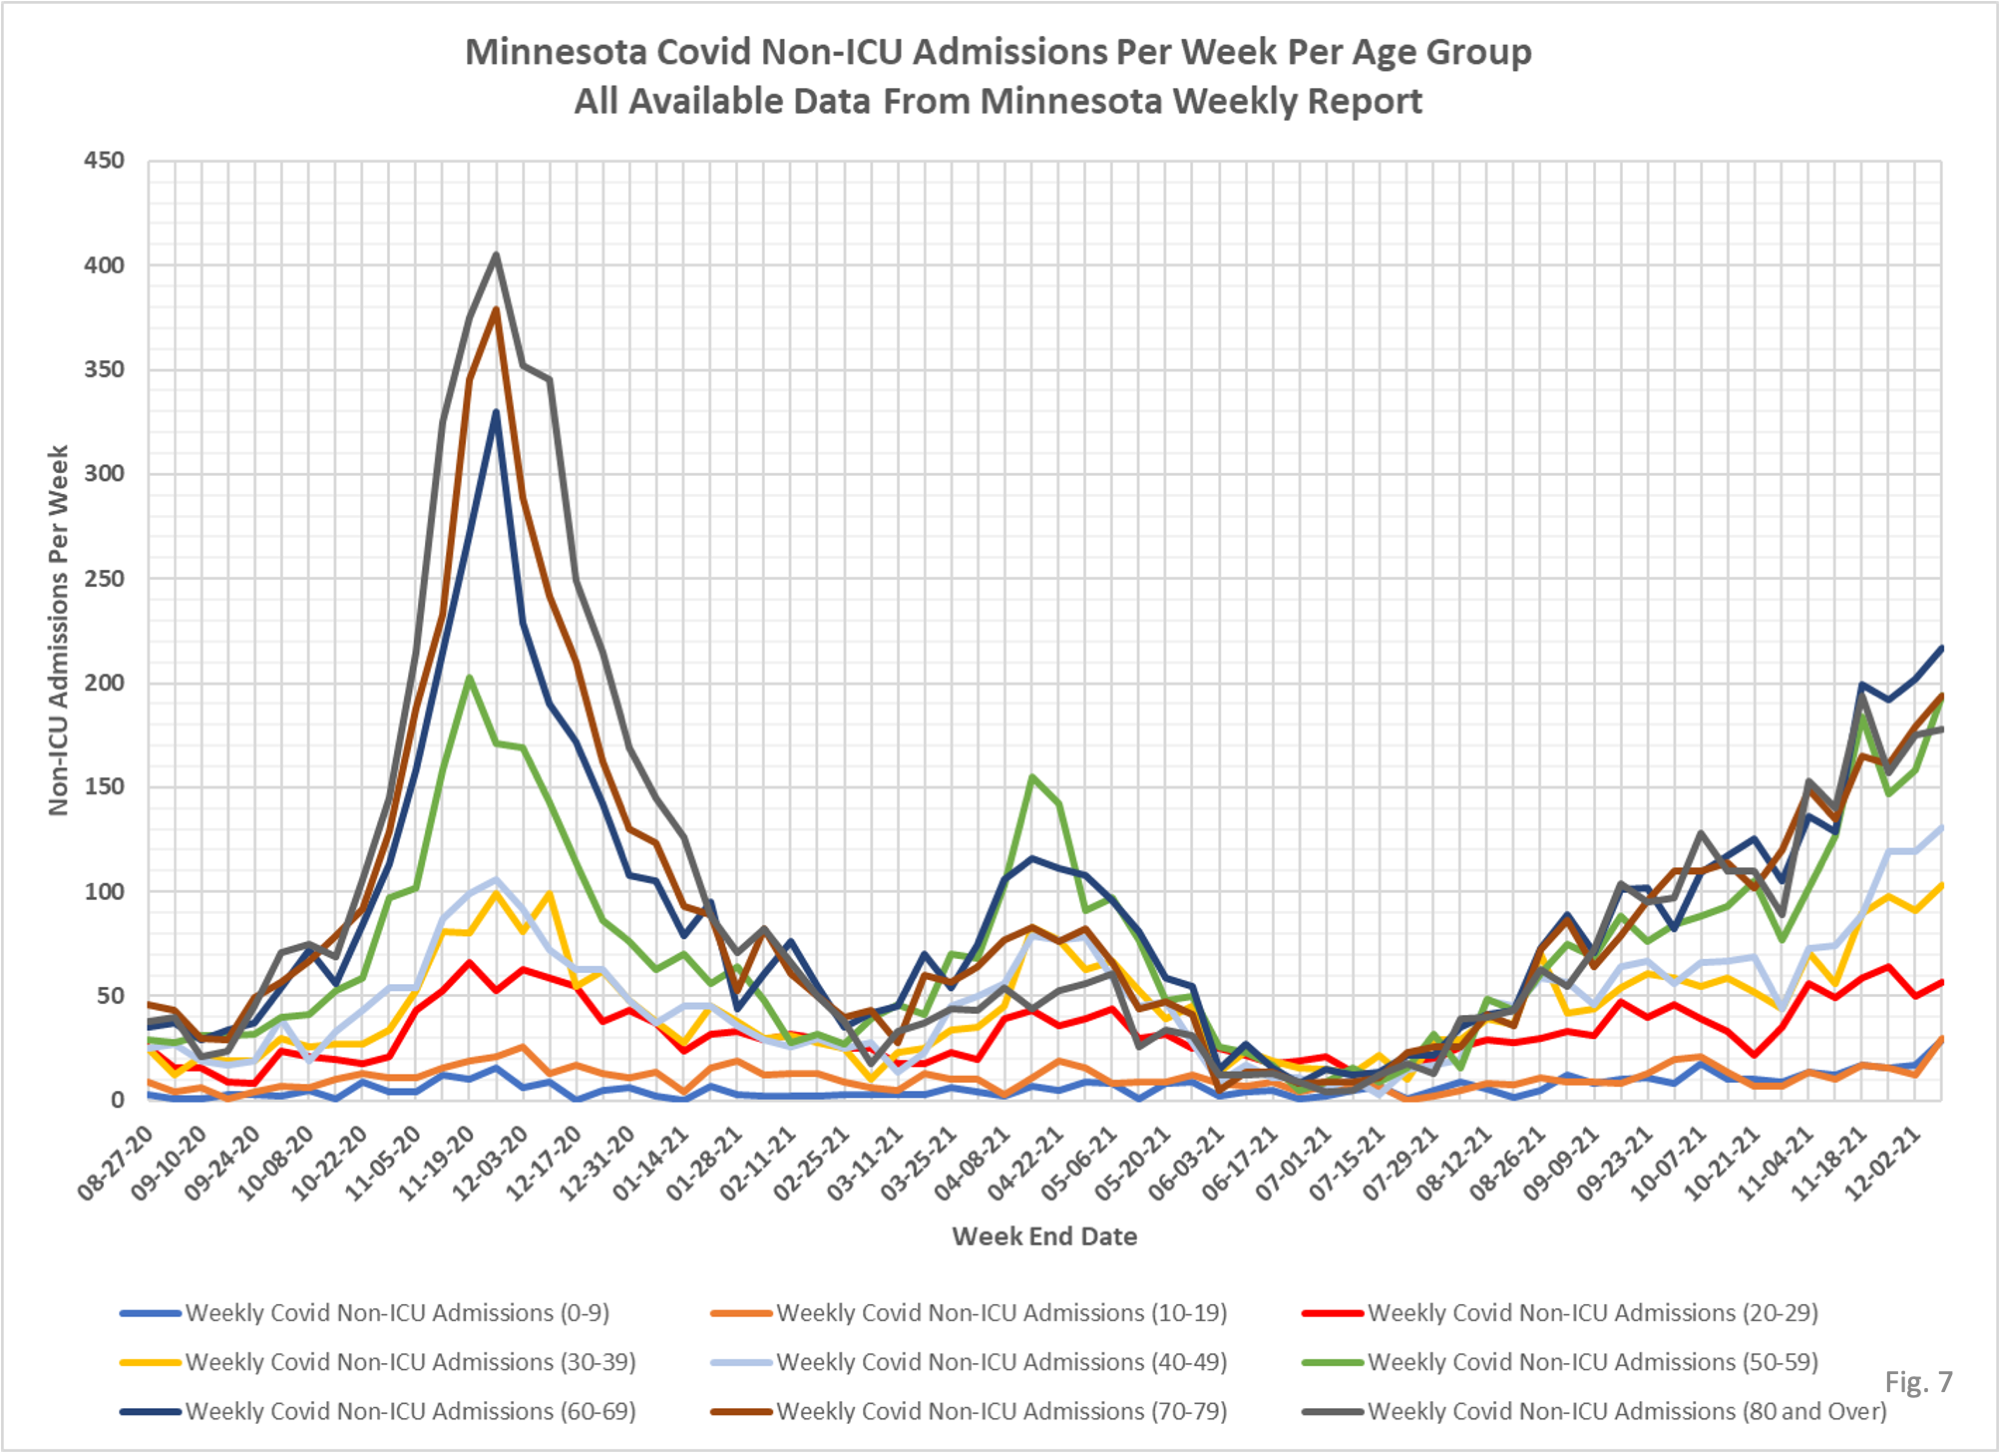
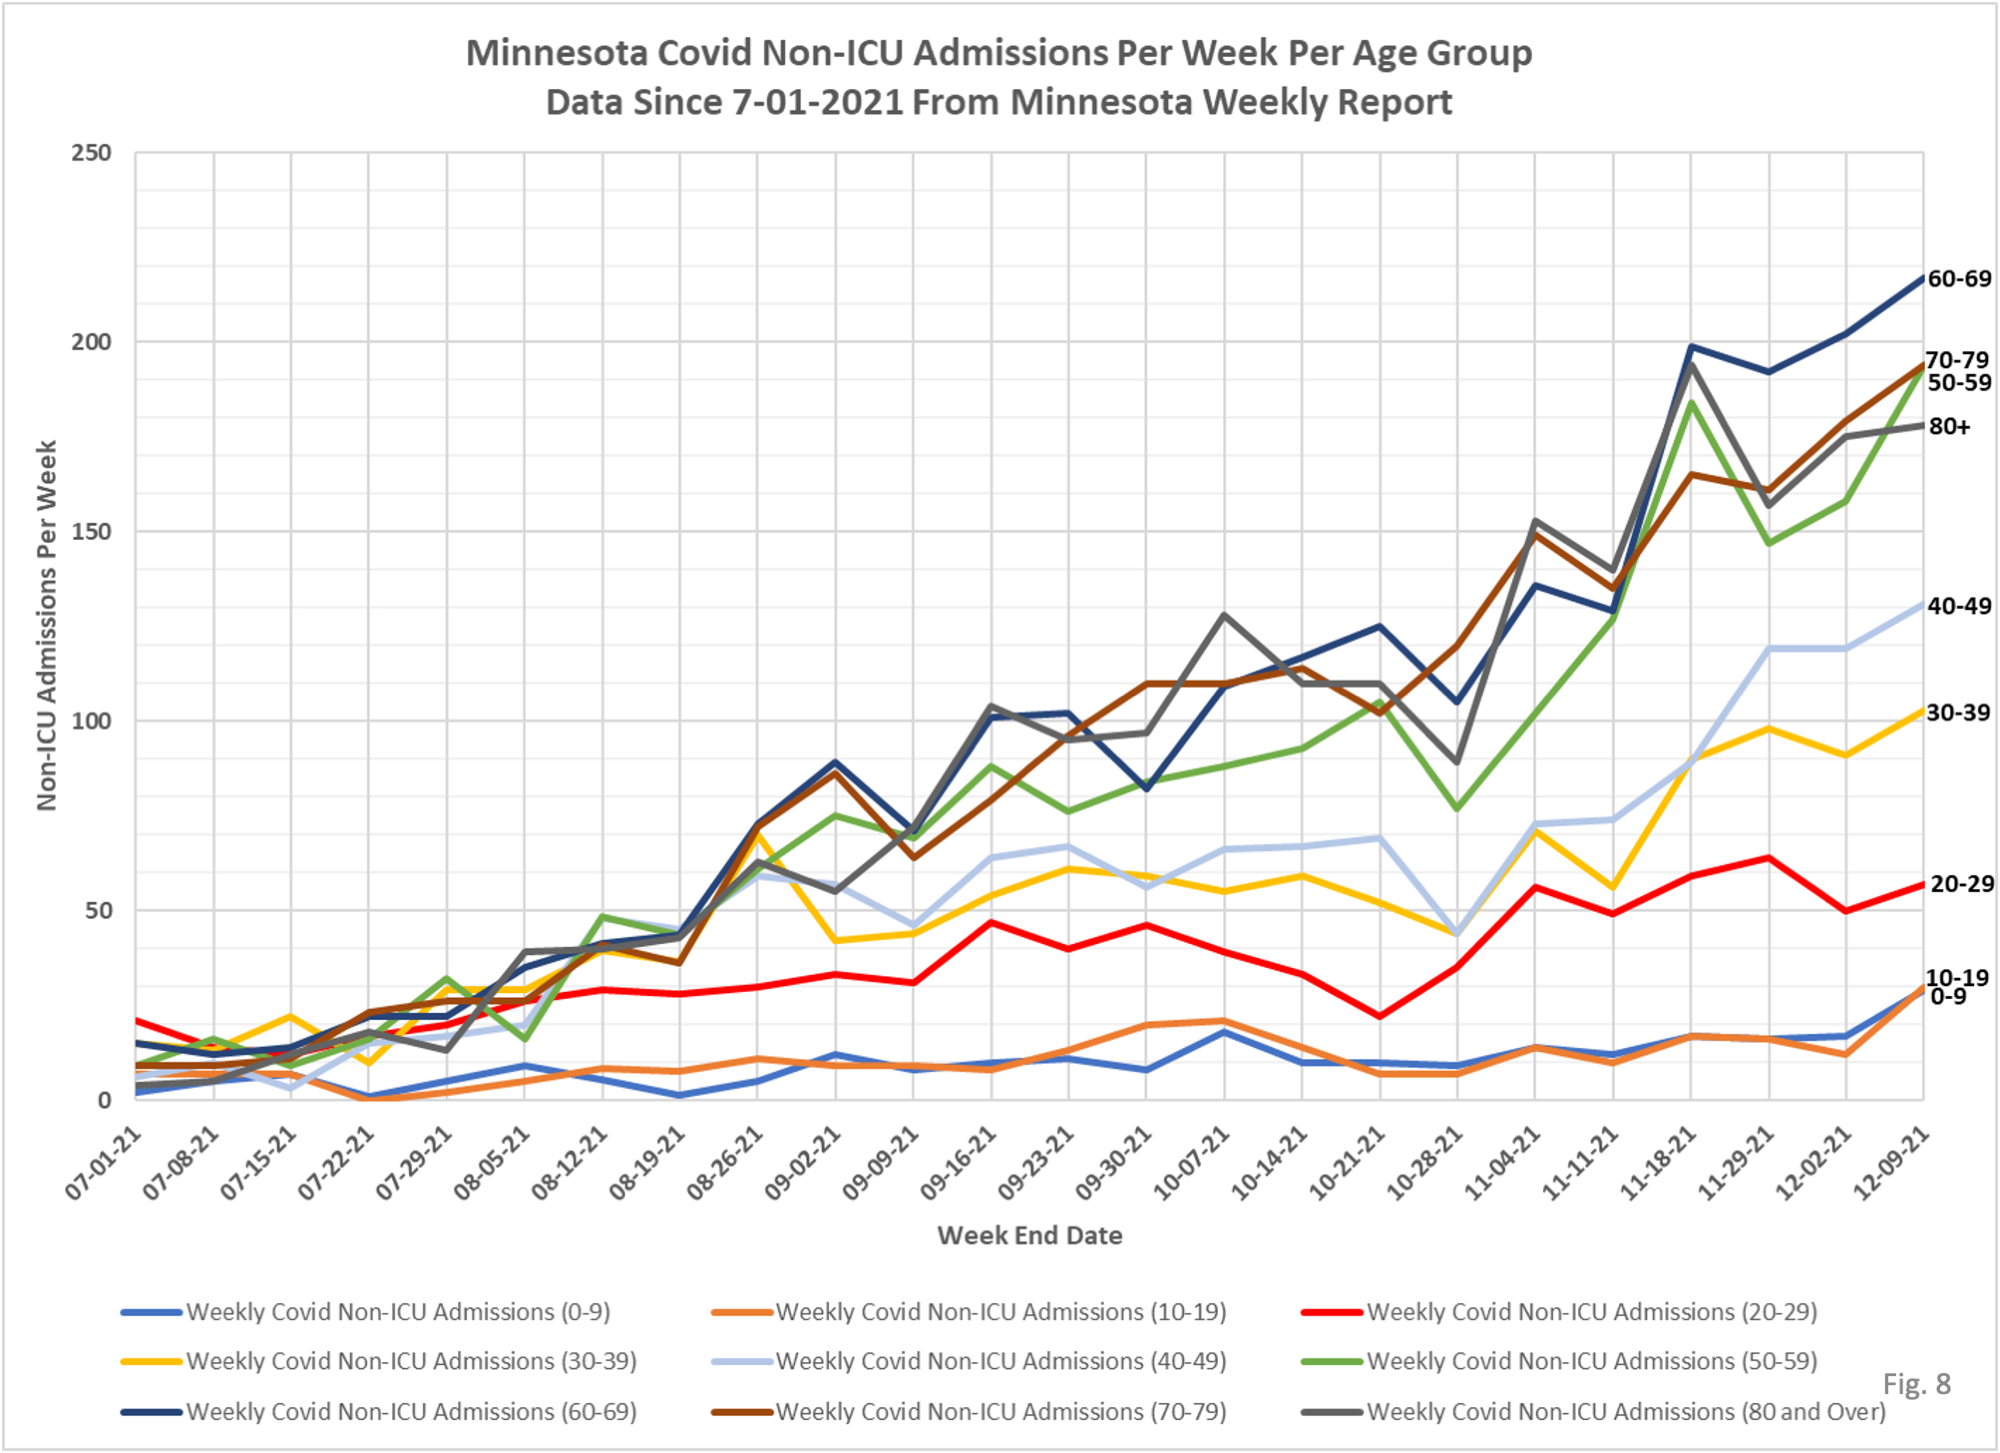
2. The data for the charts on testing, hospital admissions, and deaths comes from the Minnesota Weekly Report (available here: https://www.health.state.mn.us/diseases/coronavirus/stats/index.html). The data in the Weekly Report is presented as cumulative totals for each data type each week. I am taking weekly differences and assembling the data into charts. This data is by date of report, meaning the charts are documenting new events reported this week, even though the underlying event occurred sometime in the past. The data is provided for 5 year age groups, and I am assembling into 10 year age groups to make the charts more readable.
3. The data for the Covid cases per week come from a data file published along with the Minnesota Weekly Report, here: https://www.health.state.mn.us/diseases/coronavirus/stats/index.html#wagscd1 This data is published by date of specimen collection, rather than by date of report as the other data is. The data is provided as cases per week in 5 year age groups. I am compiling the data into 10 year age groups in order for the charts to be more readable.
4. Fig. 1 and 2: Covid Tests Per Week. For the first time in 7 weeks the week over week trend in testing looks ‘real’, versus the sawtooth pattern we have been seeing since 10/21/2021. I should note that on the Situation Update page https://www.health.state.mn.us/diseases/coronavirus/situation.html testing, since 12/01/2021, has been reported by date of specimen collection, rather than by date of analysis as it was prior. However, there no notes regarding changes to reporting in the Minnesota Weekly Report. Further investigation will be needed to determine if MDH is now reporting tests per week by specimen collection date, or tests per week by date of analysis or date of report.
5. Fig. 3 and 4: Covid Cases Per Week. The Covid cases per week were higher this week for all age groups, following the case trend seen in data published on the Situation Update page. Cases were lower the week ending 11/27/2021 primarily due to dramatically lower testing on Thanksgiving day. Total cases for the week were reported as 32,111, an increase of 30.4% over last week’s total.
6. Fig. 5 and 6: ICU Admissions Per Week. ICU admissions were lower in the younger age groups. There were 4 reported Covid ICU admissions in the 0-9 age group in this Weekly Report, 1 in the 10-19 age group, and 7 in the 20-29 age group for the second week in a row. There remains very little evidence of severe Covid infections for school age children, with little change in the rate of childhood ICU admissions over many months. Total ICU admissions for the week were 197, little changed from 199 the prior week.
7. Fig. 7 and 8: Non-ICU Admissions Per Week. Non-ICU admissions were higher in all age groups for the week, especially in the older age groups. Non-ICU Covid admissions for the younger age groups also saw relatively large increases, exceeding the admissions per week seen at the height of the late 2020 surge. The 0-9 age group increased from 17 to 30 Non-ICU Covid admissions for the week, and the 10-19 admissions increased from 12 to 30 for the week. Total Non-ICU Covid admissions for the week were 1133, an increase of 130 admissions from the 1003 admissions last week.
8. Fig. 9 and 10: Deaths Per Week. Total reported deaths for the week were 260, a large increase from 216 reported deaths the week before. The 80+ age group increased from 79 to 101 for the week, and the 60-69 age group increased from 39 to 59. All other age groups were little changed.

The PCR kit is the tool being used/manipulated to deploy and sustain the current PCR “pandemic”. No wonder the data shows it!
If one follows the CR7 PCR Method one will never win a “positive” PCR kit ever again.
https://i.postimg.cc/vTcWVdGB/love-festival.png
Are the increases because of vaccine ineffectiveness? Also I’m seeing two prominent, approximate start dates. July for the upper charts and Sept. for the lower charts, why is that?
Can you please share the value of following ‘tests’, ‘cases’ and ‘hospitalizations’? ALL of this data is, and has been, bastardized by the process since day 1. Deaths/Thousand (probably divided by 4 due to the CARES Act pay-2-play) is about the only meaningful metric. That number would look very much like historical influenzas. Everything else is pandemic theatre …