The title of this post should be: PRIOR INFECTION-DERIVED ADAPTIVE IMMUNITY FOR THE WIN! Since the state has started providing reinfection data, Dave Dixon is trying to identify relative rates of cases in the previously infected, the fully vaxed and the unvaxed (which actually includes partially vaxed persons). This is tricky and DOH doesn’t make it easy. One problem is not knowing overlap of prior infected and vaxed persons. AS Dave Dixon indicates below, as time from vaccination increases, reinfection rates become substantially lower than breakthrough rates. No matter what DOH tells us there is some weird data thing going on this fall in cases reported in the unvaxed, see that spike down then back up. Dave’s notes:
Comments, Sources, and Methods:
1. Since 11/2/2021 Minnesota Department of Health (MDH) has published Covid reinfection data on the Minnesota Situation Update for COVID-19 web page: https://www.health.state.mn.us/diseases/coronavirus/situation.html Reinfections are defined as a person testing positive for Covid more than 90 days after a prior positive test.
“Confirmed” reinfections are defined as a positive PCR test following a positive antigen test. Probable is defined as a negative PCR test following a positive antigen test. It is implied, similar to cases, that a PCR positive test is considered “Confirmed” and a positive antigen test is considered “Probable”. For purposes of this analysis all Confirmed and Probable reinfections will be included.
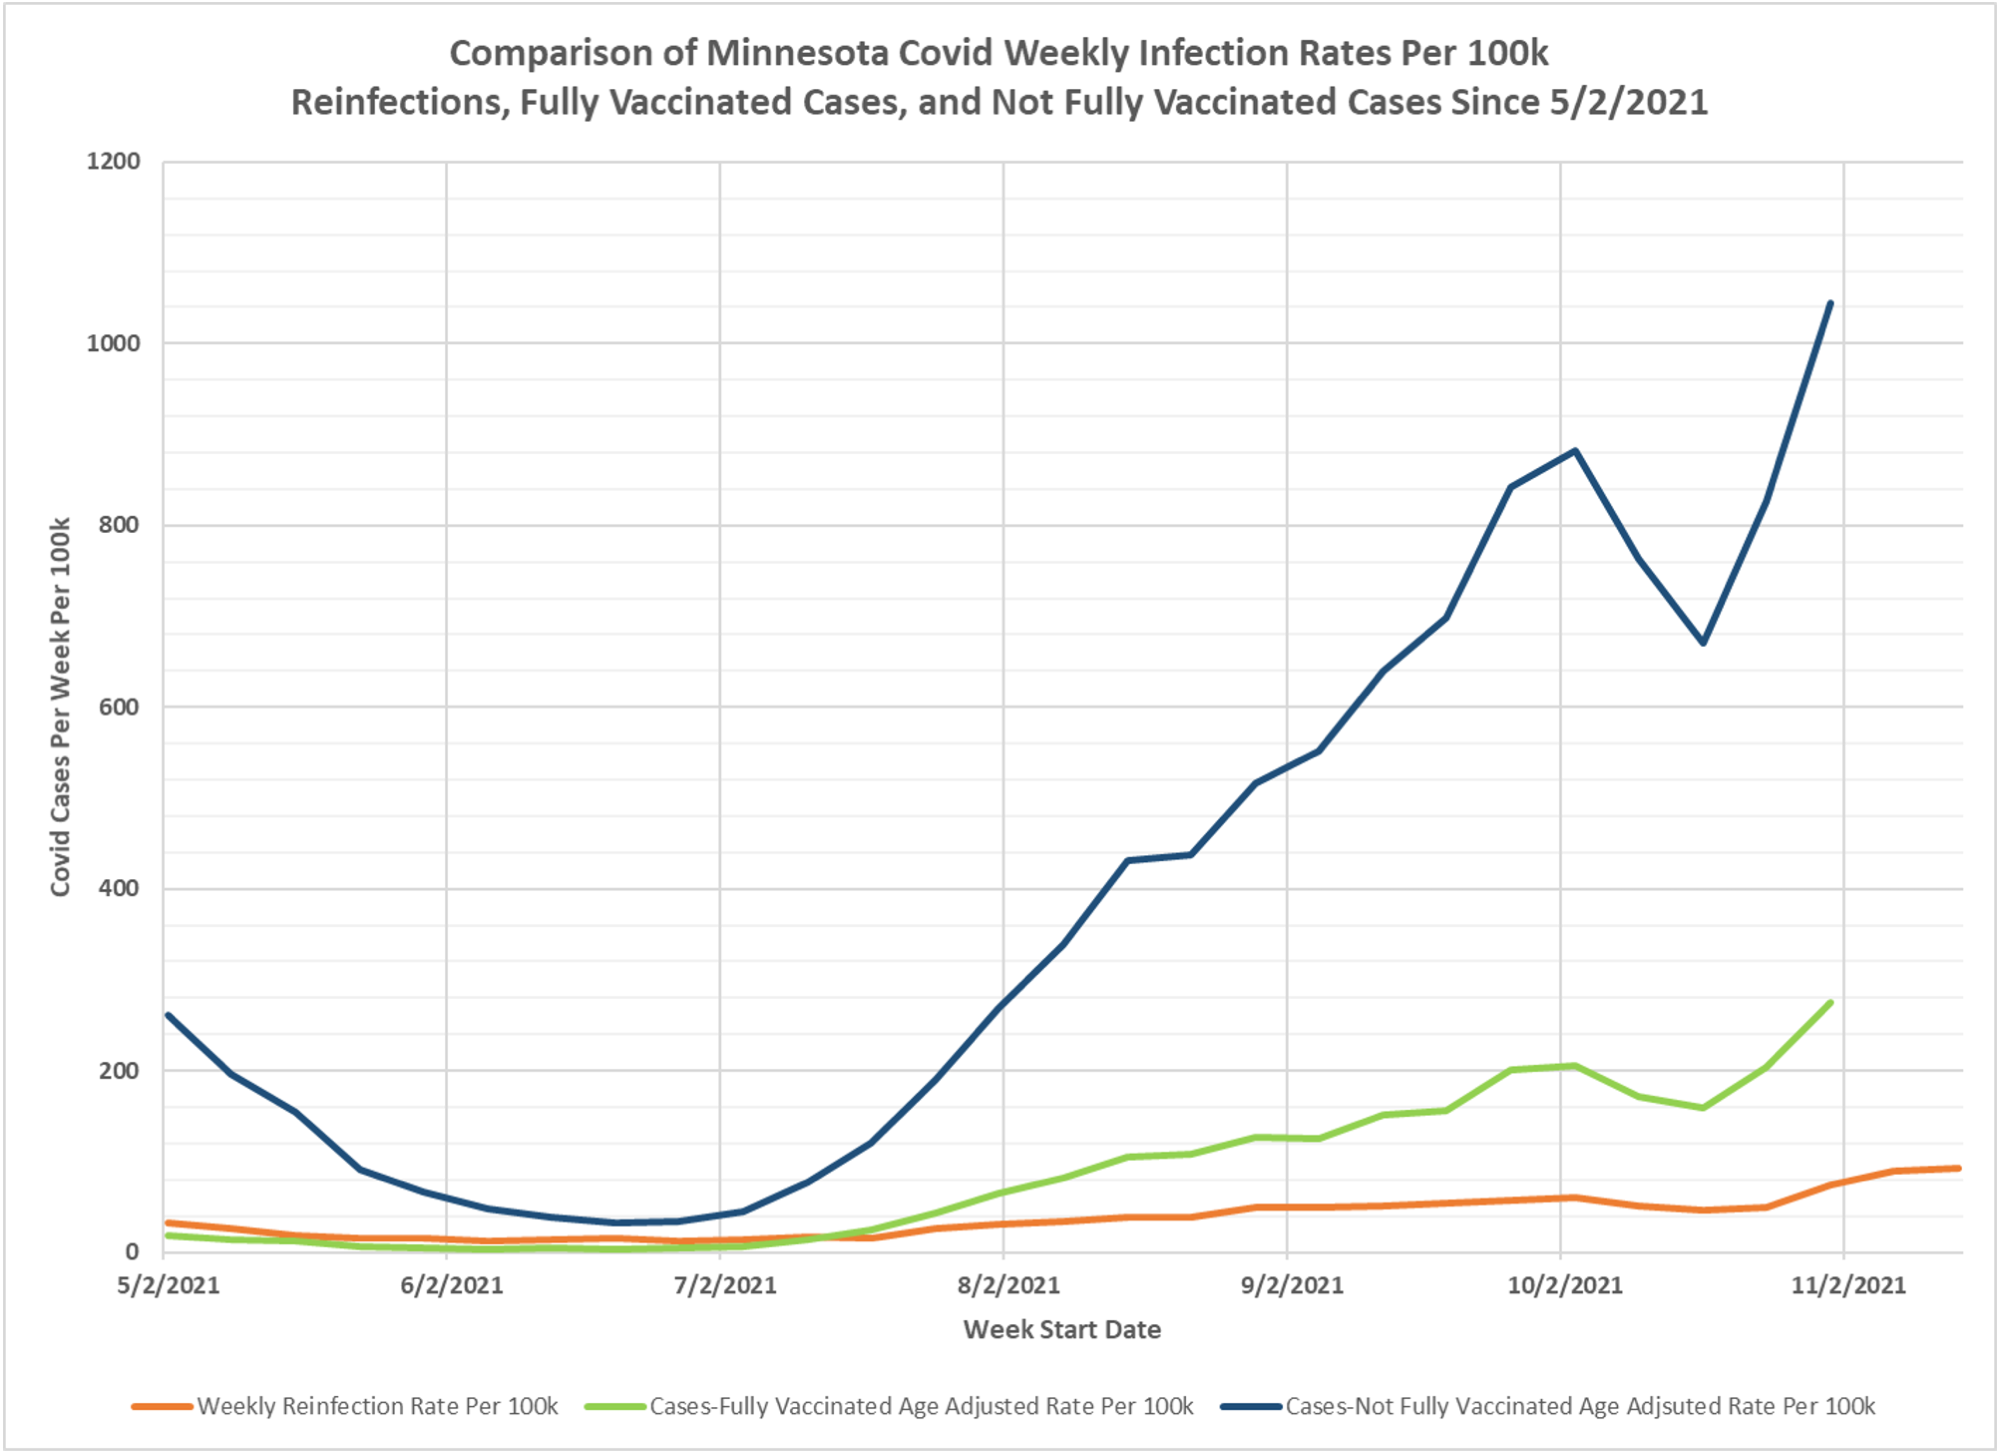
2. The weekly Covid reinfection rate displayed on the chart is calculated as the number of weekly reinfections (confirmed and probable) divided by the cumulative Total Positive Cases 90 days prior to the start of the week being considered, and the result multiplied by 100k to yield the reinfection rate per 100k per week. This is the red curve on the chart.
3. The Fully Vaccinated Age Adjusted Case Rate Per Week (green curve) and Not Fully Vaccinated Age Adjusted Case Rate Per 100k (blue curve) are taken directly without modification from the Vaccine Breakthrough Report https://www.health.state.mn.us/diseases/coronavirus/stats/vbt.html from the data file for Cases, Hospitalizations, and Deaths Over Time graphic (vbtaarates.xlsx linked on this page).
4. Data is plotted starting 5/2/2021, the earliest date we have breakthrough data. Reinfection data goes back to 6/28/2020, but the earlier data is more variable possibly due to the smaller population of previously infected people.
5. We have no knowledge of what age adjustments performs in order to calculate the Age Adjusted Rates, and we have not yet submitted a formal query to MDH for this information.
6. It is likely that there are people who may have contracted a mild enough Covid infection that they did not seek medical attention or get tested, causing an undercount of the true number of breakthrough infections, non-breakthrough infections, and reinfections.
7. We do not know how thorough and comprehensive MDH’s process is in identifying reinfections or breakthrough infections.
8. The main purpose in generating this chart is to try to compare the relative infection rates for previously infected people to vaccinated people, and then to unvaccinated people. We can see that throughout the Summer of 2021 the three rates were all low, during the time period in Minnesota when Covid cases were very low in general. However, unvaccinated infection rates were always the highest of the three, and for several months the reinfection rate was higher than the vaccinated breakthrough rate. On 10/31/2021, the most recent date where we can be considered to have complete breakthrough case data, the reinfection rate was 73.5 per 100k, the vaccinated infection rate was 275.1 per 100k, and the unvaccinated infection rate was 1044.7 per 100k. The ratios between these rates are an indicator of the relative risk of infection for the different classifications of the population. It might be concluded from these rates that natural immunity provides better immunity than vaccination, but the uncertainties and possible incompleteness of the underlying data is a cause for concern. Similarly, the lower infection rate of vaccinated people compared to unvaccinated people is a measure of the relative protection provided by vaccination, again with some uncertainties about the underlying data.
9. As of 12/06/2021 a total of 1,211,323 Minnesotans had received a booster vaccination shot. It is not known how many of these people with booster shots have tested positive if any.