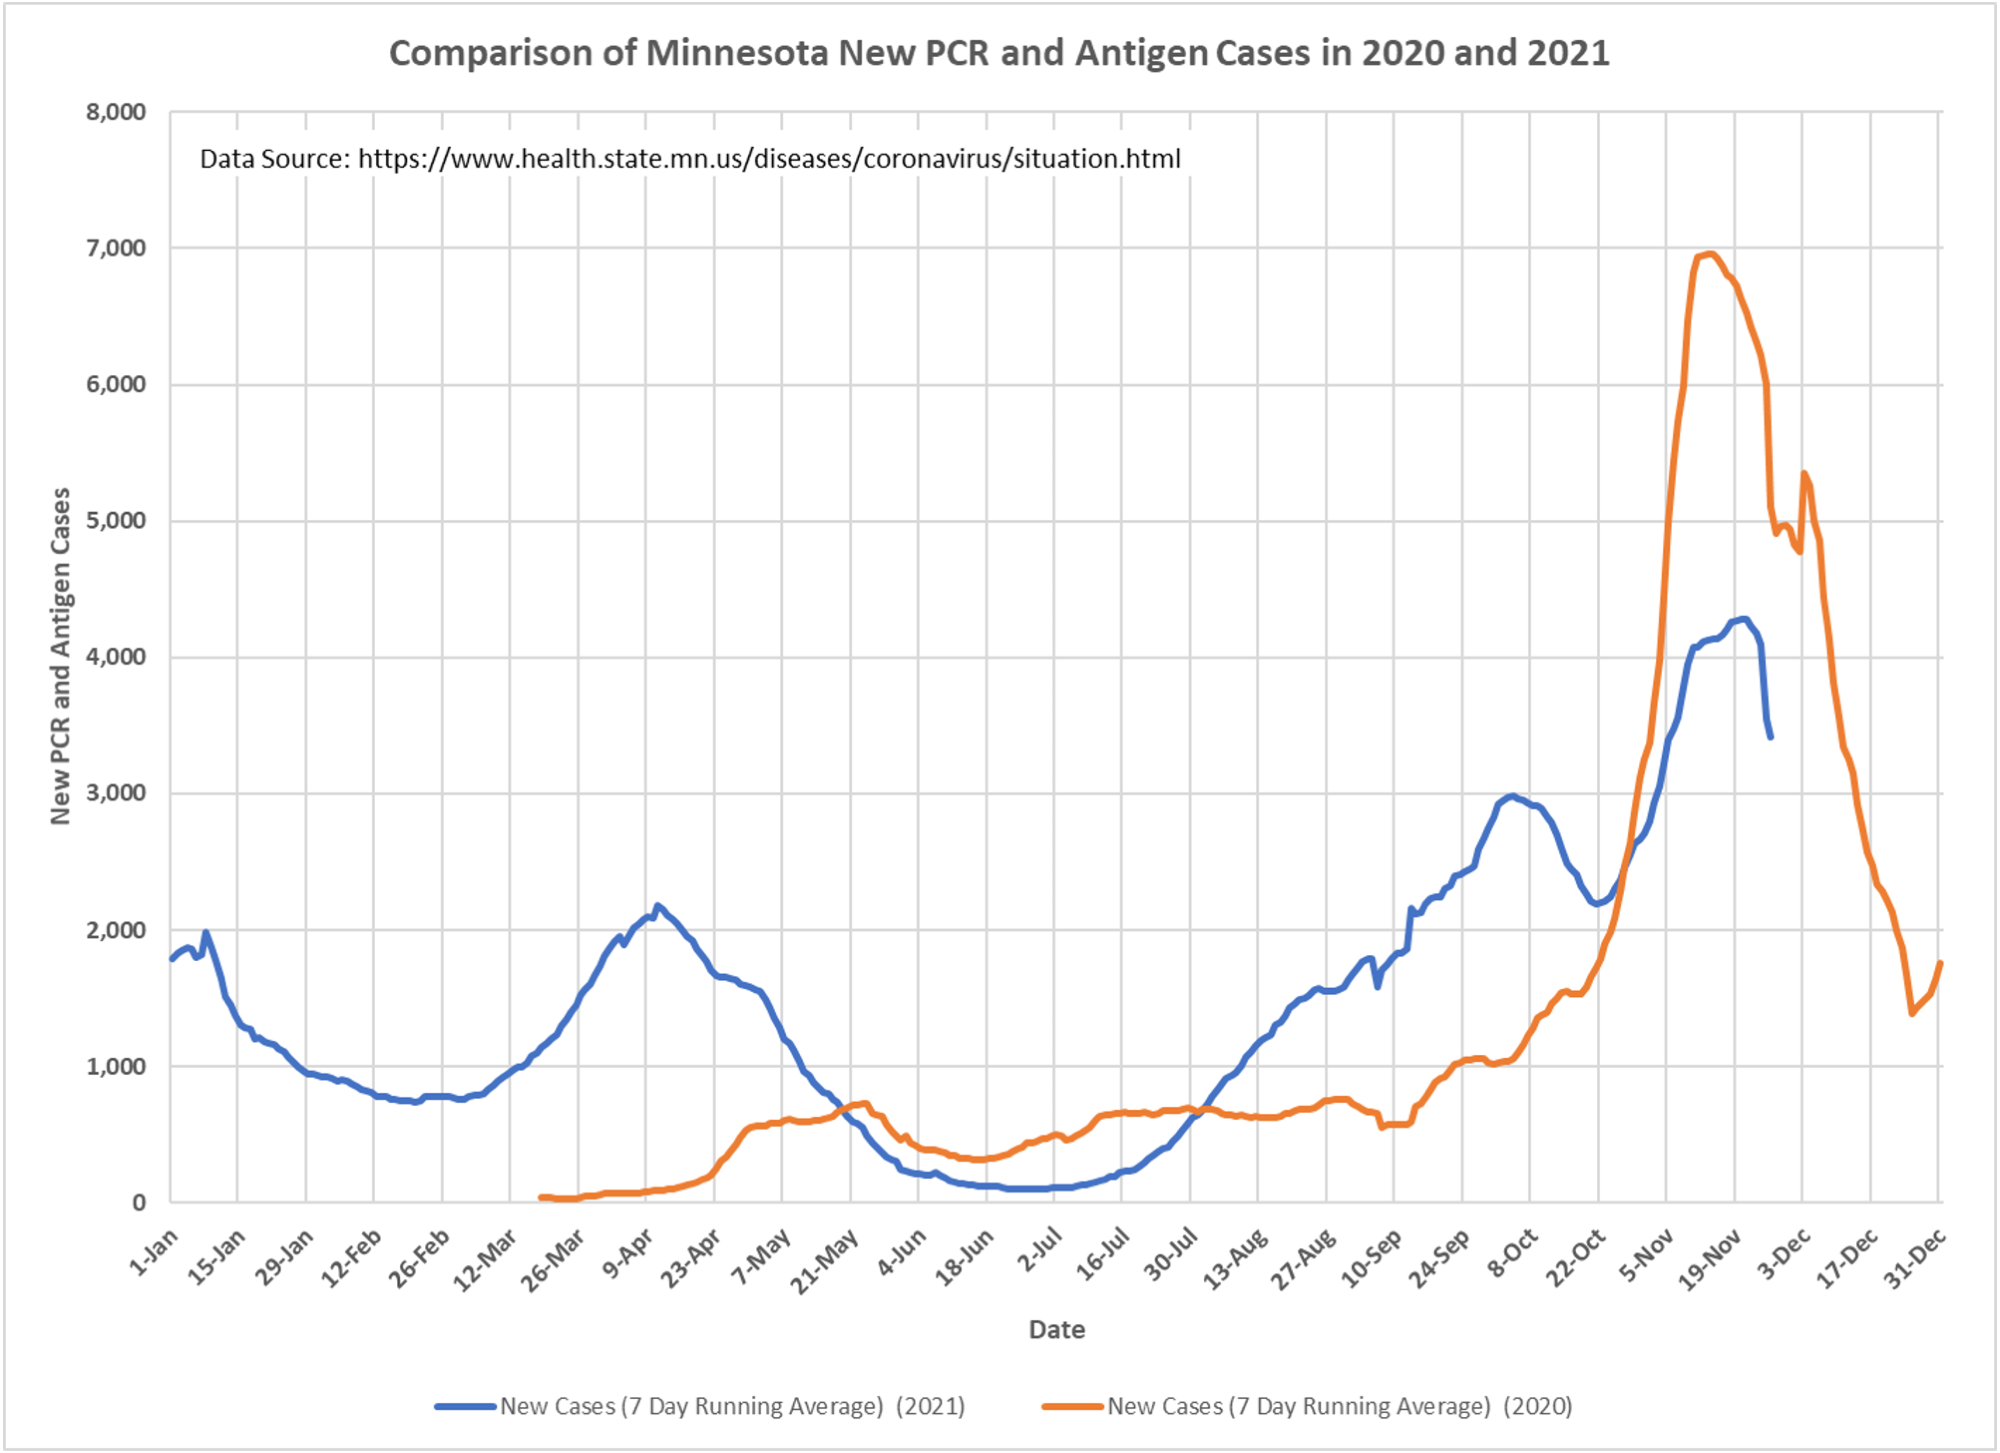
Uhhh, anyone look at these charts and not think CV-19 is a seasonal virus? Vaccines and prior infection have muted the curves, otherwise we would probably look almost identical. And the good news is that if the pattern holds, we should be heading down rapidly, at least in regard to cases. Thanks to Dave Dixon, whose comments are below:
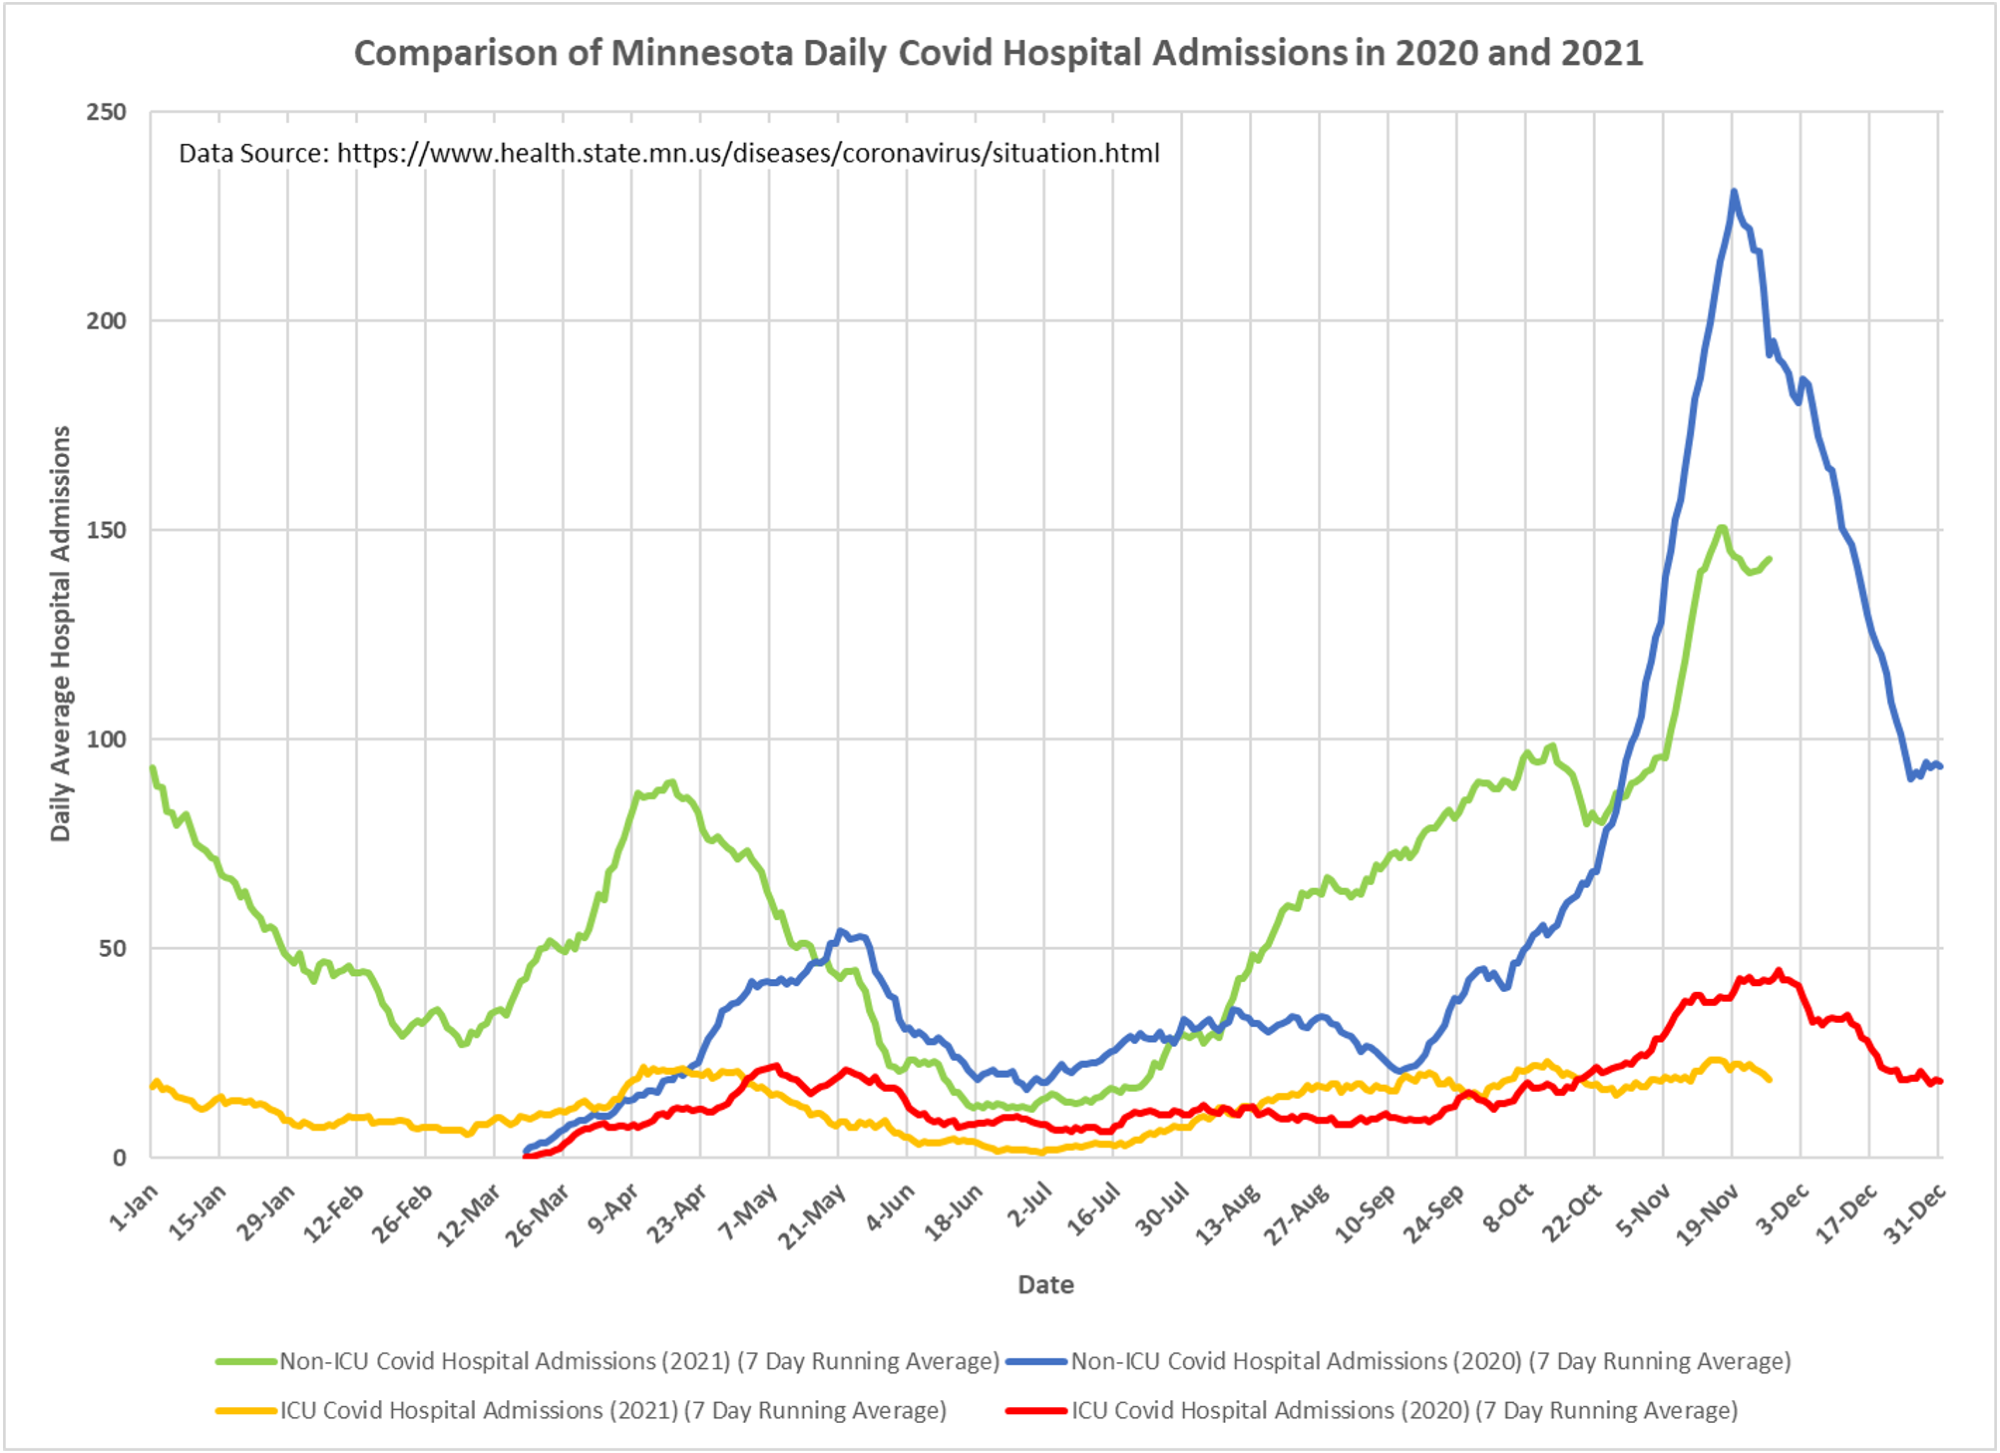
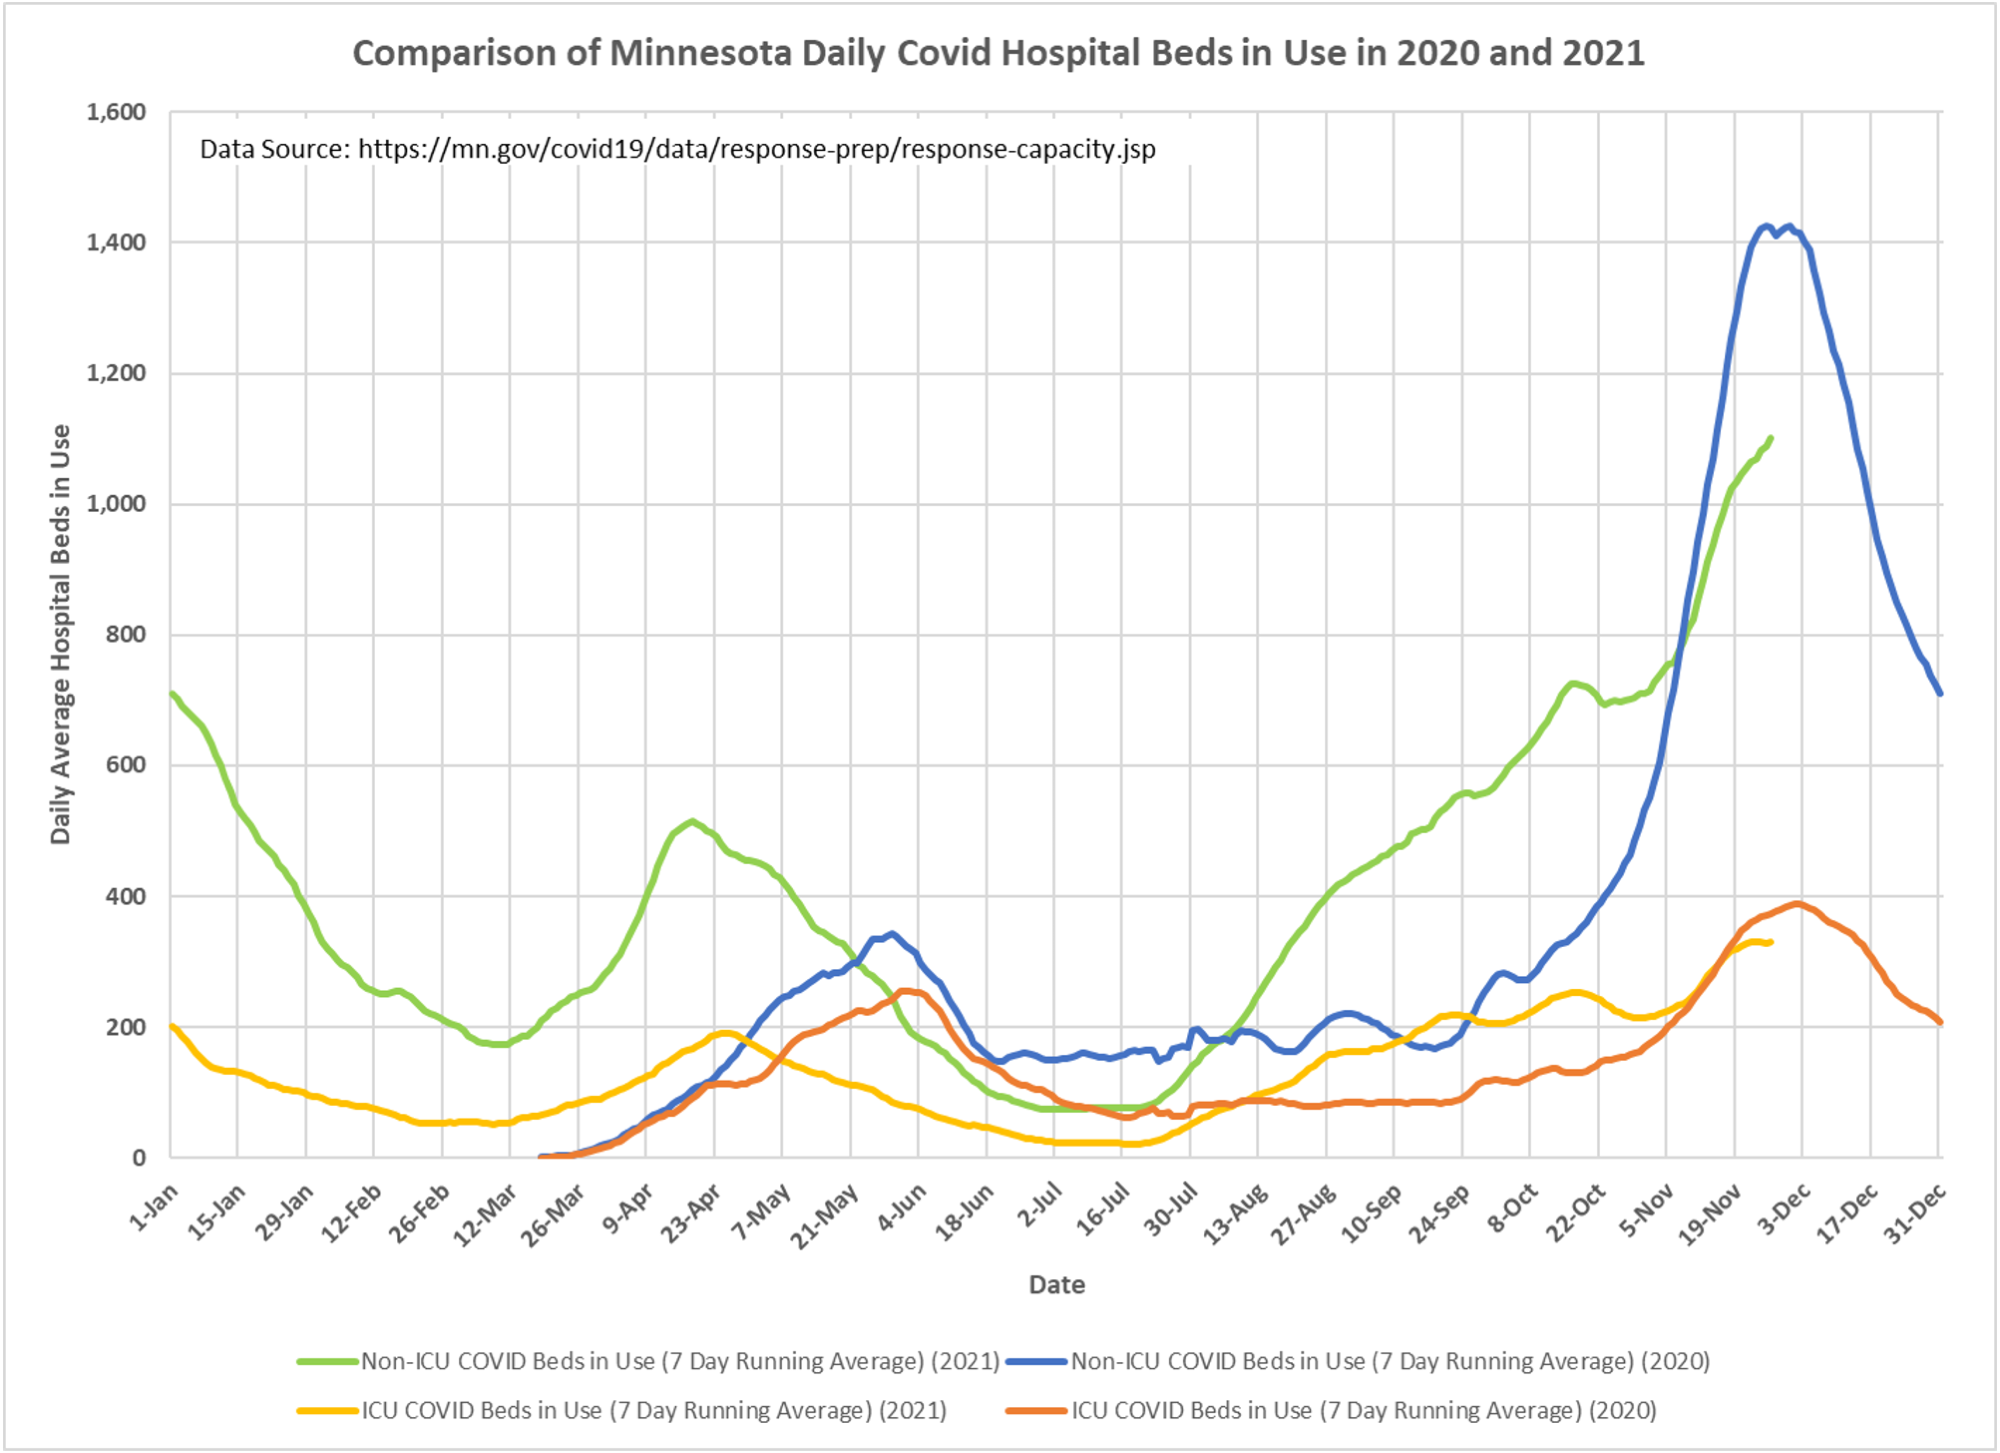
1. New cases have appear to have peaked on 11/20/2021, compared to the peak last winter on 11/13/2020. Similarly, daily hospital admissions also appear to have peaked, although the rate of decrease is not as dramatic as last year’s reduction, especially for non-ICU admissions. While ICU beds in use appears to have plateaued, non-ICU beds in use is still rising.
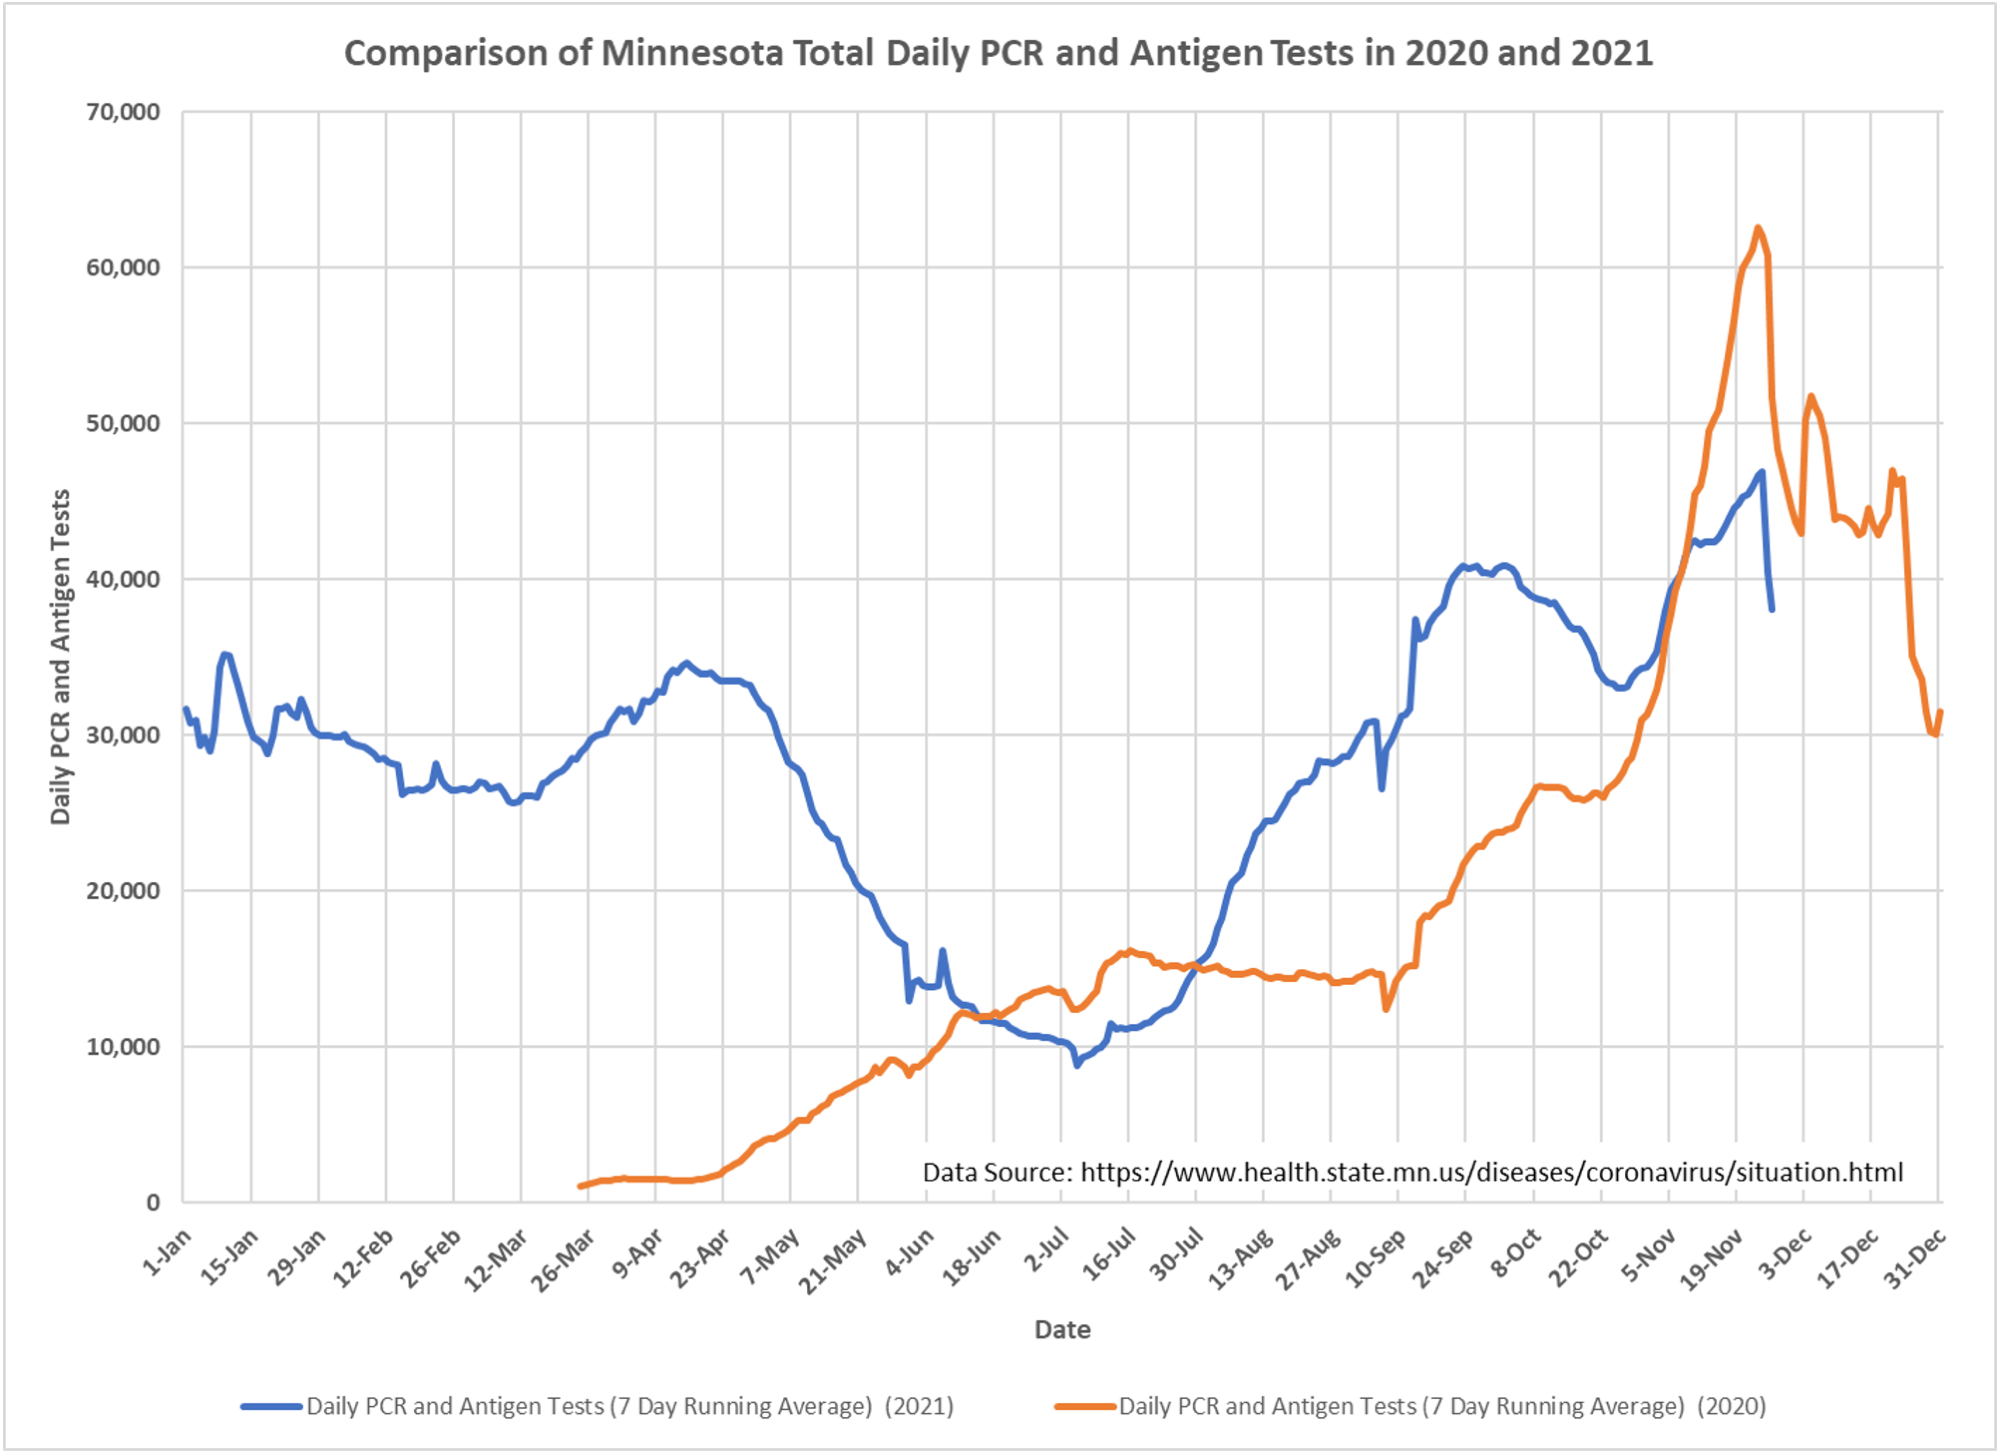
2. Since the last time these charts were updated DOH has updated the reporting on testing. They now report tests by the date a specimen was collected, rather than when the test result was reported to DOH. This change in reporting has caused minor changes to the profile of the testing curve.
3. All data for testing, cases, hospital admissions, and deaths are taken from the data table on the Minnesota Situation Update page: https://www.health.state.mn.us/diseases/coronavirus/situation.html The only modification to the data is to calculate 7 day running averages in order to make the trends easier to see.
4. The underlying data for hospital beds in use is taken from the Teletracking data file found on the Response and Preparation web page: https://mn.gov/covid19/data/response-prep/response-capacity.jsp The Teletracking data file is also cited as the data source for the graphic on this same page. 7 day running averages are calculated for beds in use as well.
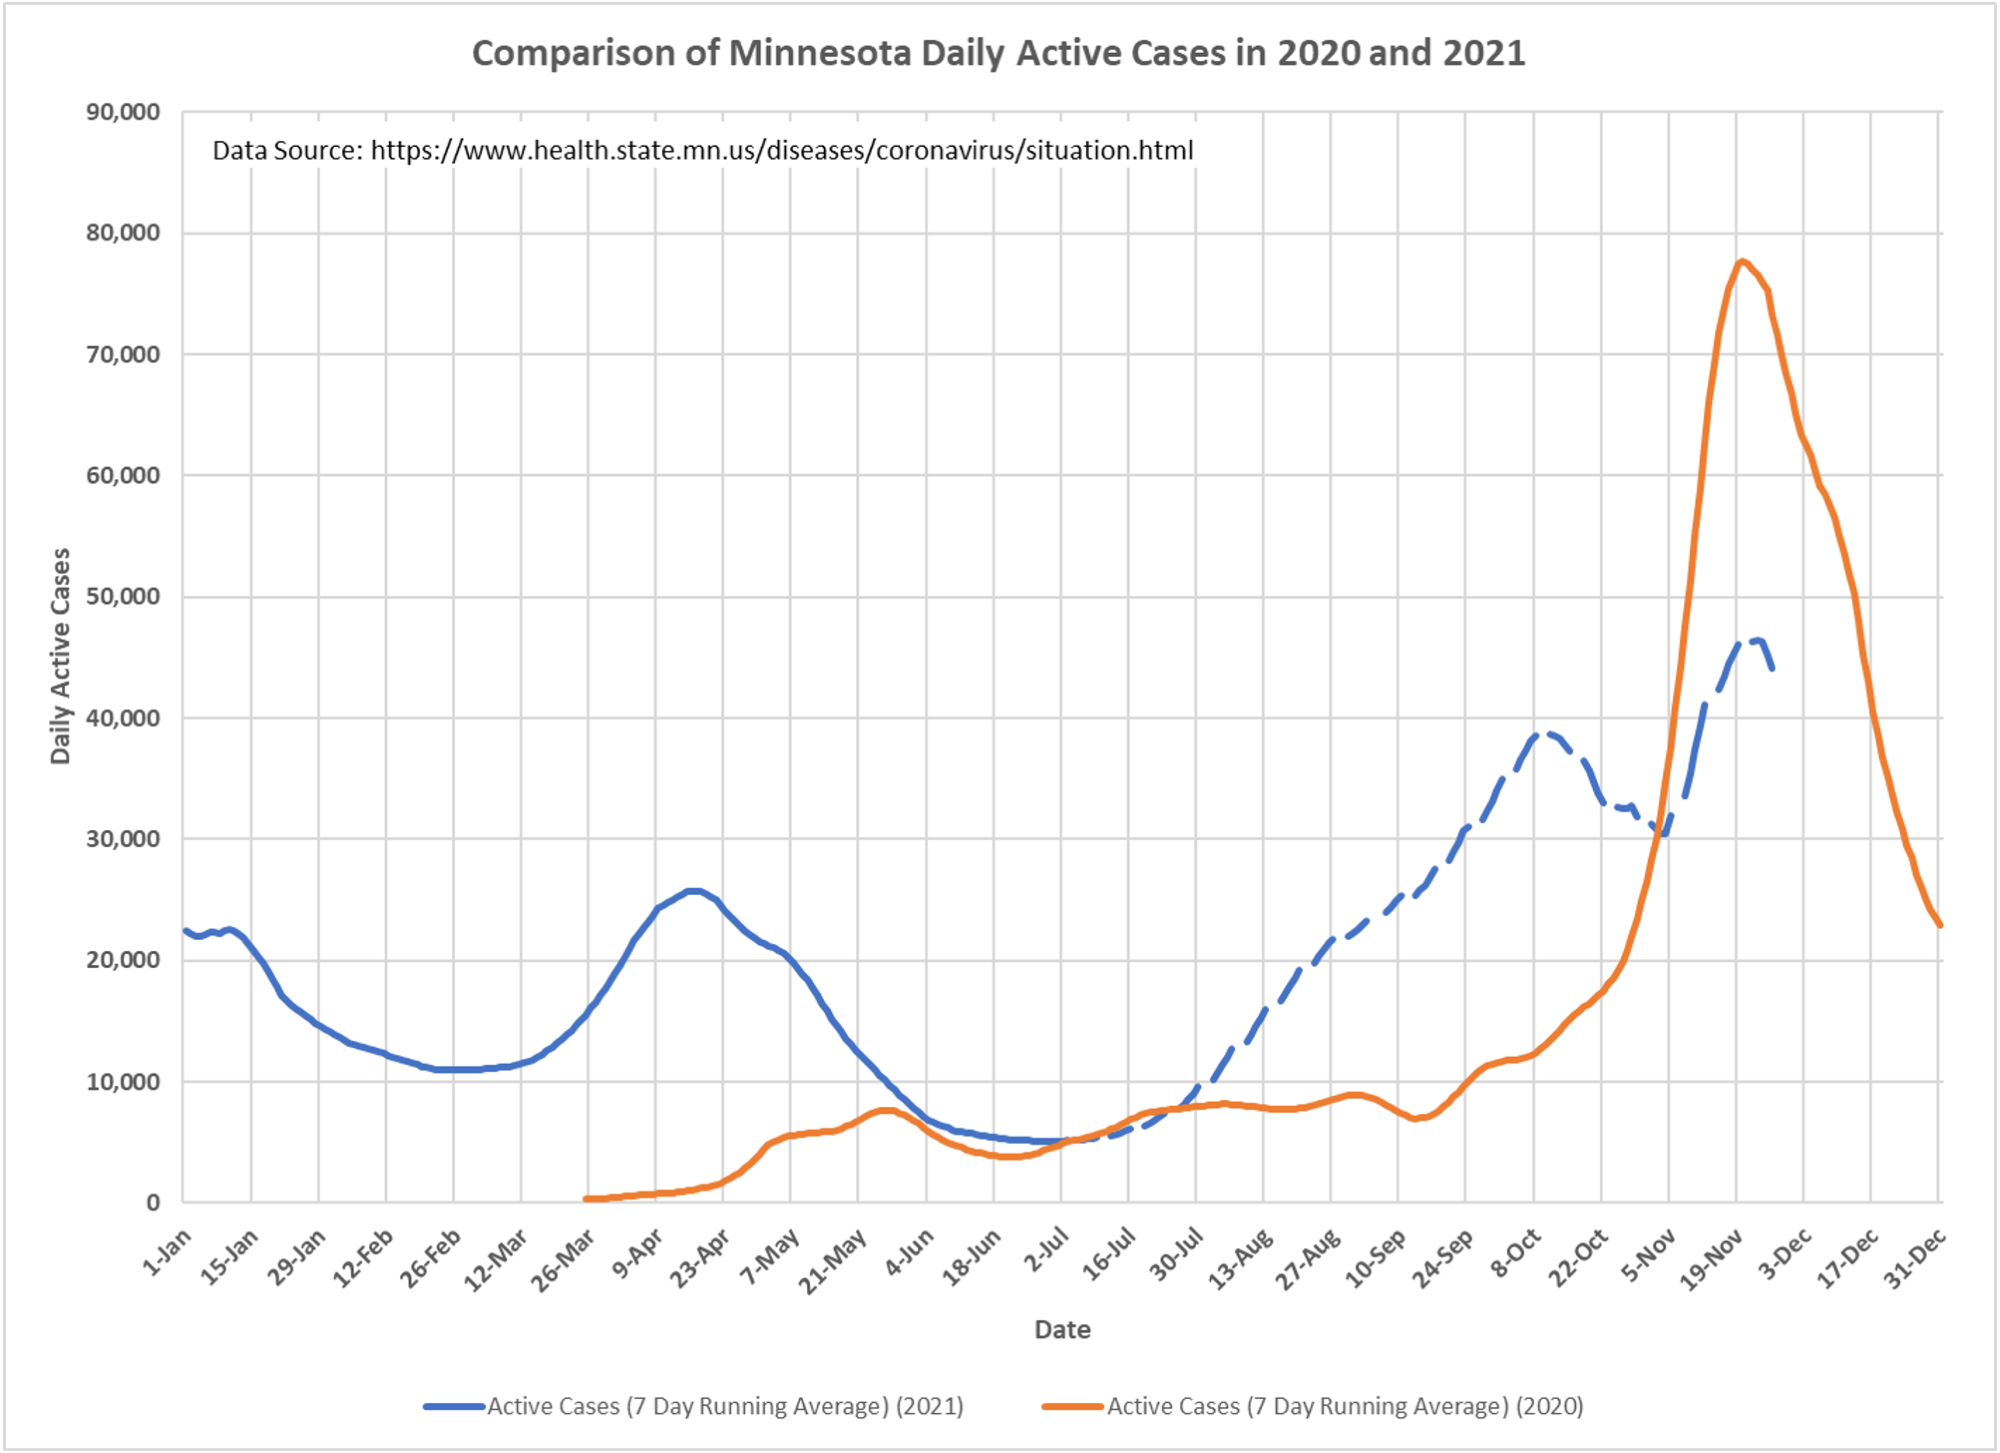
5. Active cases are calculated as the cumulative PCR and antigen positive cases minus cumulative deaths minus the people No Longer Needing Isolation. The No Longer Needing Isolation total is found on the Situation Update page. In recent days MDH has started publishing the Total Positive People (Cumulative) statistic. It is on our to-do list to figure out the impact of this reporting change on Active Cases.
6. For all charts the most recent 7 days of data is excluded, in order to avoid charting incomplete data.
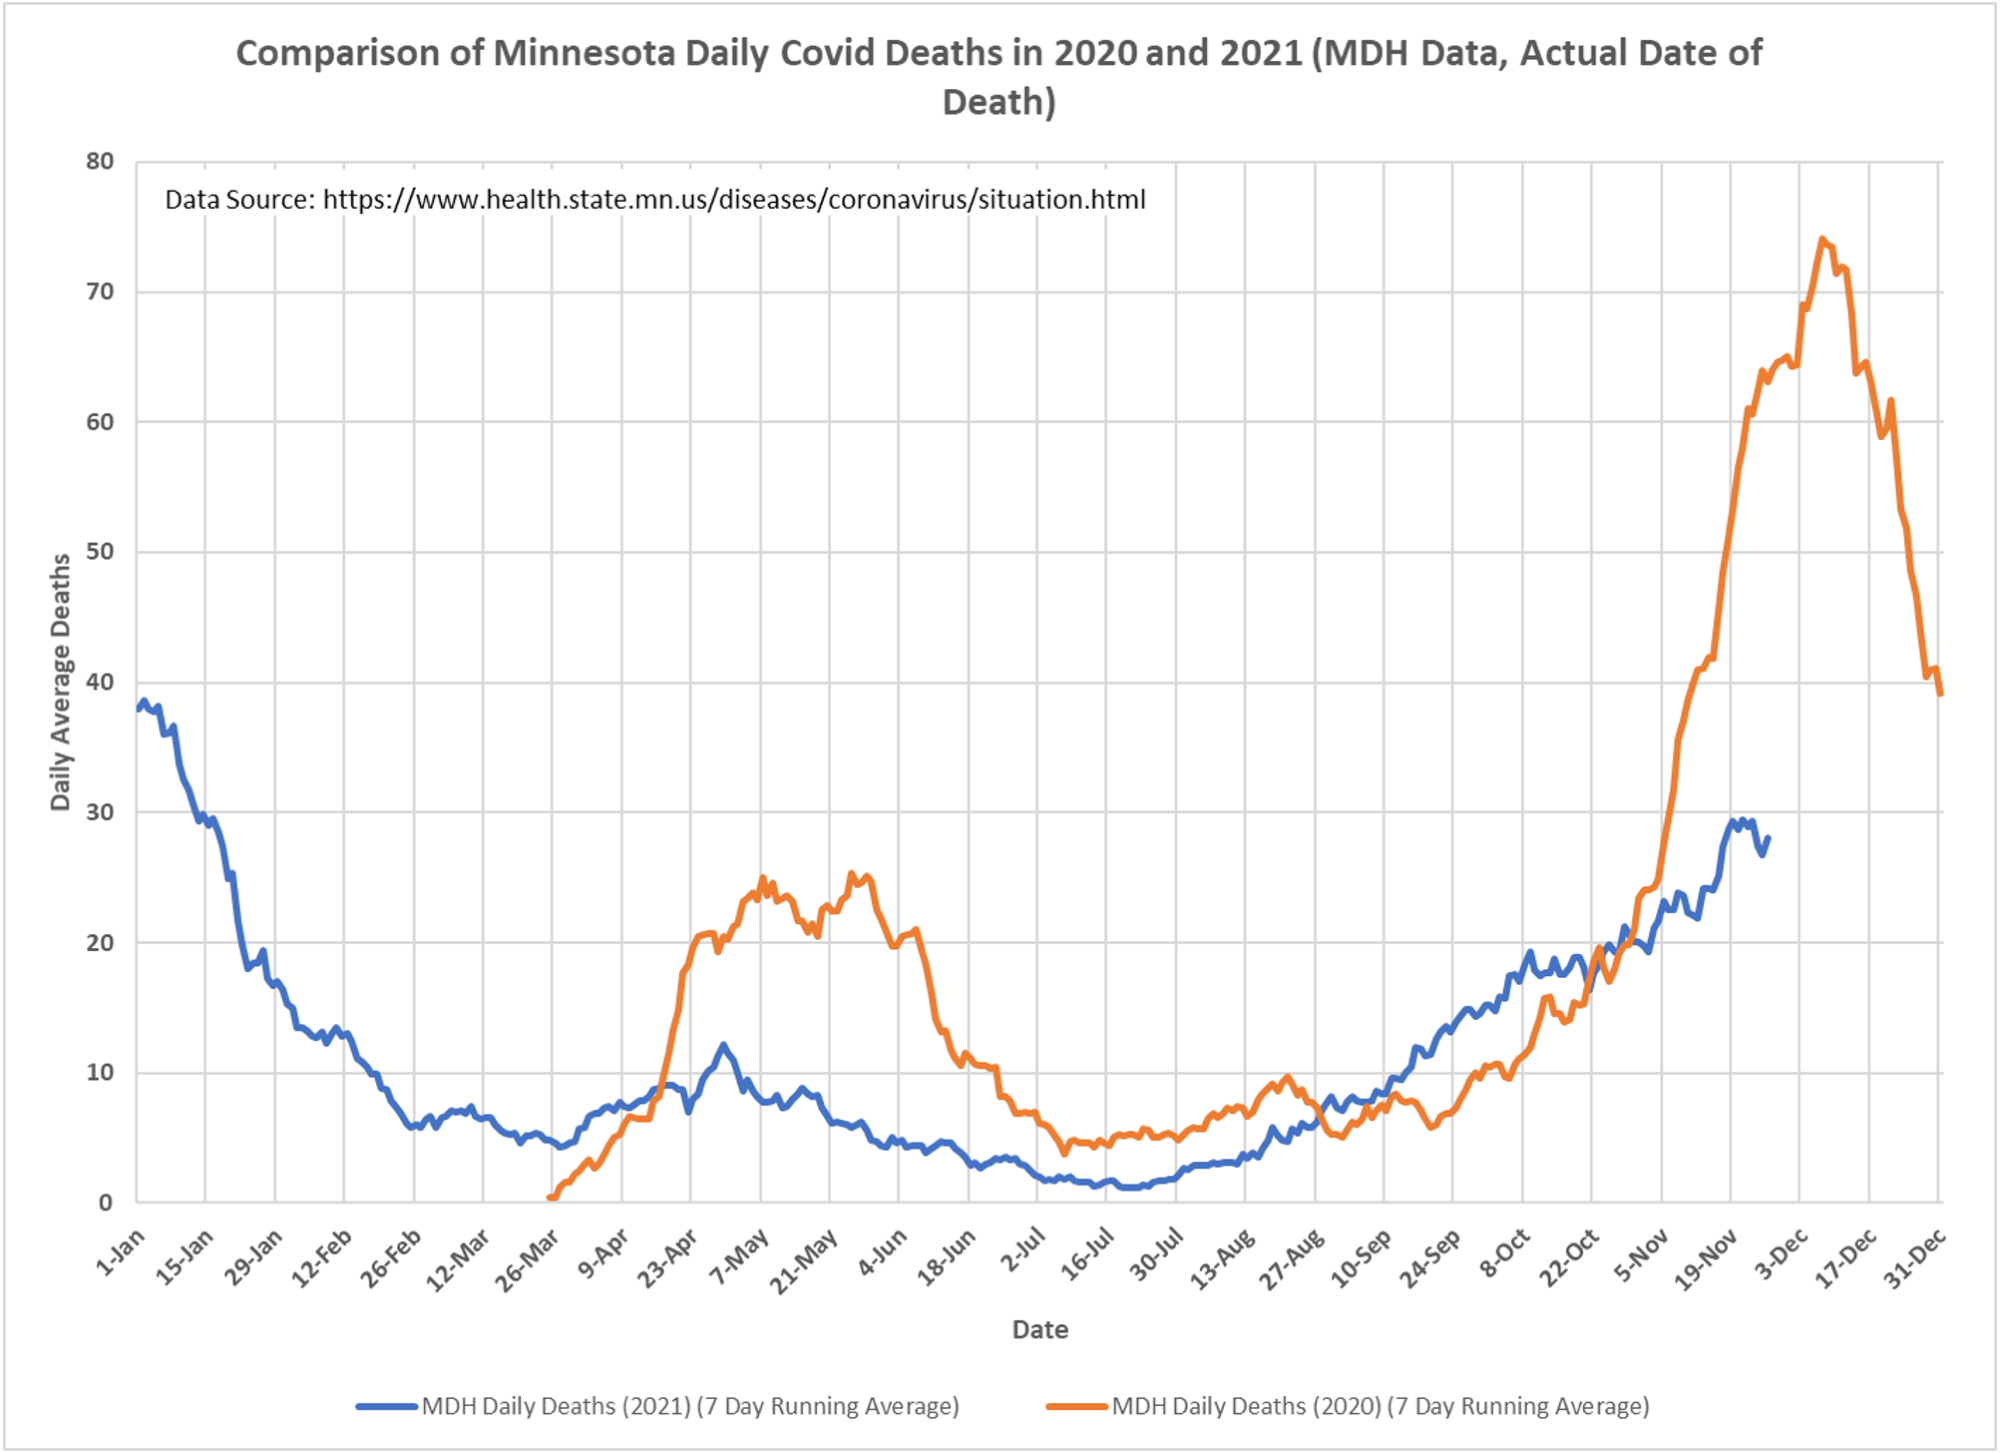

Are the 2021 deaths, still being considered a covid death based on the same criteria of the 2020 deaths? Death with covid or deaths from covid.
yes, I believe they are, and a good chart review is in order to determine what deaths really are due to CV-19