You get two of these this week, because of the holiday last week. Not really much to say. The same old trends, and do note that deaths remain concentrated in the very, very heavily vaxed old groups, which is why over half of all recent deaths have been in the fully vaxed. Because of the holiday, testing was way down so cases were way down. I would not read much into that yet.
In some materials I got from my data requests to DOH, they complained that using this data this way isn’t right because it is date of report, which I of course find hilarious because they won’t give it to us by date of event, even though they have tables of everything by date of event. So stop using date of event on the daily situation report tables and date of report on the weekly report tables. Dave’s notes:
1. As always, there are 2 slides for each set of data, one showing data for the whole pandemic and a second chart showing only data since early July, 2021. It has only been 3 days since the last Weekly Report was published, due to the Thanksgiving holiday.
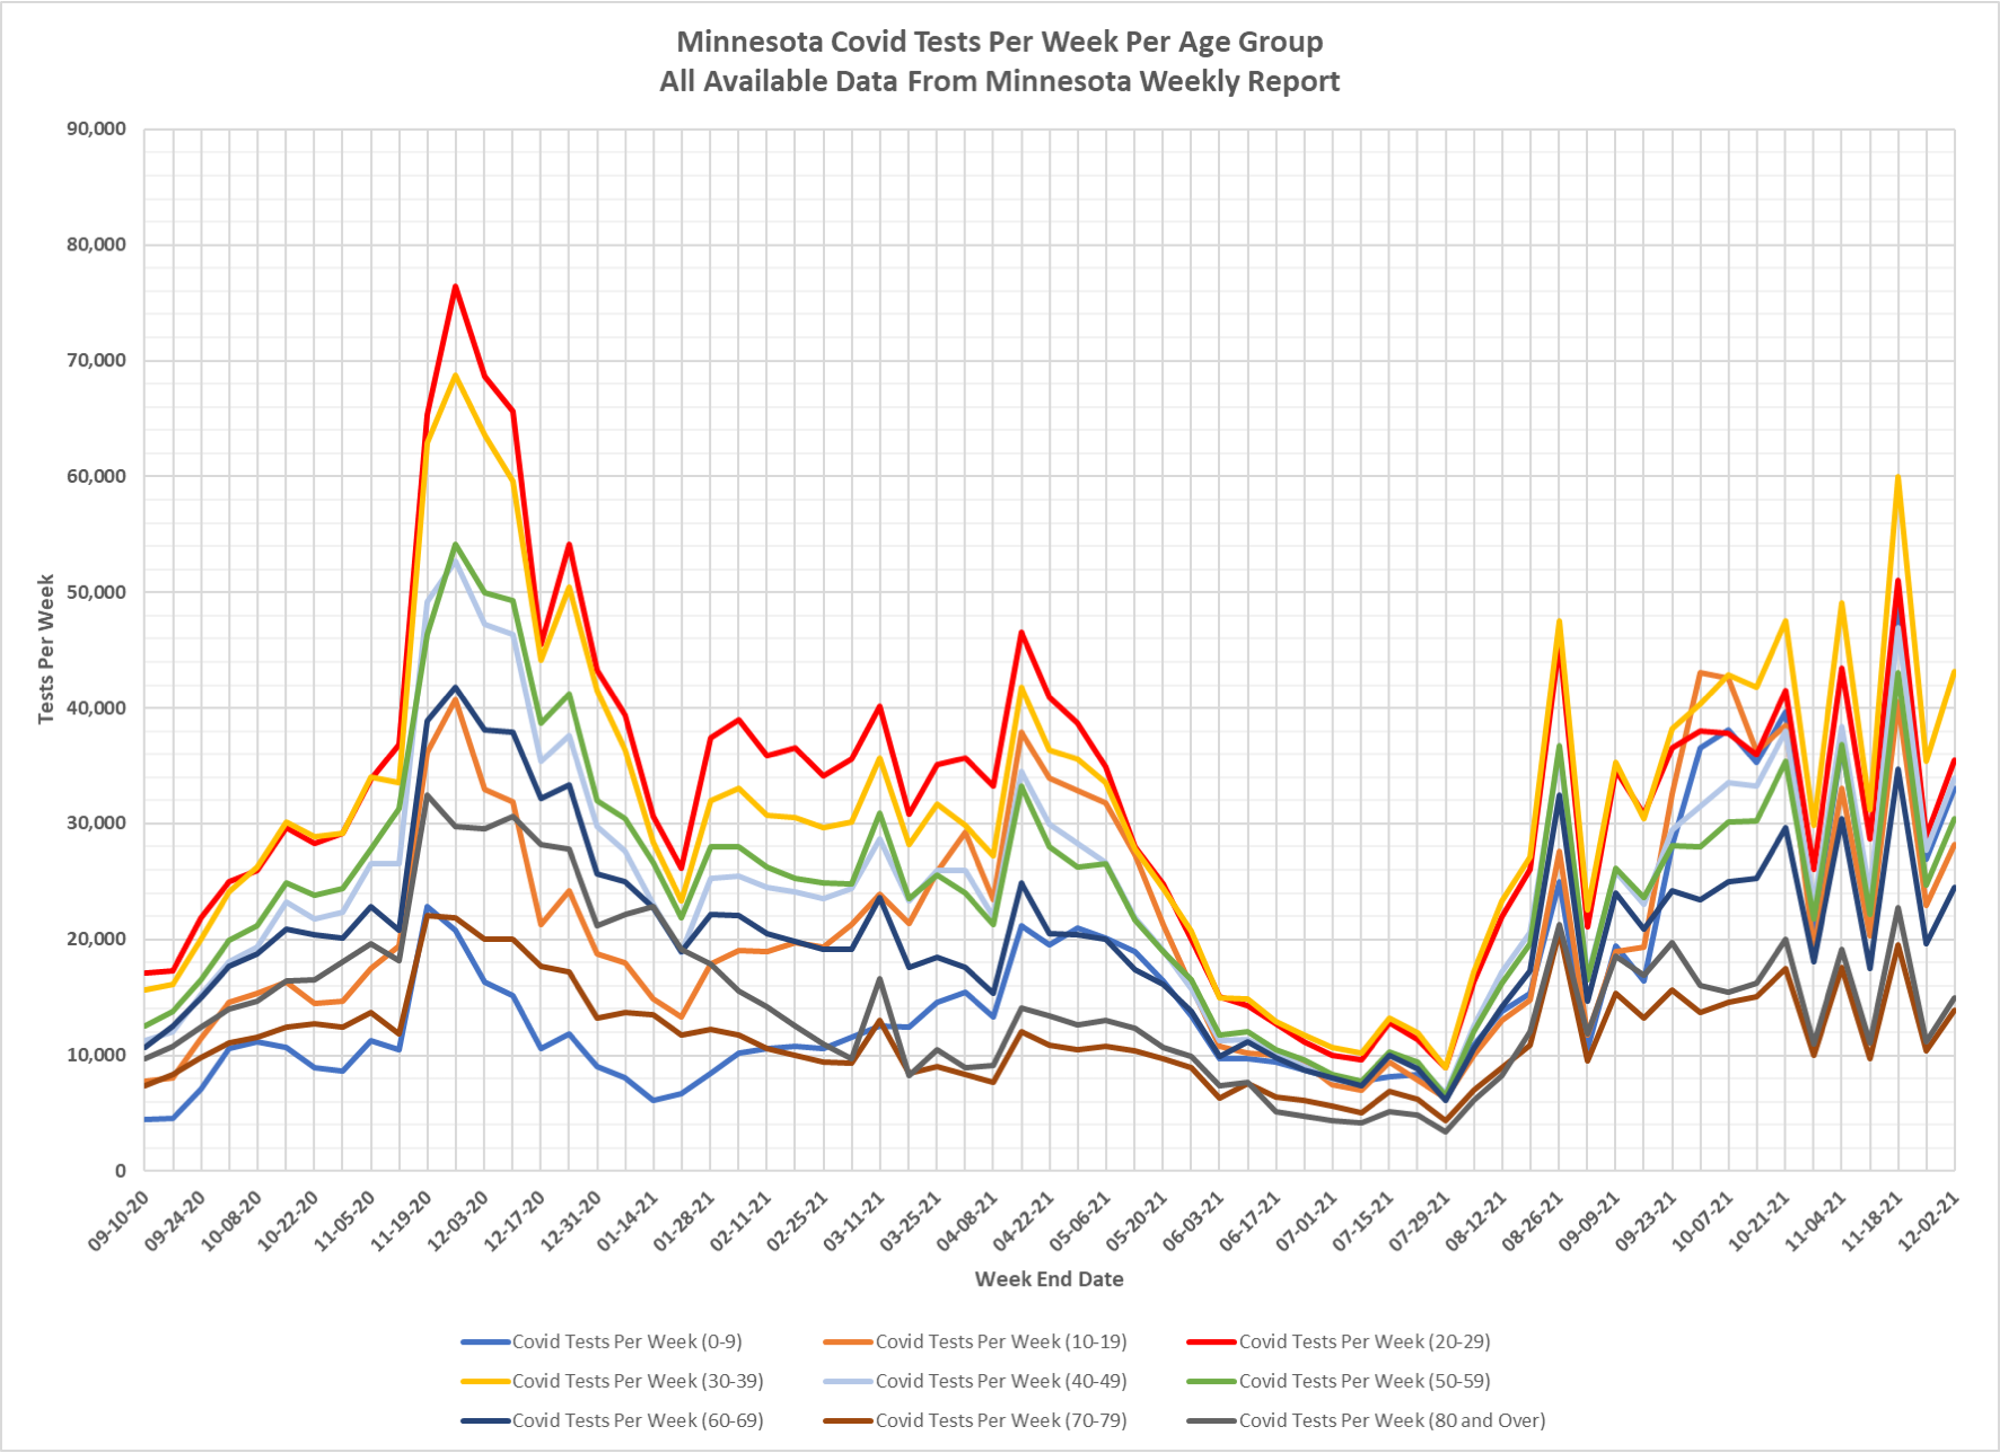
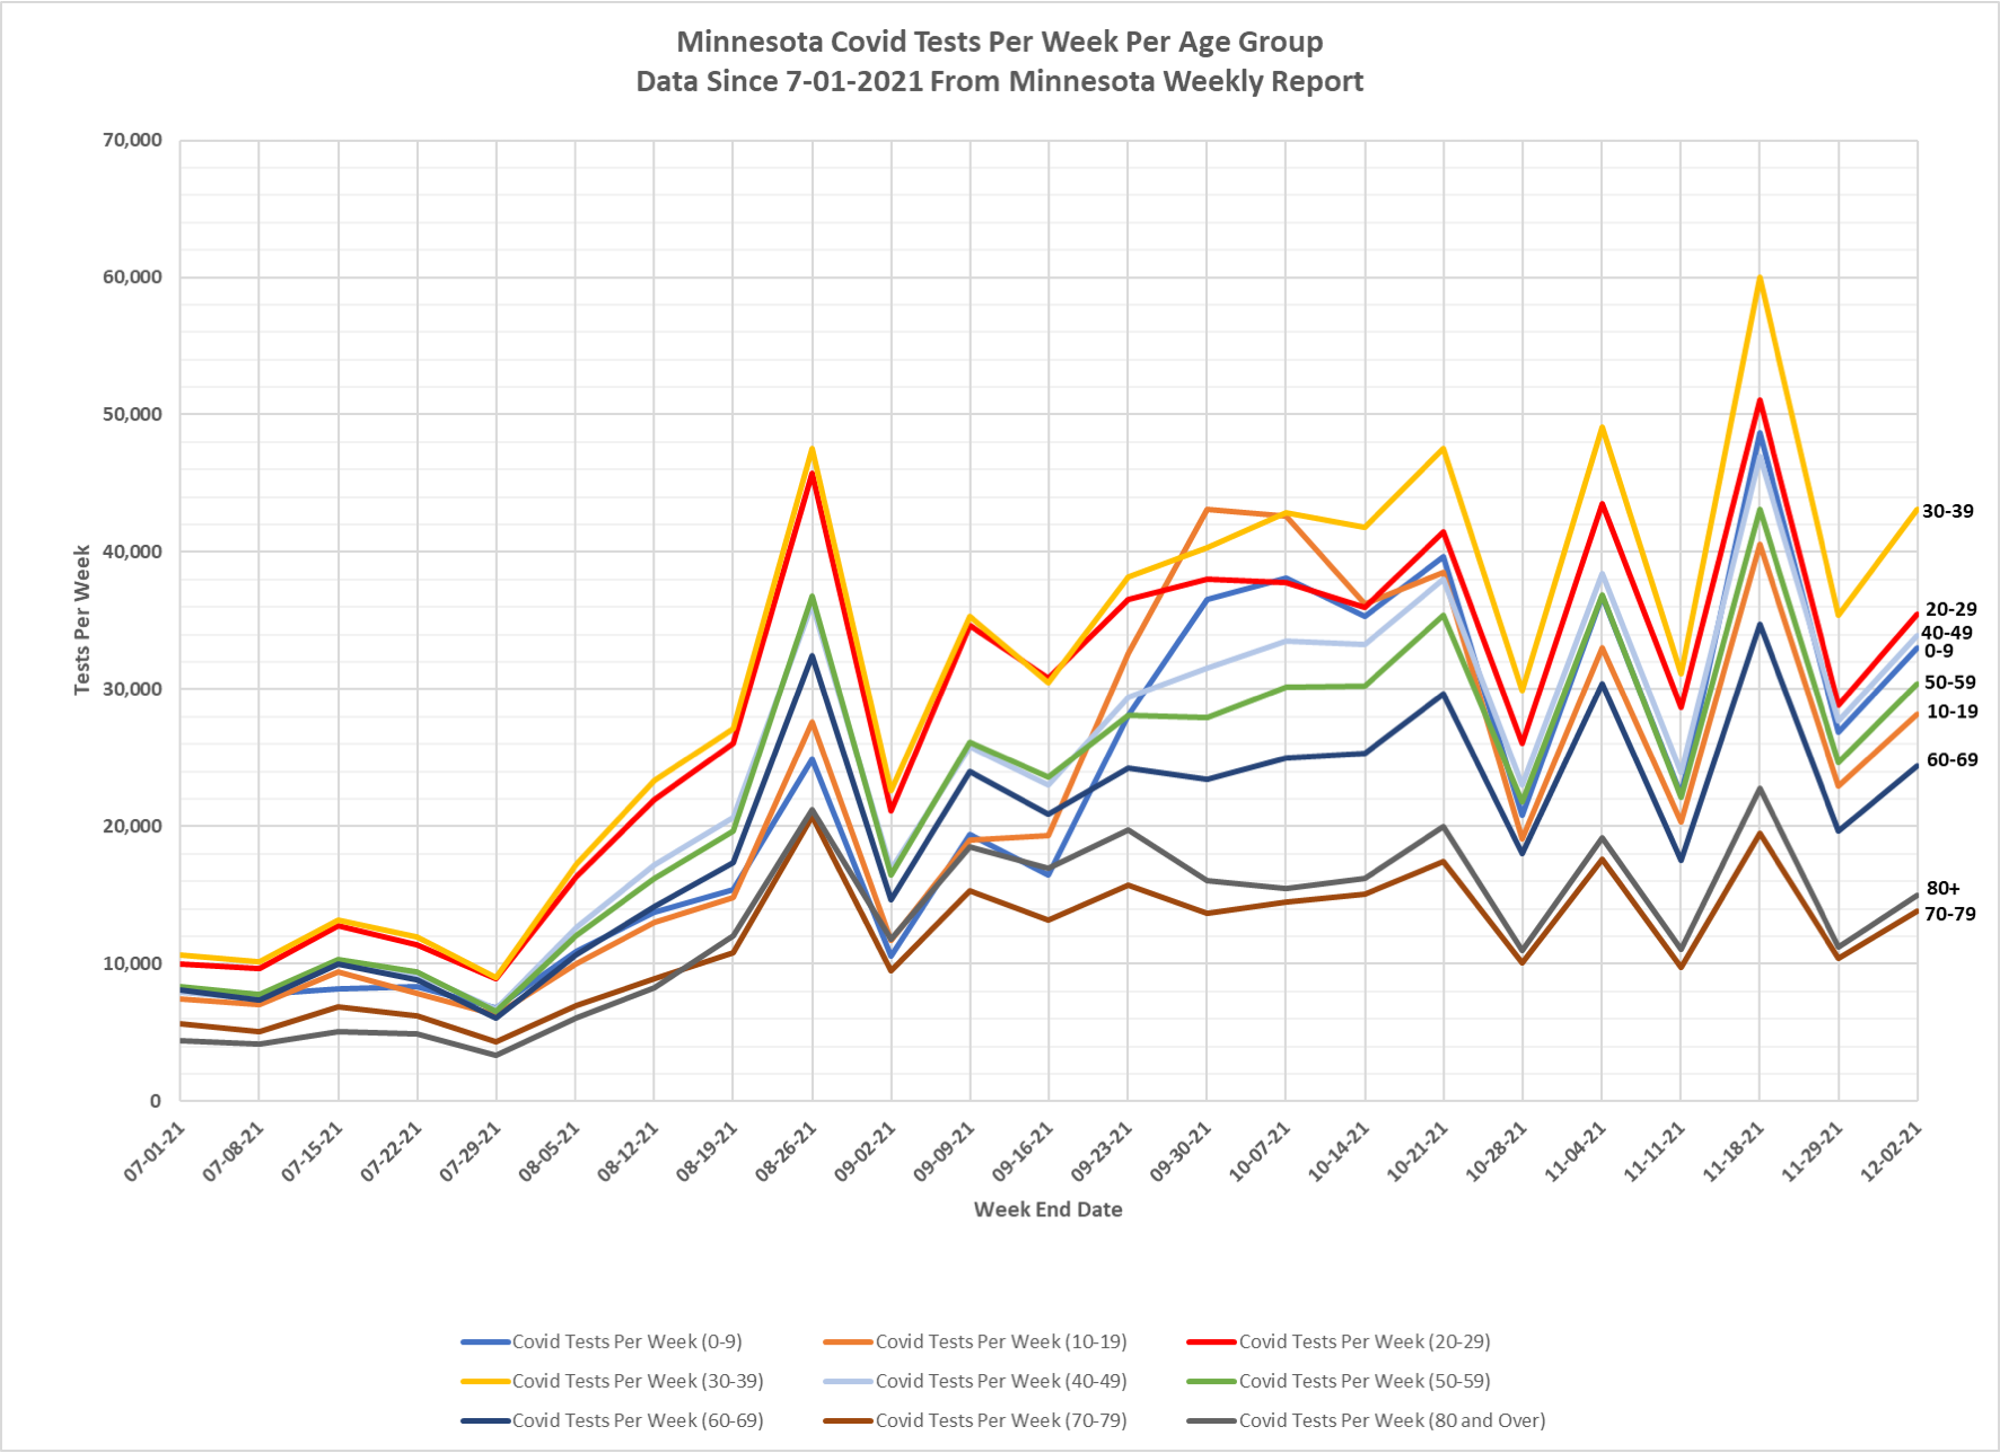
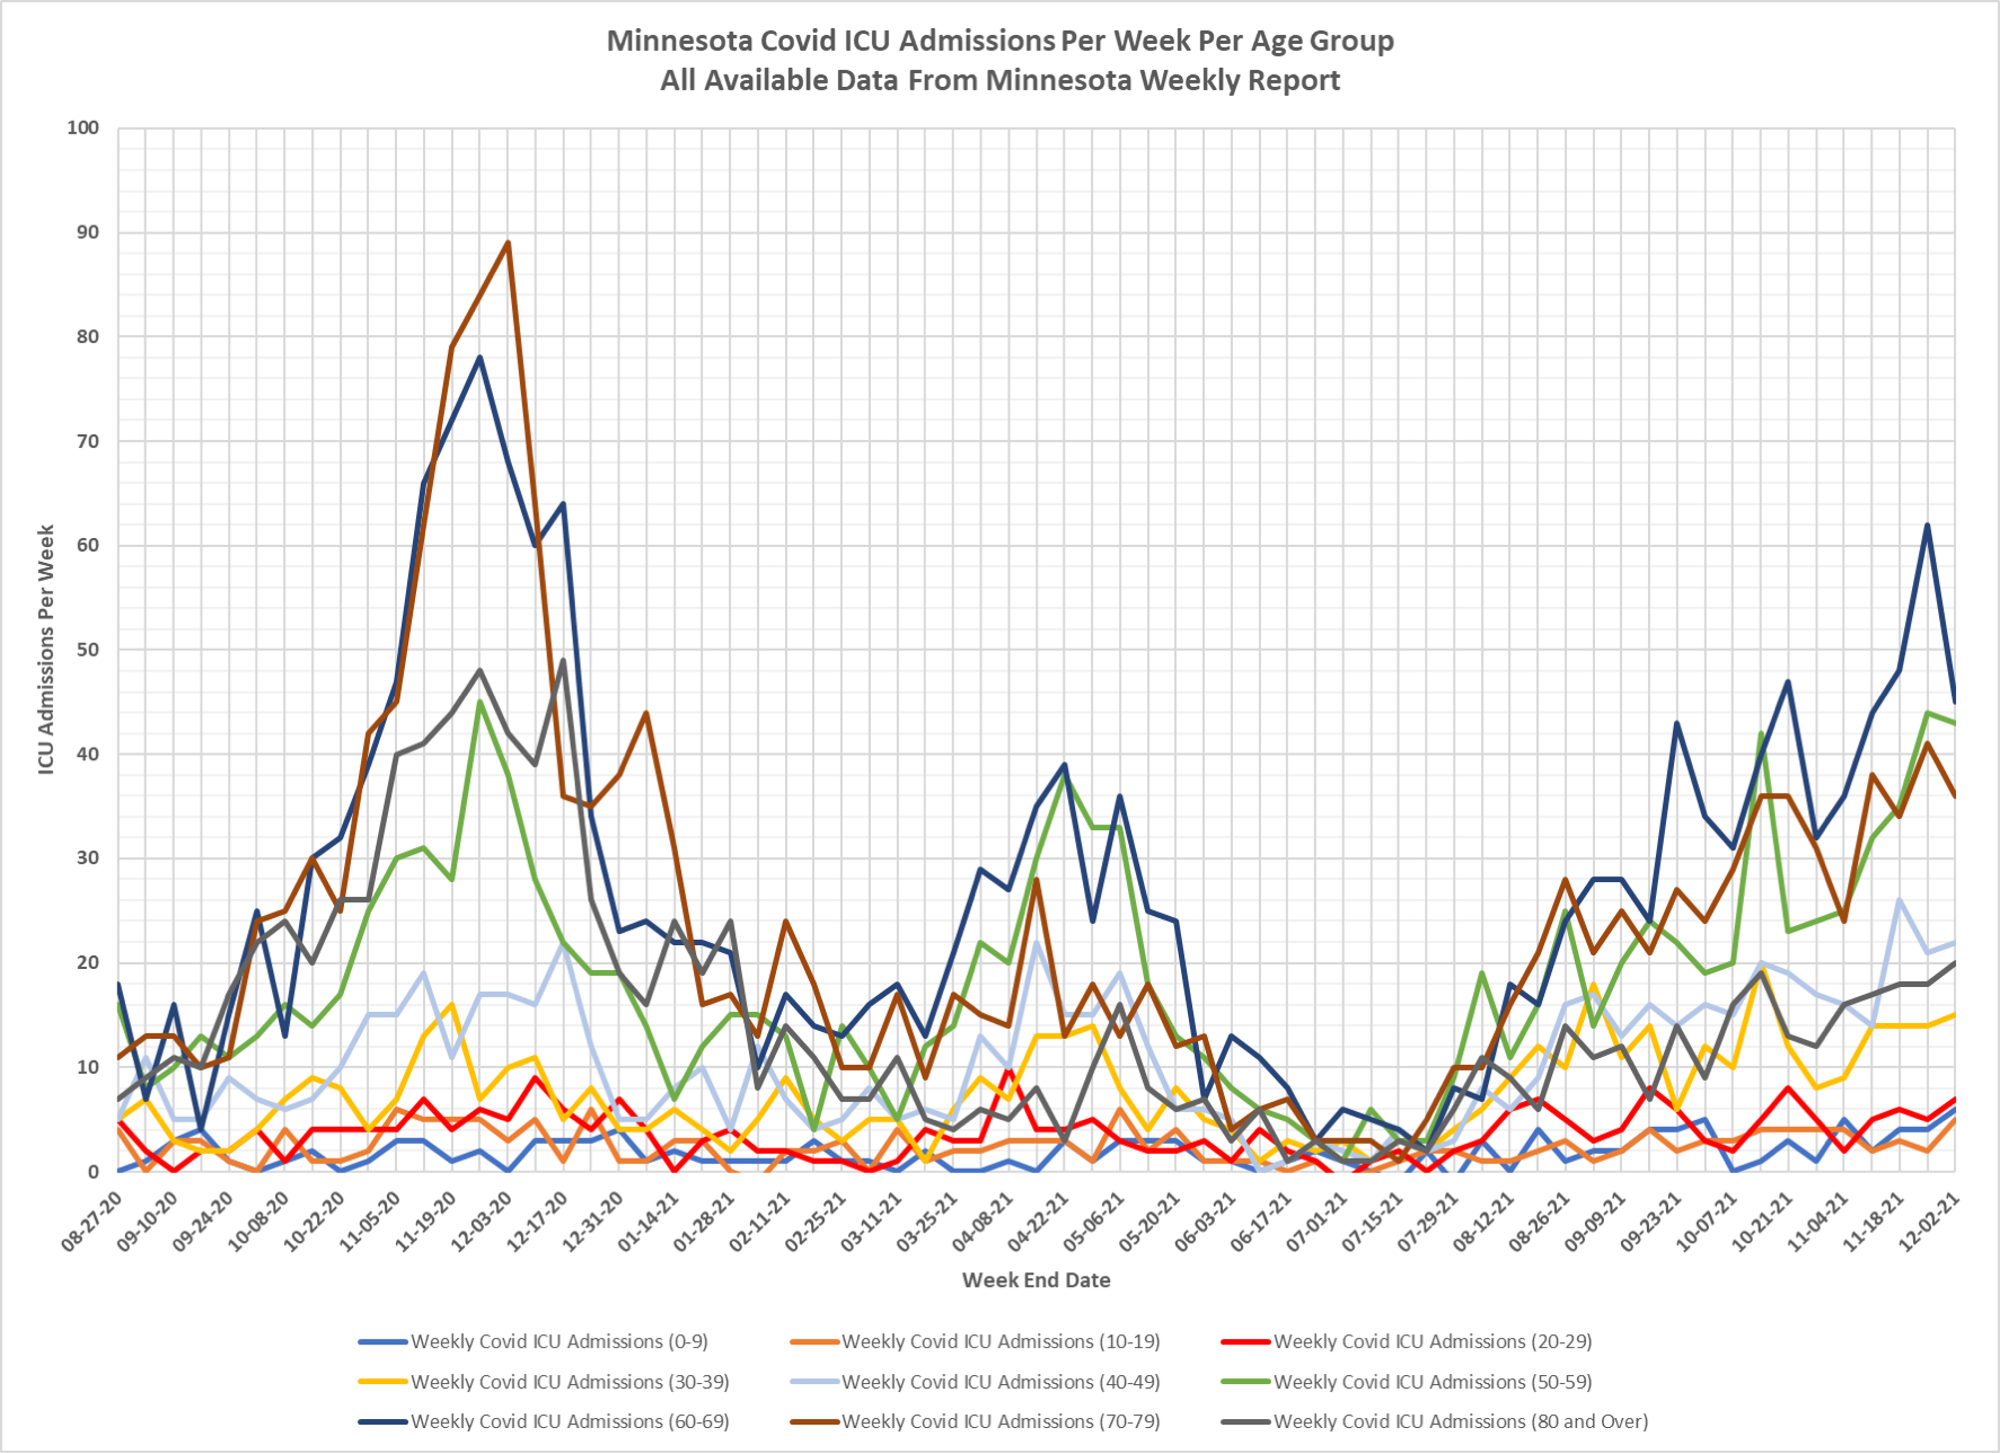
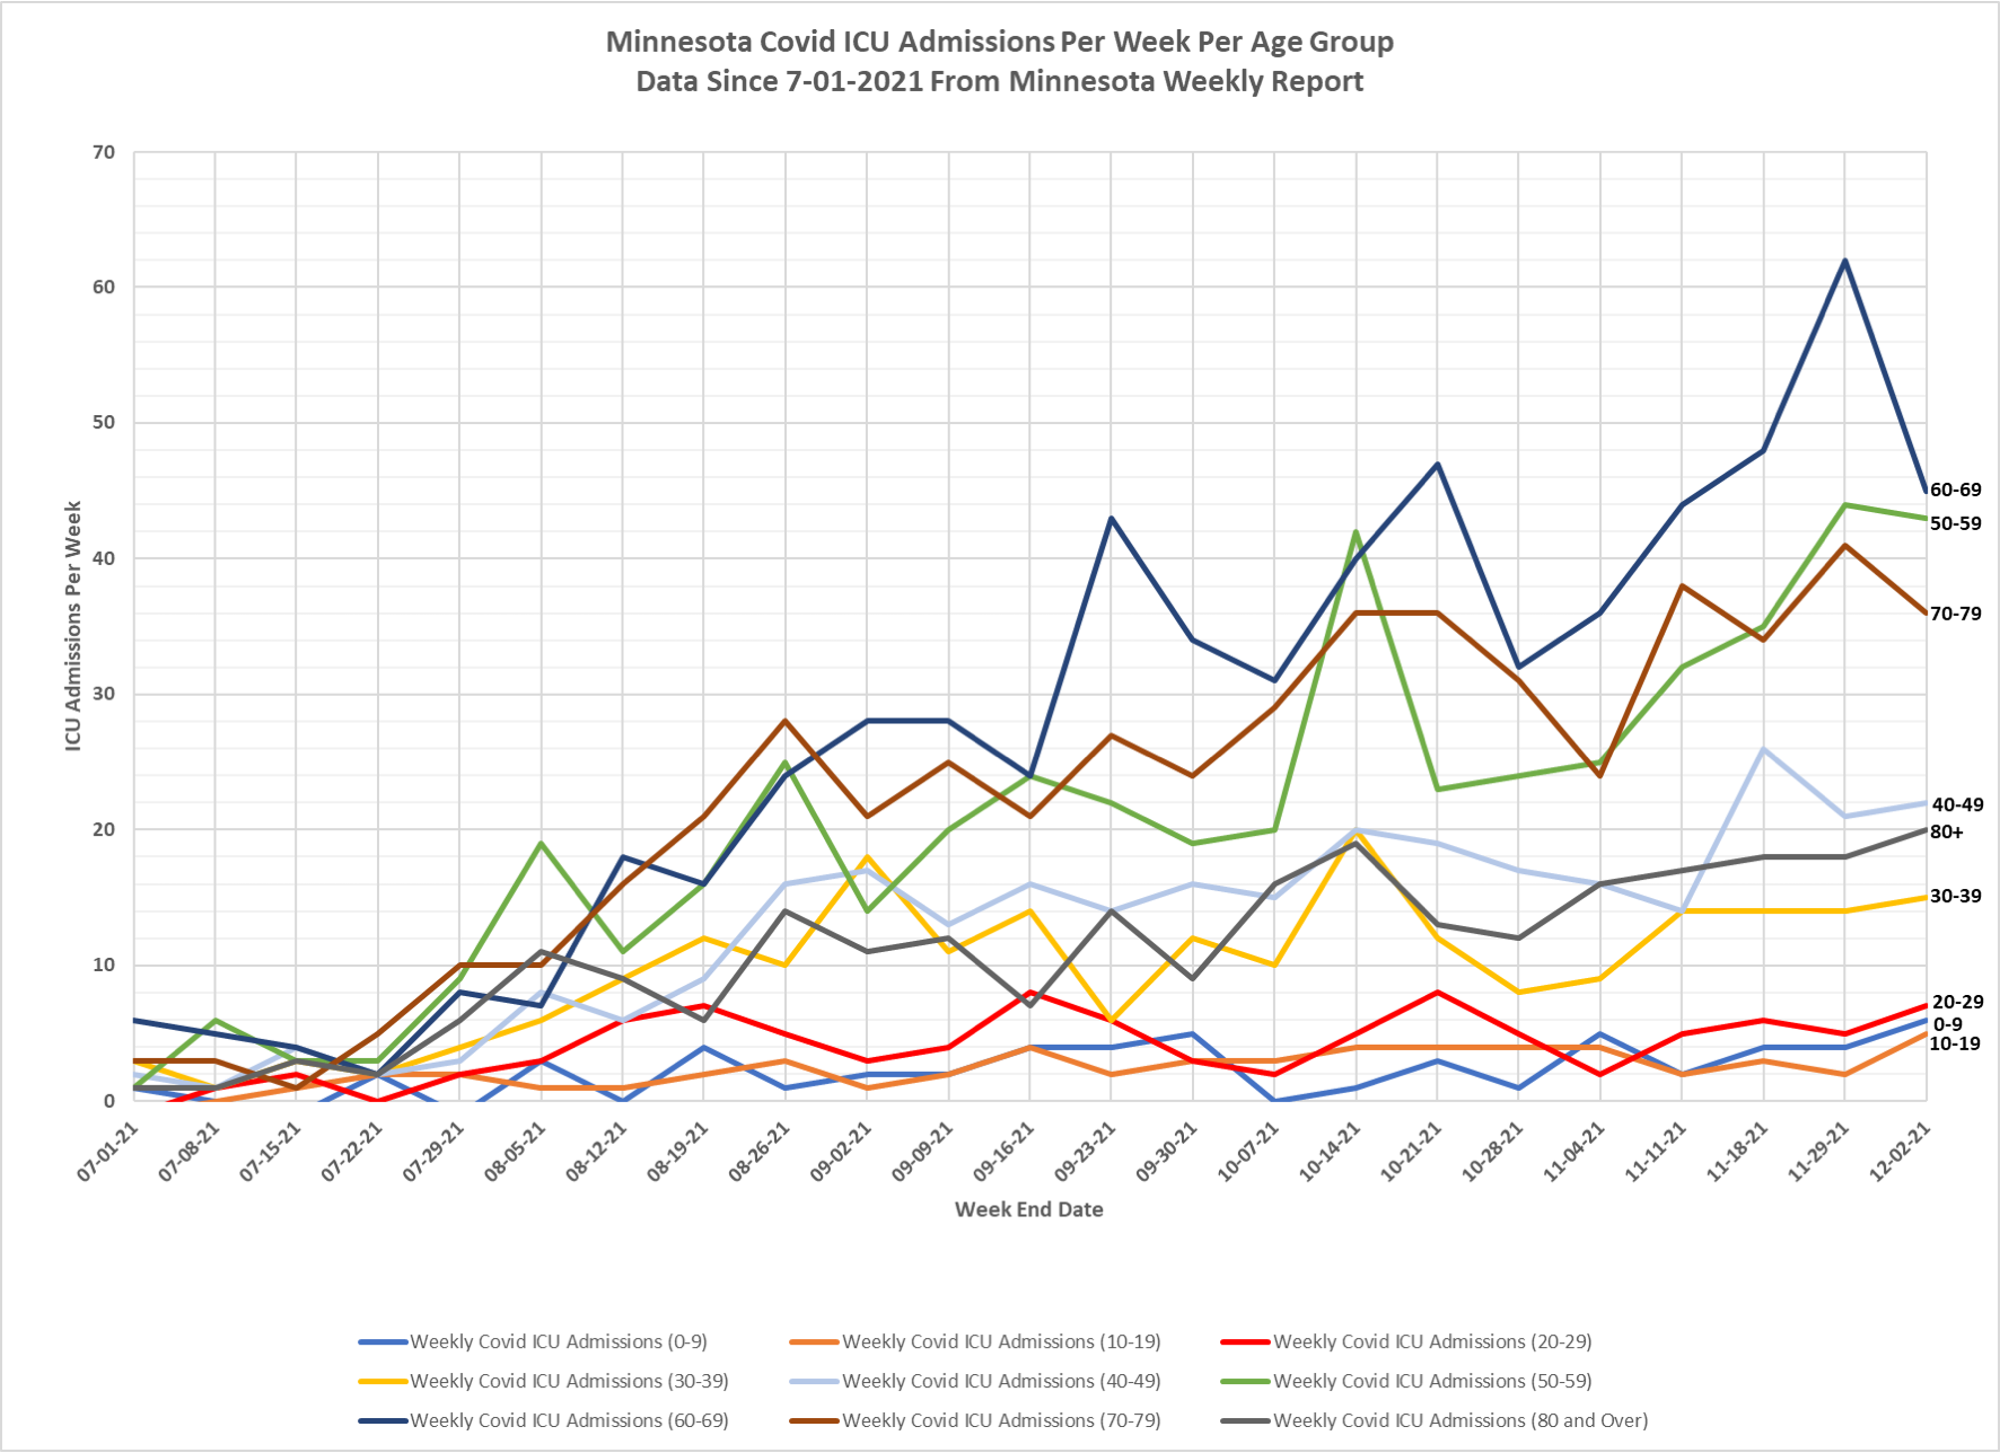
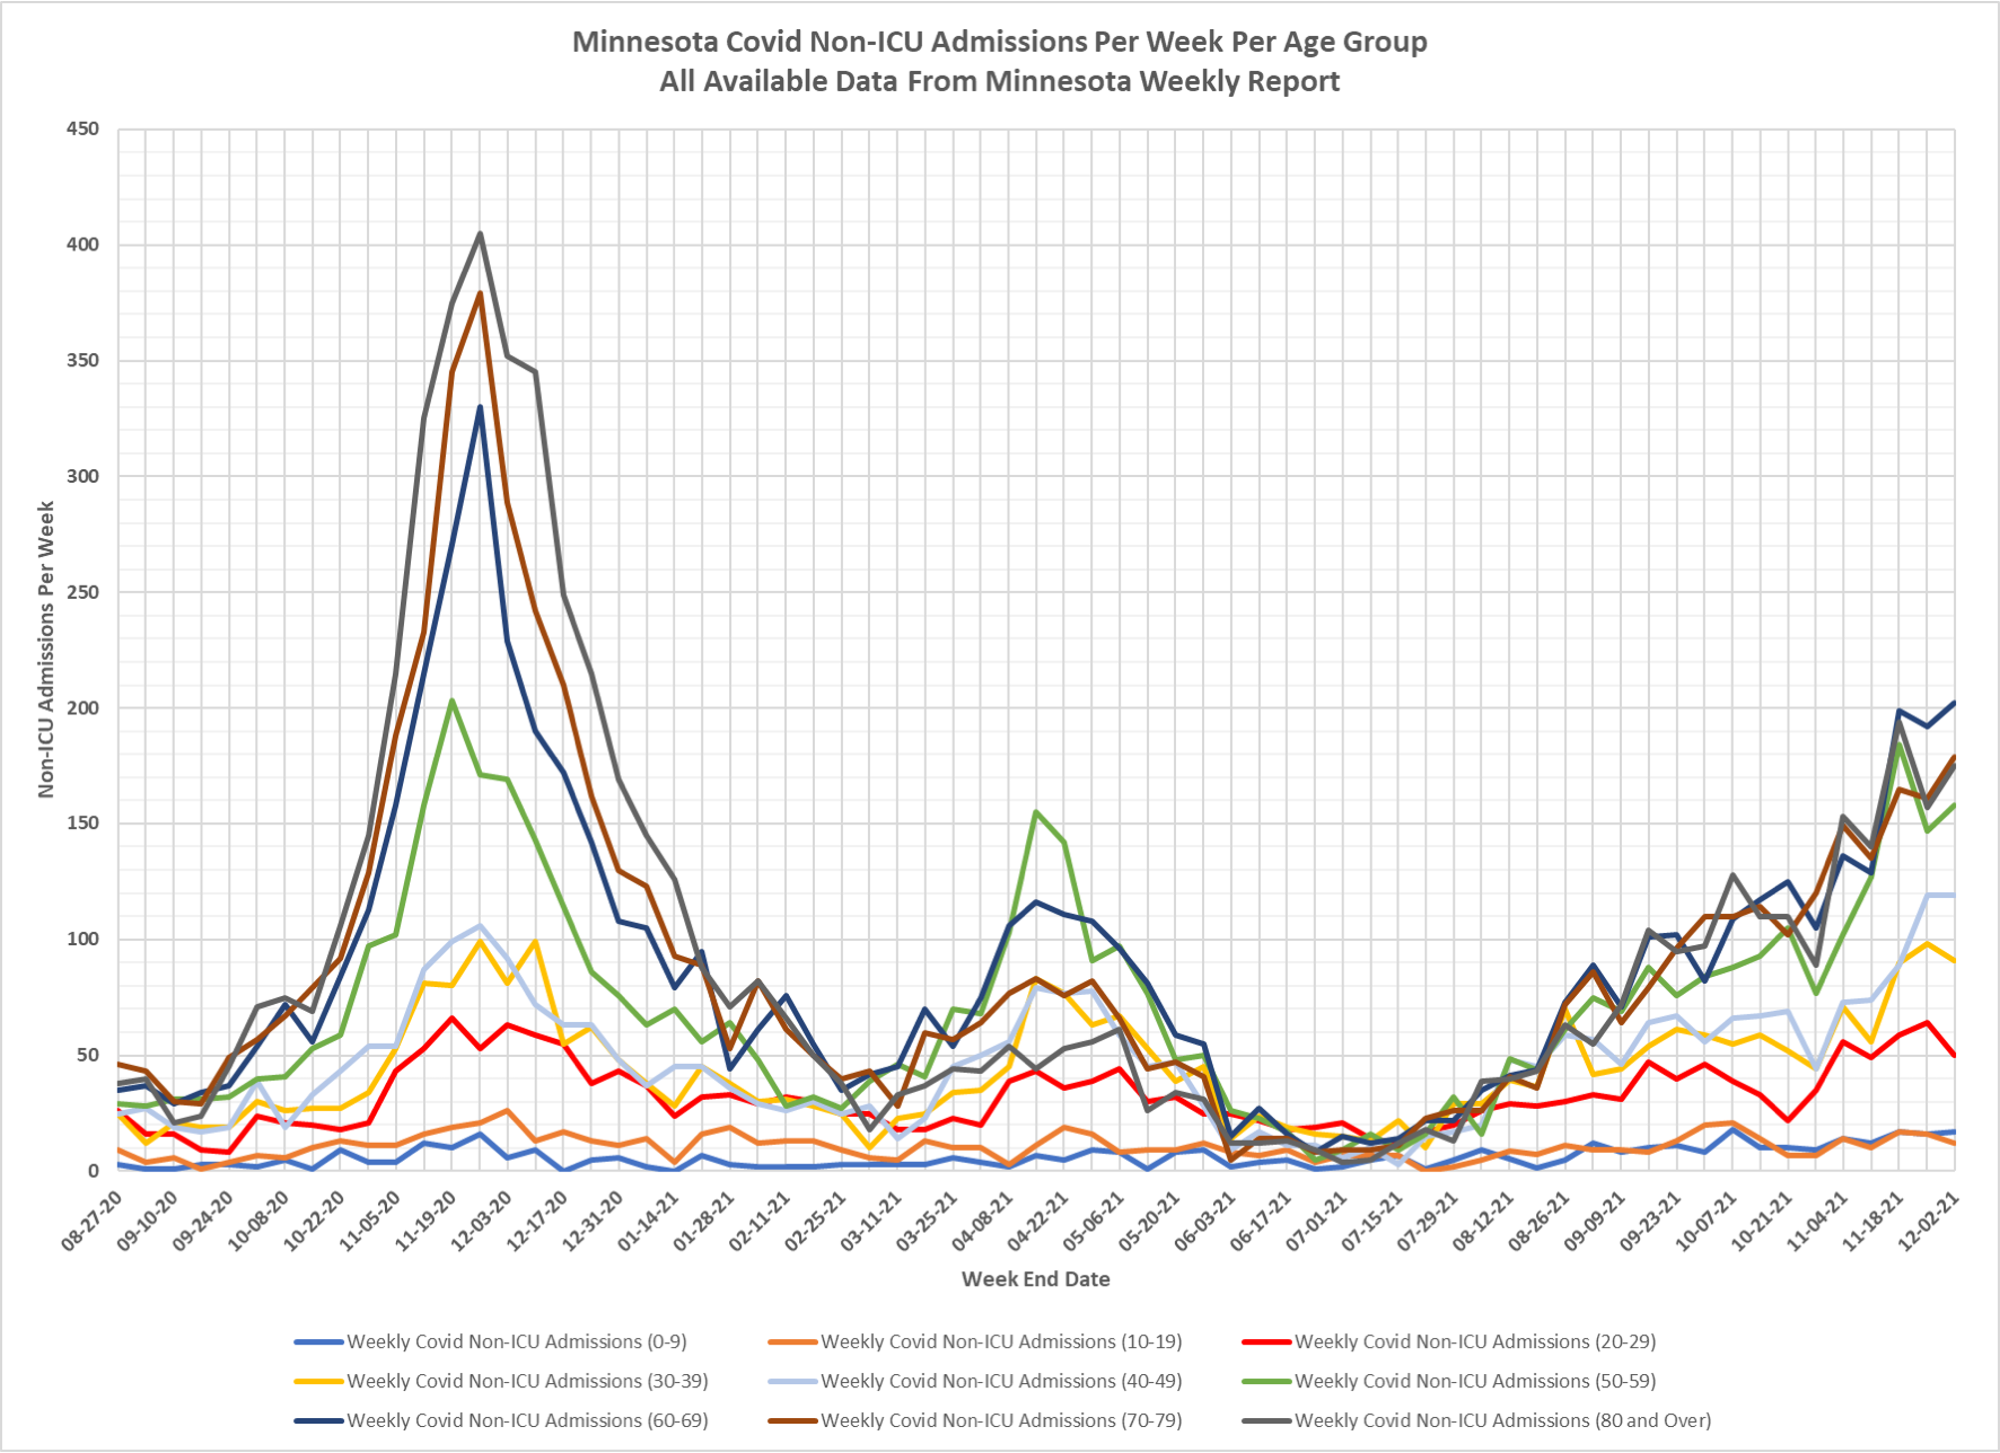
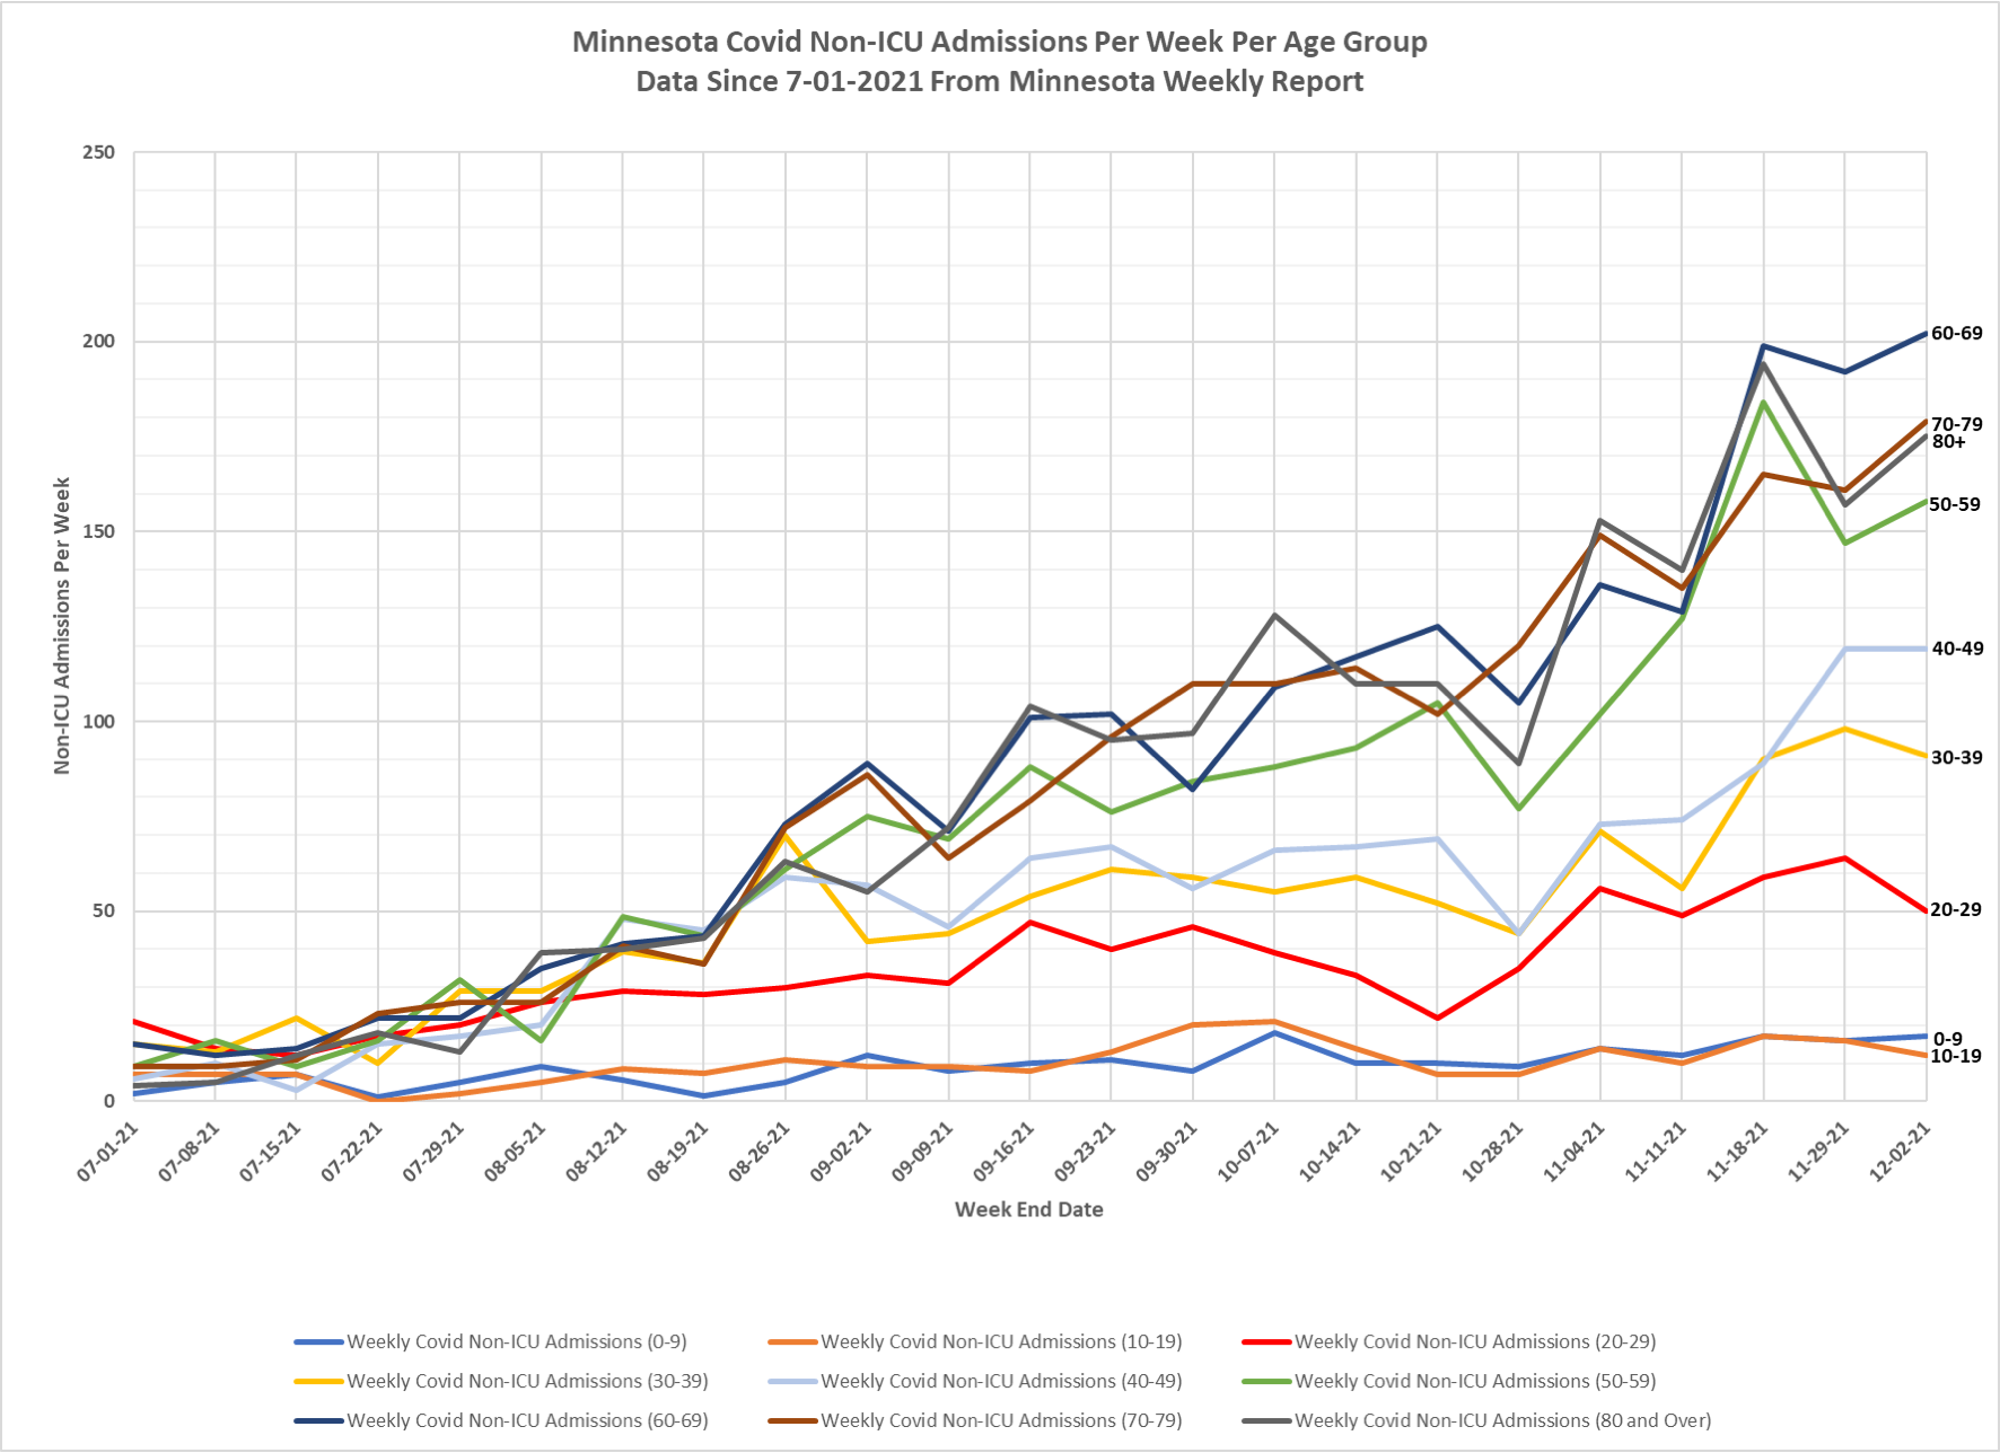
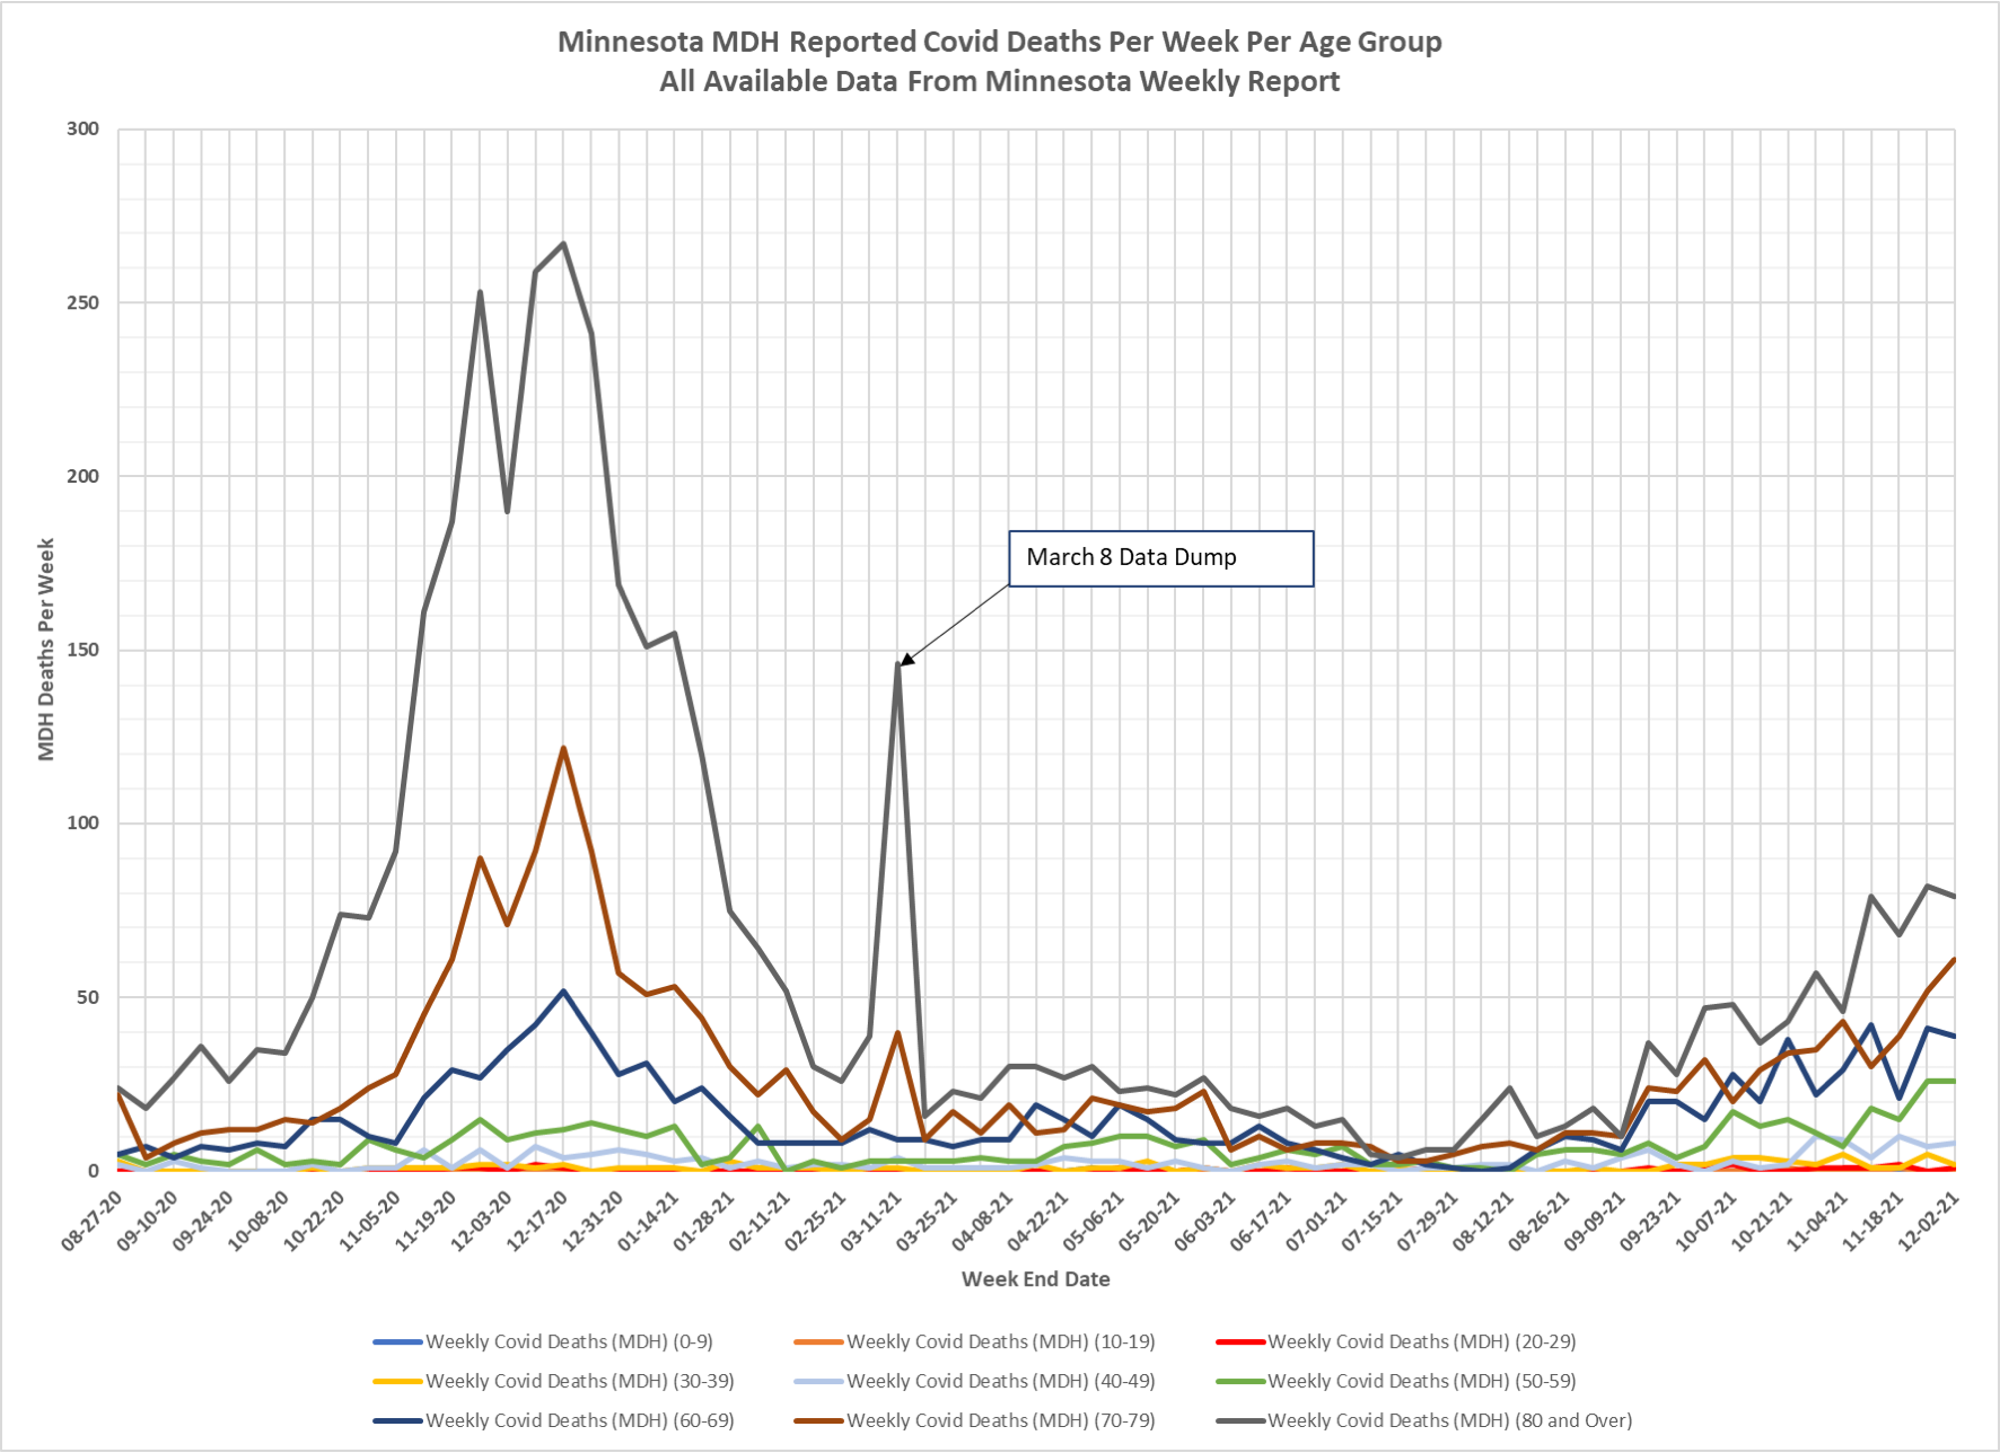
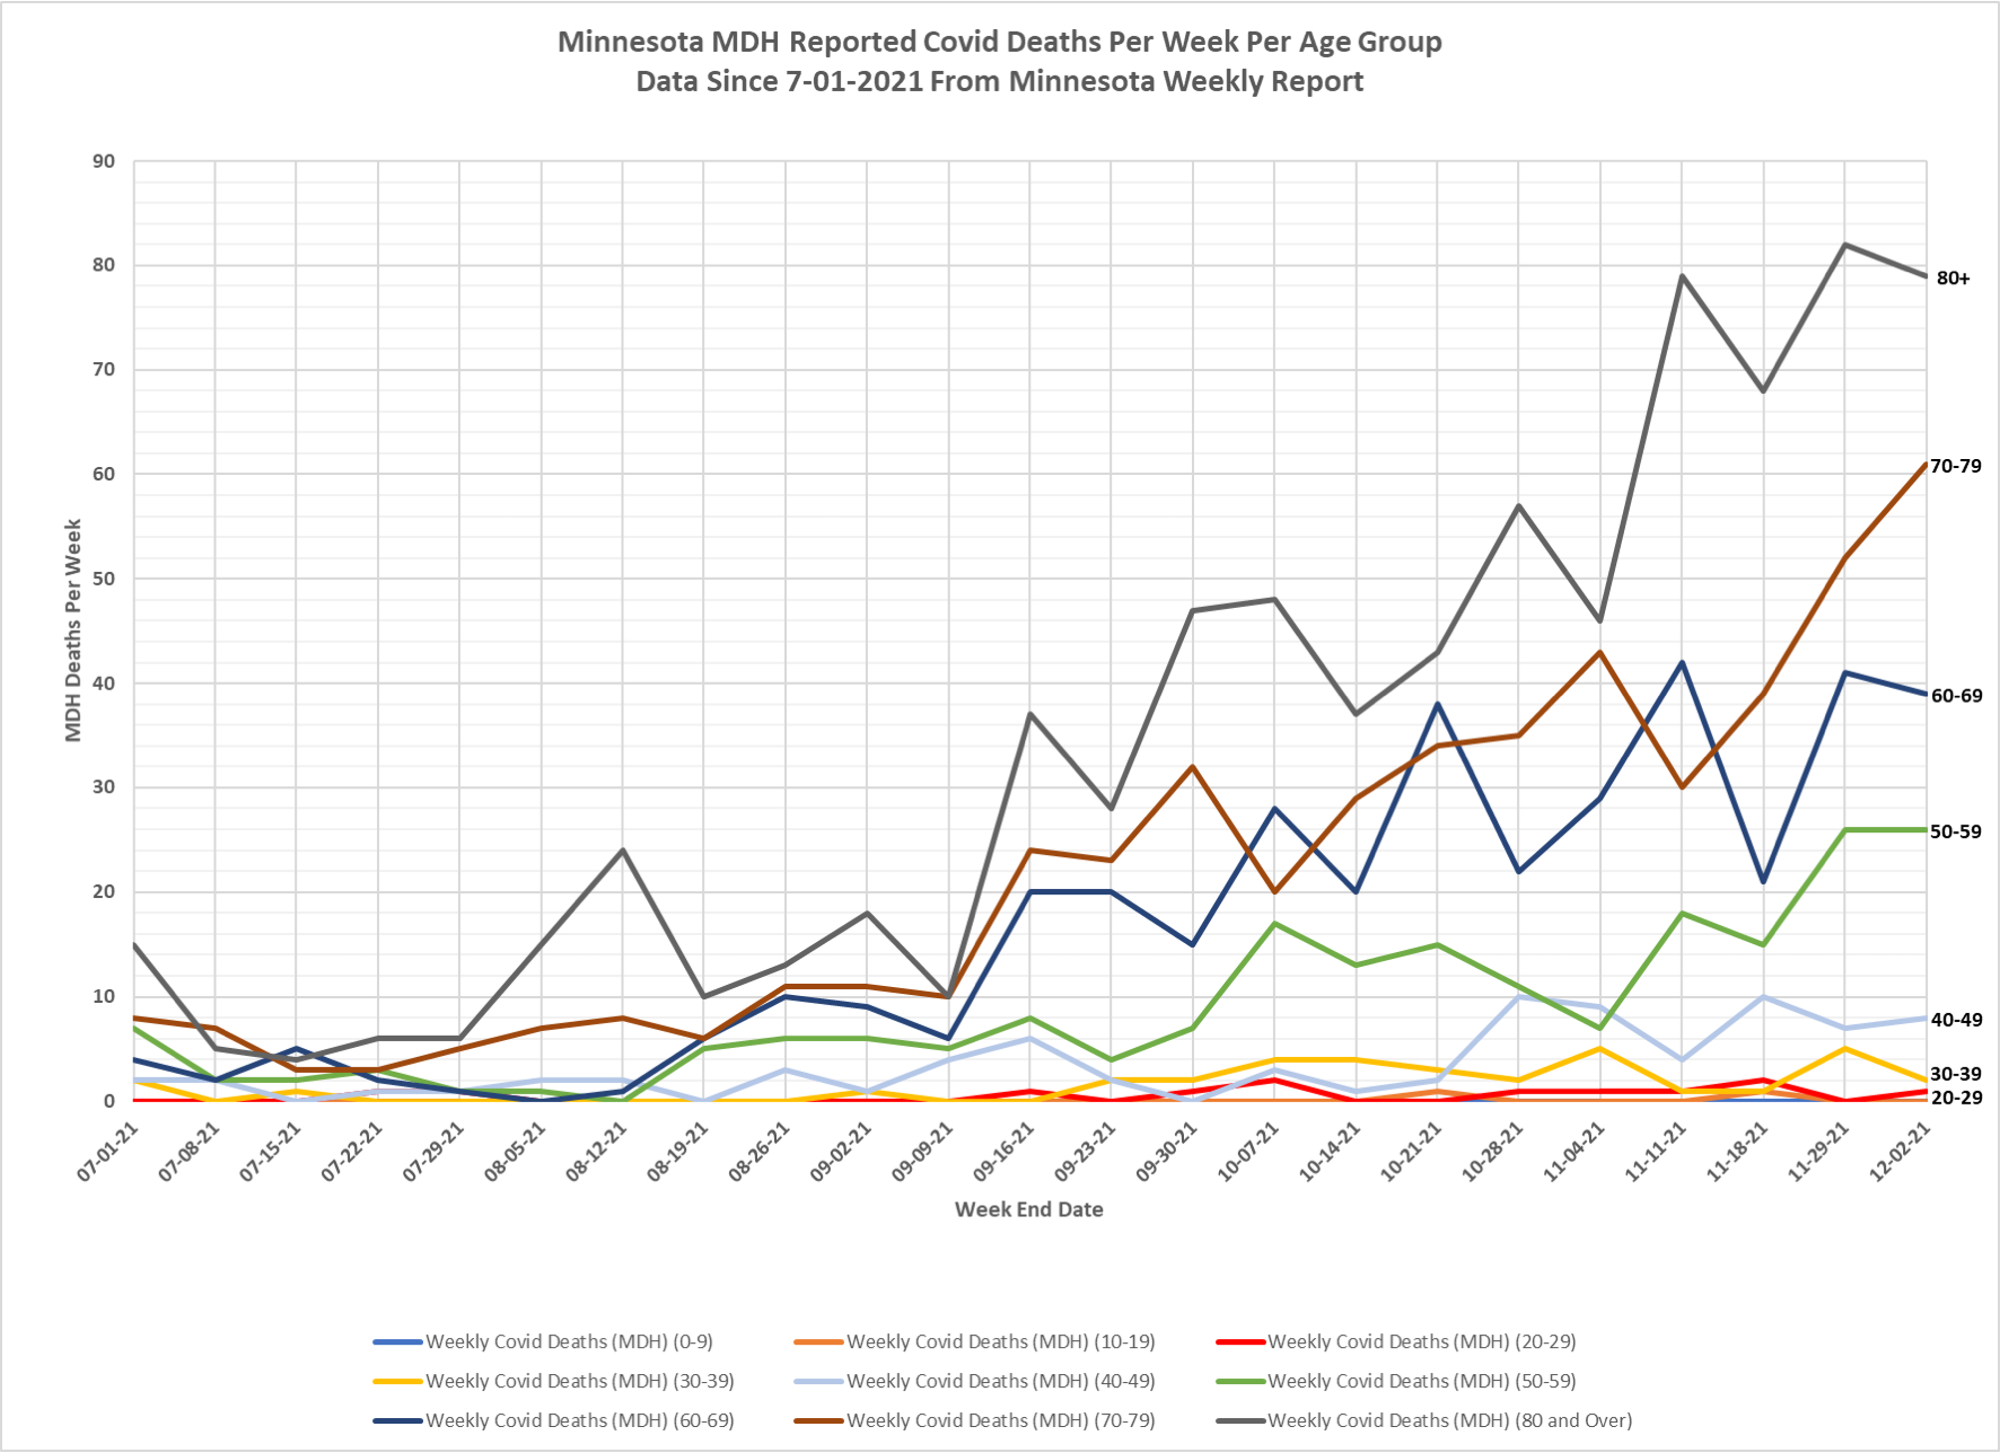
2. The data for the charts on testing, hospital admissions, and deaths comes from the Minnesota Weekly Report (available here: https://www.health.state.mn.us/diseases/coronavirus/stats/index.html). The data in the Weekly Report is presented as cumulative totals for each data type each week. I am taking weekly differences and assembling the data into charts. This data is by date of report, meaning the charts are documenting new events reported this week, even though the underlying event occurred sometime in the past. The data is provided for 5 year age groups, and I am assembling into 10 year age groups to make the charts more readable.
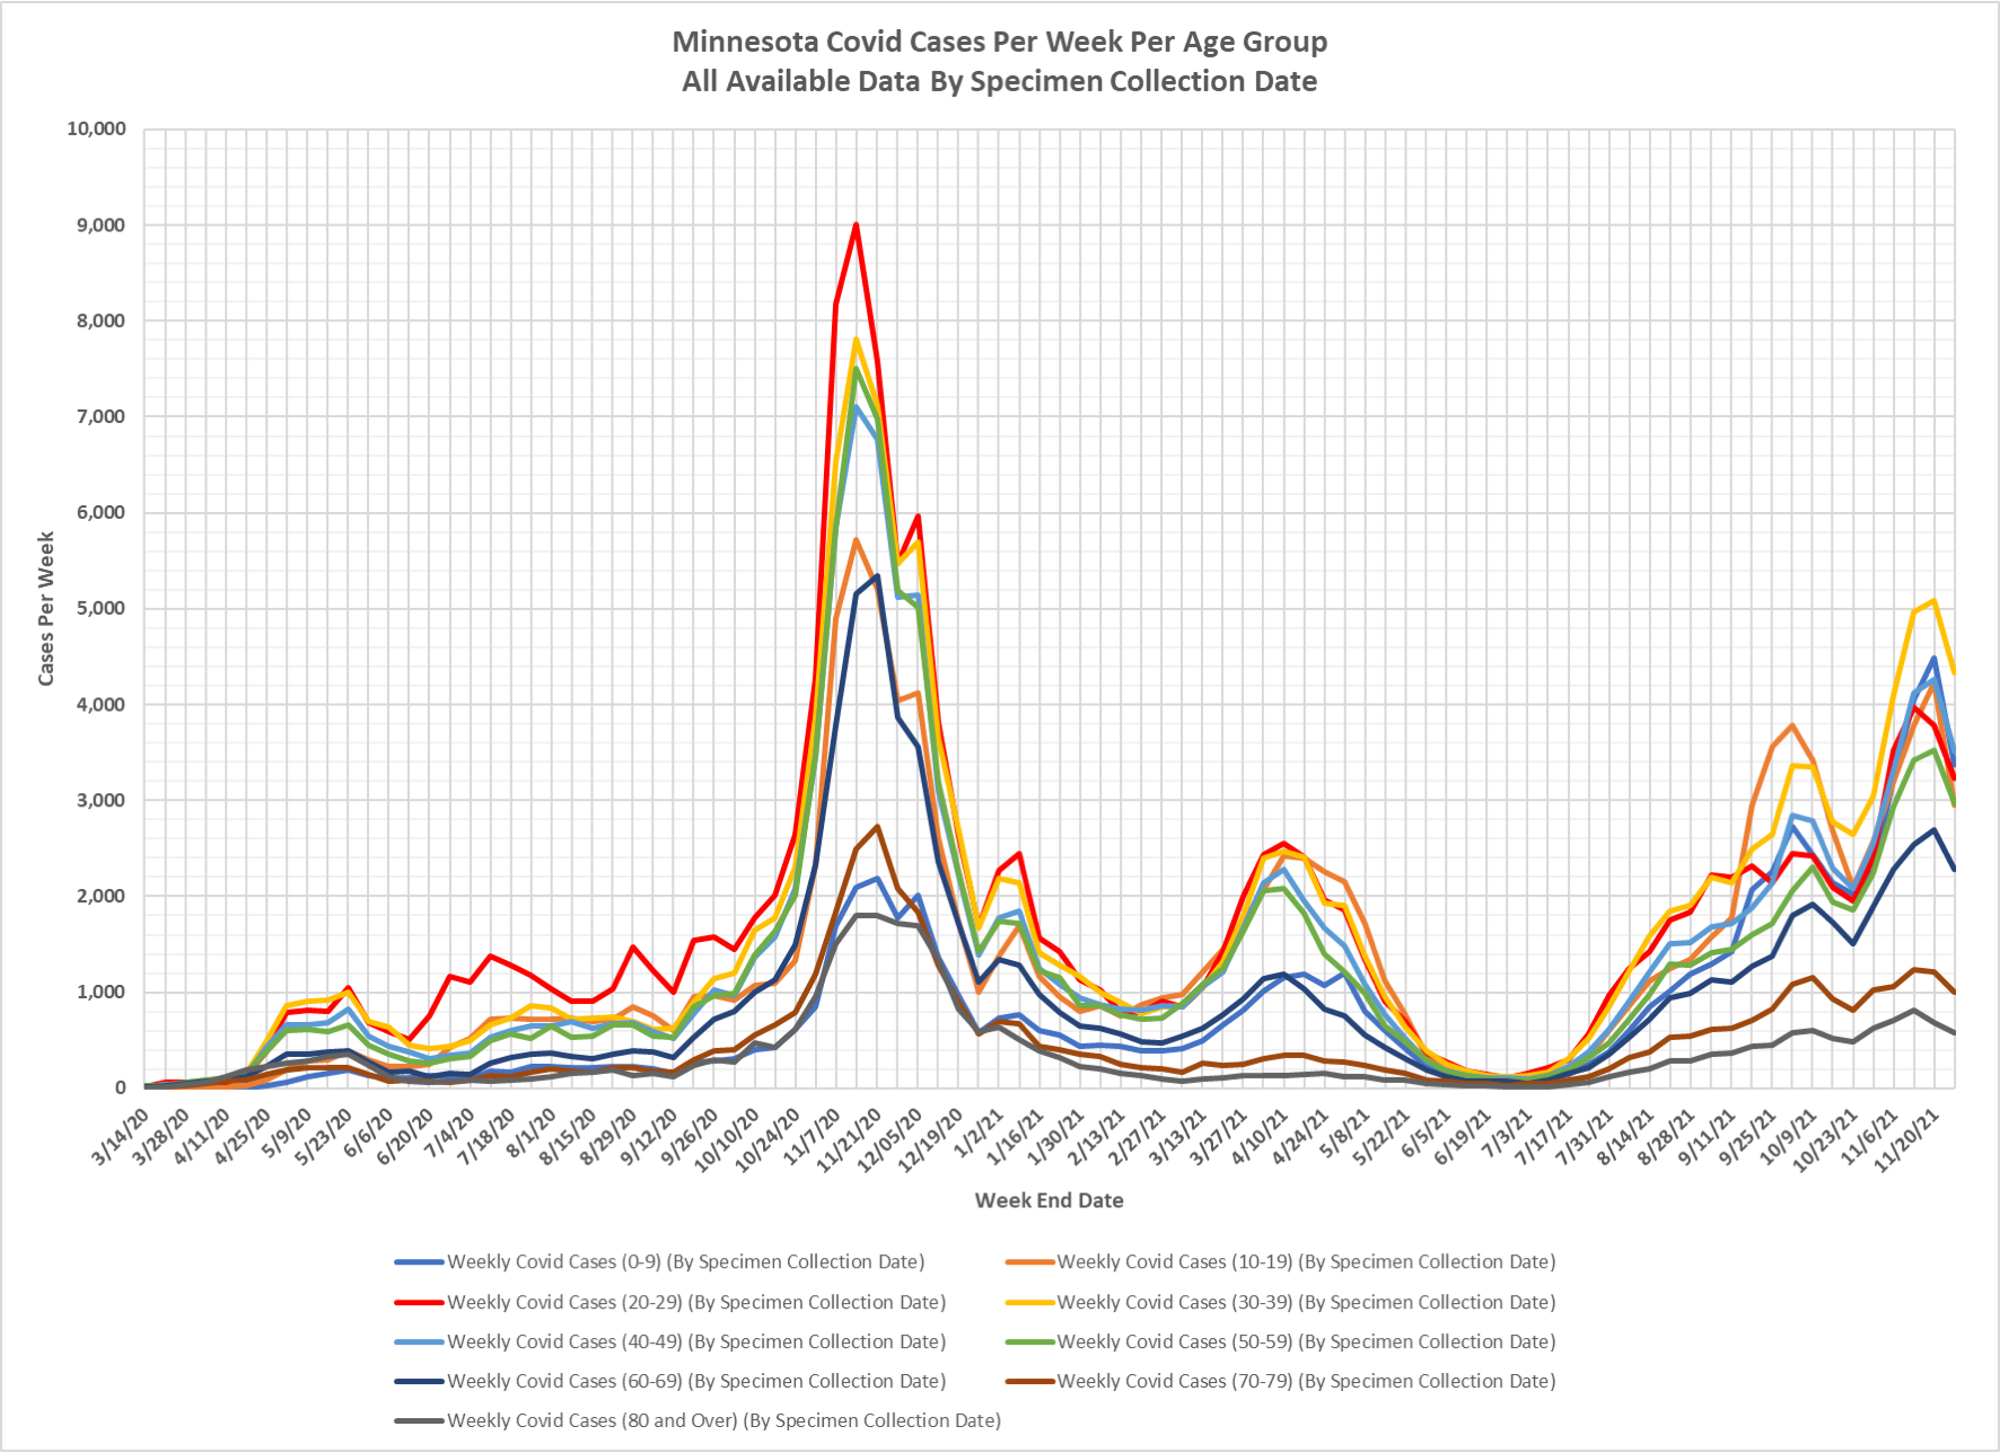
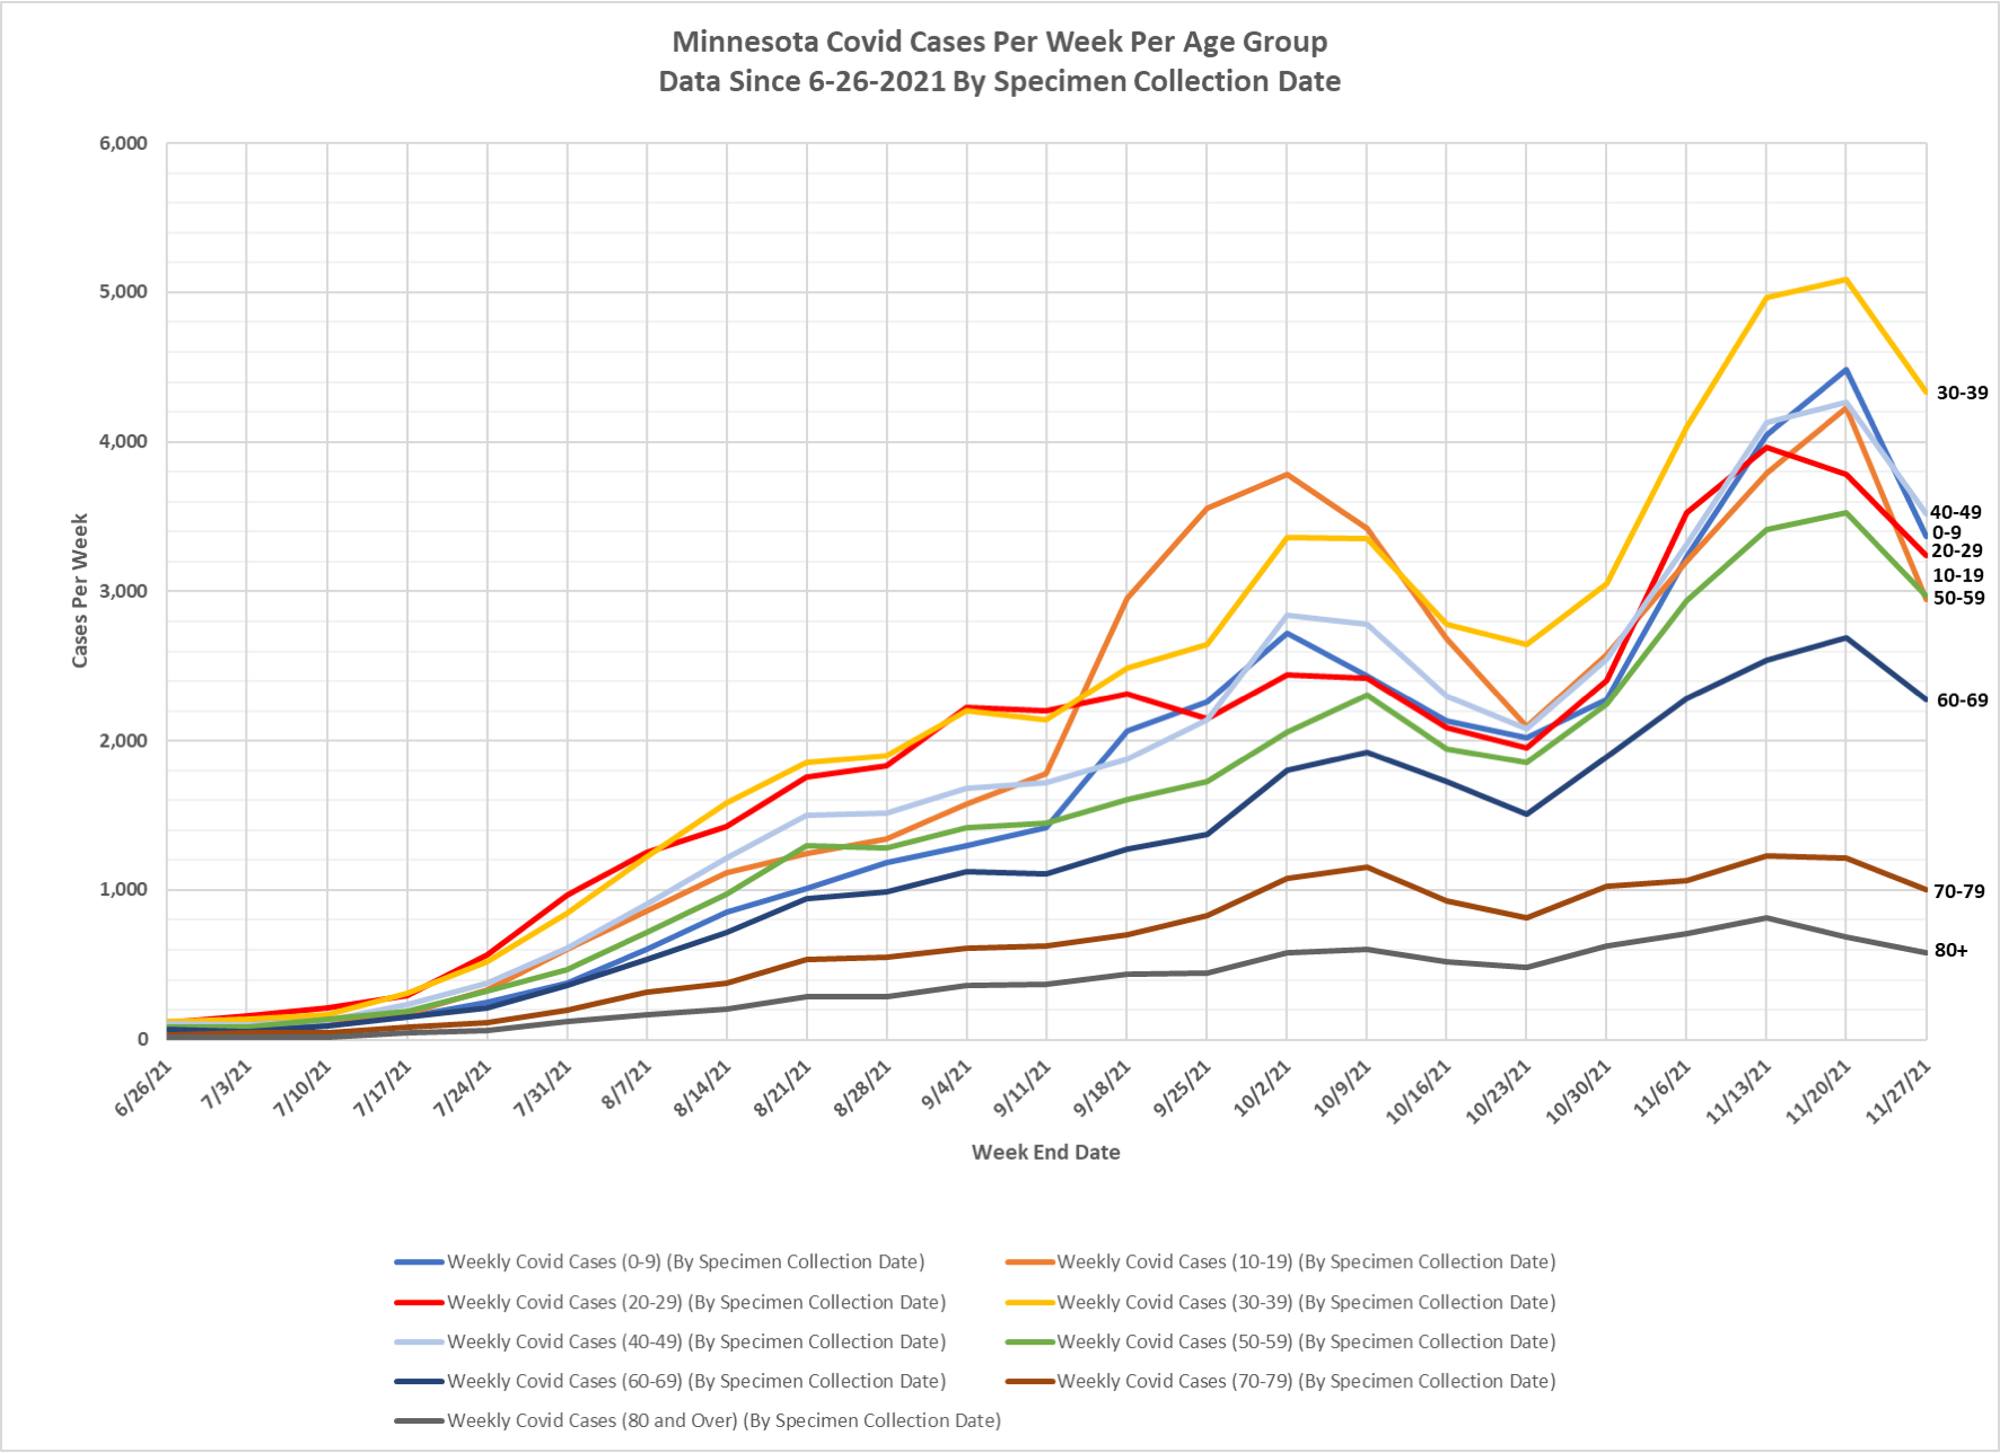
3. The data for the Covid cases per week come from a data file published along with the Minnesota Weekly Report, here: https://www.health.state.mn.us/diseases/coronavirus/stats/index.html#wagscd1 This data is published by date of specimen collection, rather than by date of report as the other data is. The data is provided as cases per week in 5 year age groups. I am compiling the data into 10 year age groups in order for the charts to be more readable.
4. Fig. 1 and 2: Covid Tests Per Week. The major changes up and down in weekly testing rates continue for the sixth week in a row. The Minnesota Situation Update page (https://www.health.state.mn.us/diseases/coronavirus/situation.html) reports testing by date of test (although without the age breakdowns). The testing reported in the Situation Update does not exhibit the large up and down swings that the Weekly Report does.
5. Fig. 3 and 4: Covid Cases Per Week. The Covid cases per week were lower this week for all age groups. The cases profile generally appears to match the overall new cases curve as published on the Situation Update web page.
Total cases for the week were reported as 24,232, an overall decrease of 19.1% over last week’s total.
6. Fig. 5 and 6: ICU Admissions Per Week. ICU admissions were moderately higher in the younger age groups, although still at very low levels. There were 6 reported Covid ICU admissions in the 0-9 age group in this Weekly Report, 5 in the 10-19 age group, and 7 in the 20-29 age group. There still appears to be very minor impact of Covid infections on ICU admissions for school age children, with little change in the rate of childhood ICU admissions over many months. Total ICU admissions for the week were 199, down 12 from the prior week. The largest decrease occurred in the 60-69 age group, reversing last week’s large increase in ICU admissions.
7. Fig. 7 and 8: Non-ICU Admissions Per Week. Non-ICU admissions were little changed this week, a little higher in the 50 and older age groups, and flat or lower in the 49 and younger age groups. Non-ICU Covid admissions for the younger age groups remain very low, as they have for many months. The 0-9 age group increased from 16 to 17 Non-ICU Covid admissions for the week, while the 10-19 admissions decreased from 16 to 12 for the week.
Total Non-ICU Covid admissions for the week were 1003, an increase of 33 admissions from the 970 admissions last week.
8. Fig. 9 and 10: Deaths Per Week. Total reported deaths for the week were 216, a small increase from 213 reported deaths the week before. The 70-79 age group increased from 52 to 61 for the week. All other age groups were little changed. Deaths remain very well correlated with age.