No DOH has changed how they report hospital capacity over time, sometimes in weird jumps. This is important because one of the leading terror items is running out of hospital capacity. Funny how we never hear about the role vaccine mandates are playing in available capacity. In any event Dave Dixon tracks both capacity and use and the update charts are below. More importantly, Dave lays out what he thinks is going on with various changes.
1. Recently the Minnesota Department of Health (MDH) modified the hospital capacity information published on the Minnesota’s COVID-19 Response Capacity web page (https://mn.gov/covid19/data/response-prep/response-capacity.jsp). On 11/18/2021 MDH started reporting adult and pediatric bed capacity separately. In addition, prior to 11/8/2021, the previously reported ICU capacity included adult and pediatric capacity, but the reported Non-ICU capacity was adult only. On 11/18/2021 pediatric Non-ICU bed capacity was included in the reported capacity for the first time.
2. MDH publishes capacity and utilization information in 2 data files on the Response Capacity web page. TeleTracking, published here: https://mn.gov/covid19/assets/TELETRACKING_ICU_NonICU_Beds_in_Use_CSV_tcm1148-455097.csv, contains data for hospital beds in use, categorized as Covid or Non-COVID, ICU or Non-ICU, and by Minnesota region. This data is used to generate the beds in use charts *Fig. 1 and Fig. 2).
MNTRAC, published here, https://mn.gov/covid19/assets/MNTRAC_ICU_NonICU_BedAvailability_IdentifiedSurge_CSV_tcm1148-455098.csv, contains data for hospital capacity, including adult and pediatric ICU and Non-ICU bed capacity, beds in use, and beds available, among other information. This data is used to generate the hospital bed capacity and hospital beds available (Fig. 3 and Fig. 4), and also the black Total ICU and Non-ICU Capacity line on Fig. 1. The notes for this data file state that the hospital bed capacity is given in terms of staffed beds.
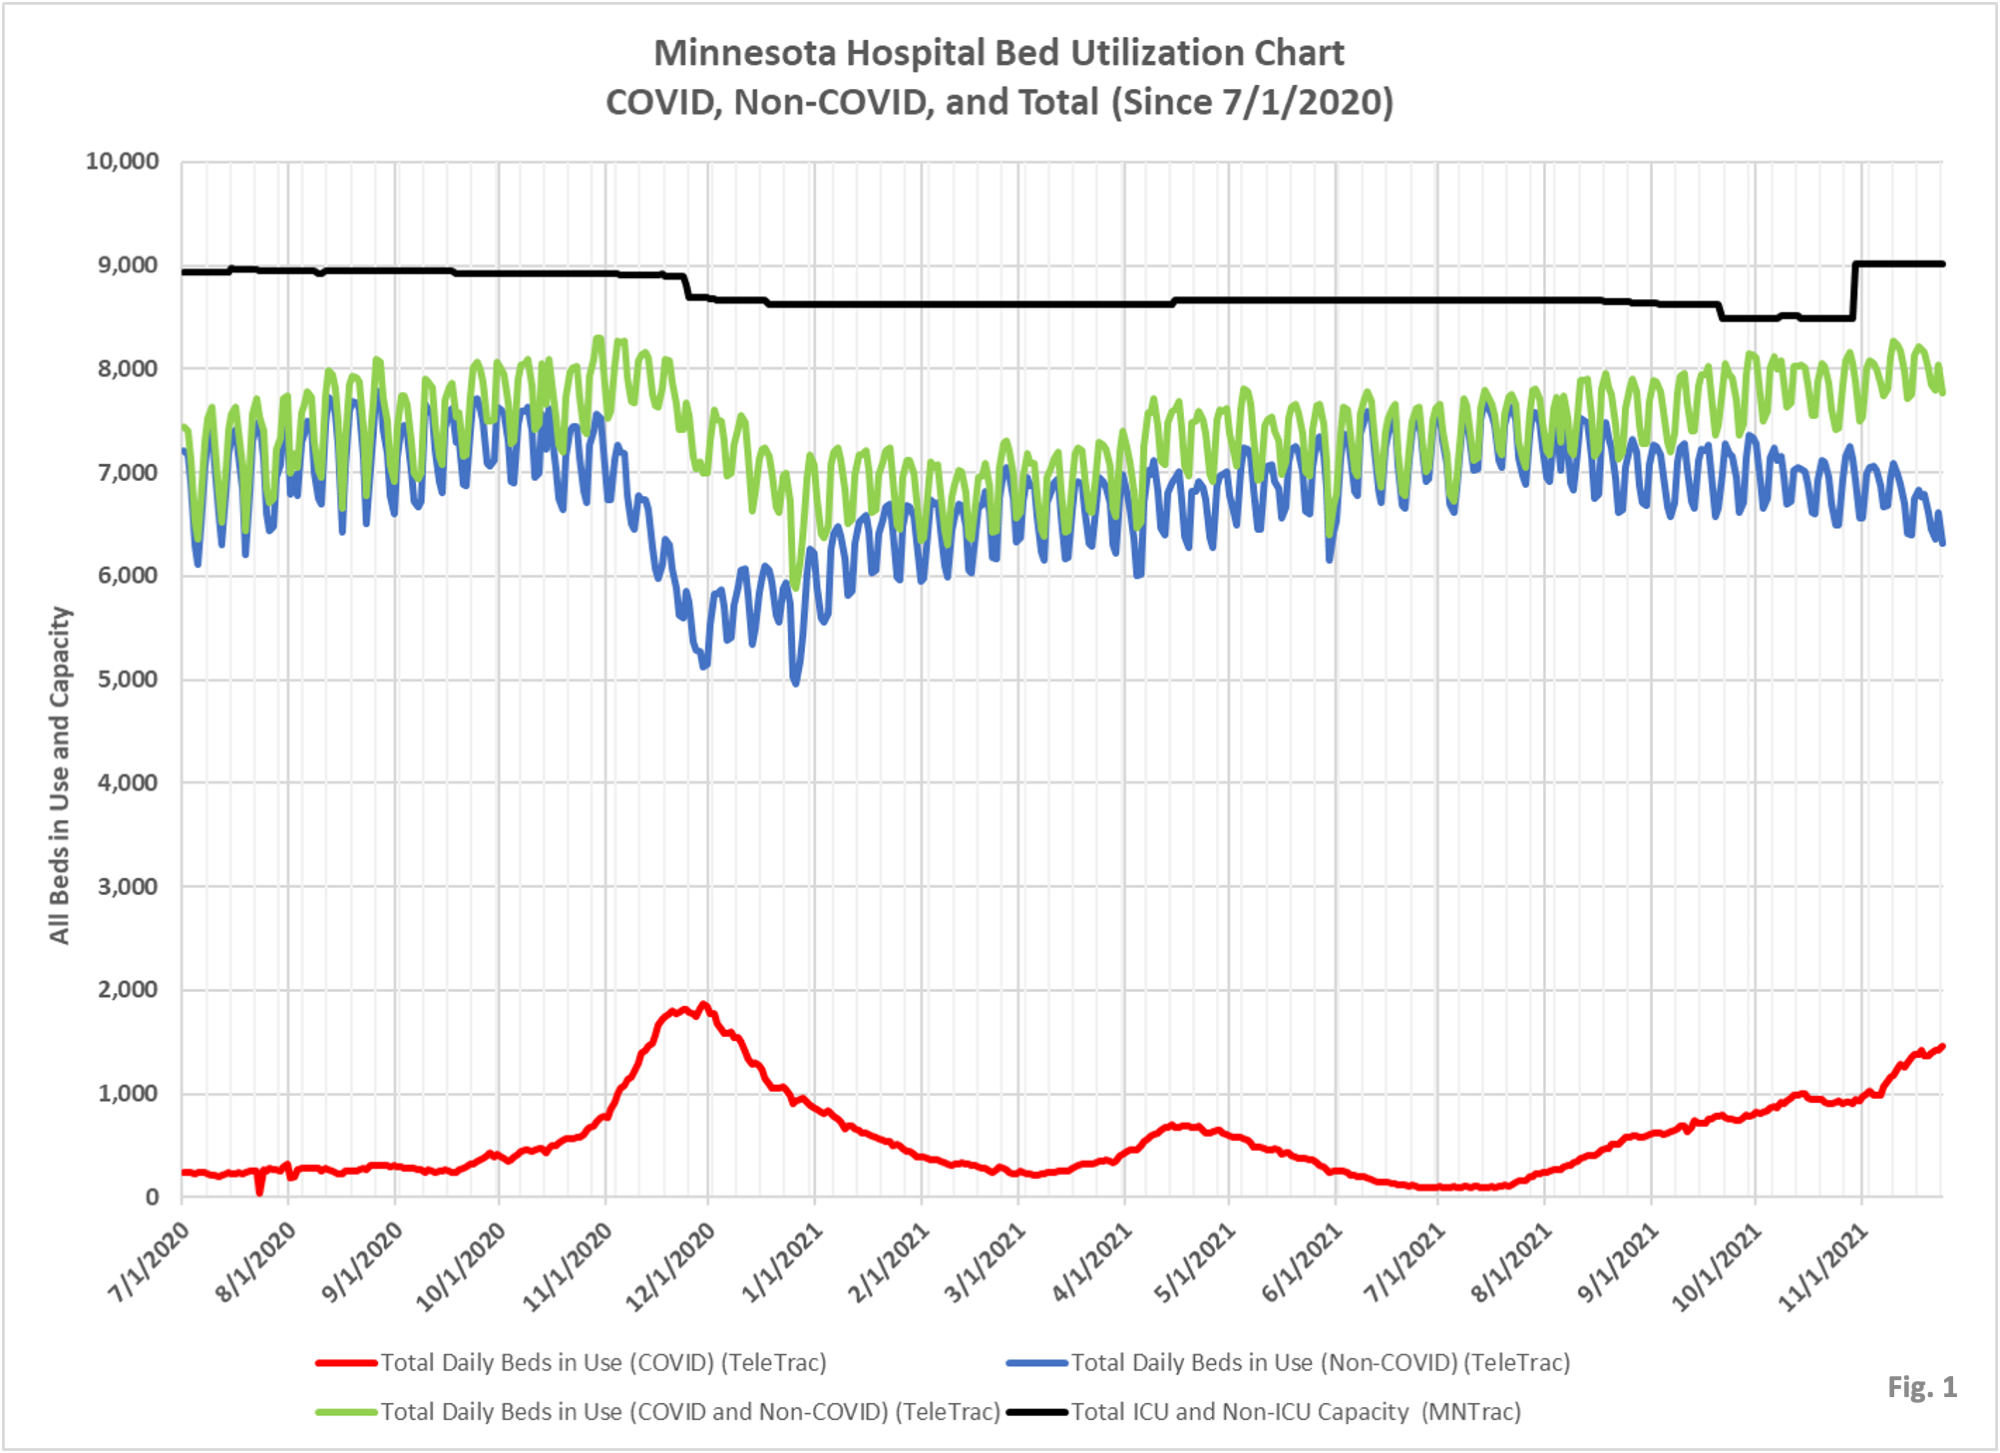
3. Figure 1, Minnesota Hospital Bed Utilization, is an updated version of the chart we have published on this web site many times before. This chart is simply plotting the TelTracking data without modification. The black curve, total hospital bed capacity, is now updated showing the addition of Non-ICU pediatric beds on 11/18/21. Since these beds surely existed prior to 11/18 the increased bed capacity is just a reporting artifact.
Fig. 1 illustrates the total Covid beds in use (red curve), Non-Covid beds in use (blue curve), and total of all beds in use (green curve. As of 11/24/21, a total of 7,773 hospital beds were is use, and total reported, staffed hospital bed capacity was 9,012 beds, implying an unused capacity of 1,239 beds.
Note also that every time that Covid hospitalizations increase, Non-Covid hospitalizations decrease. This effect is probably a combination of decreased ‘elective’ surgeries and because a significant portion of hospitalizations for non-Covid reasons test positive for Covid.
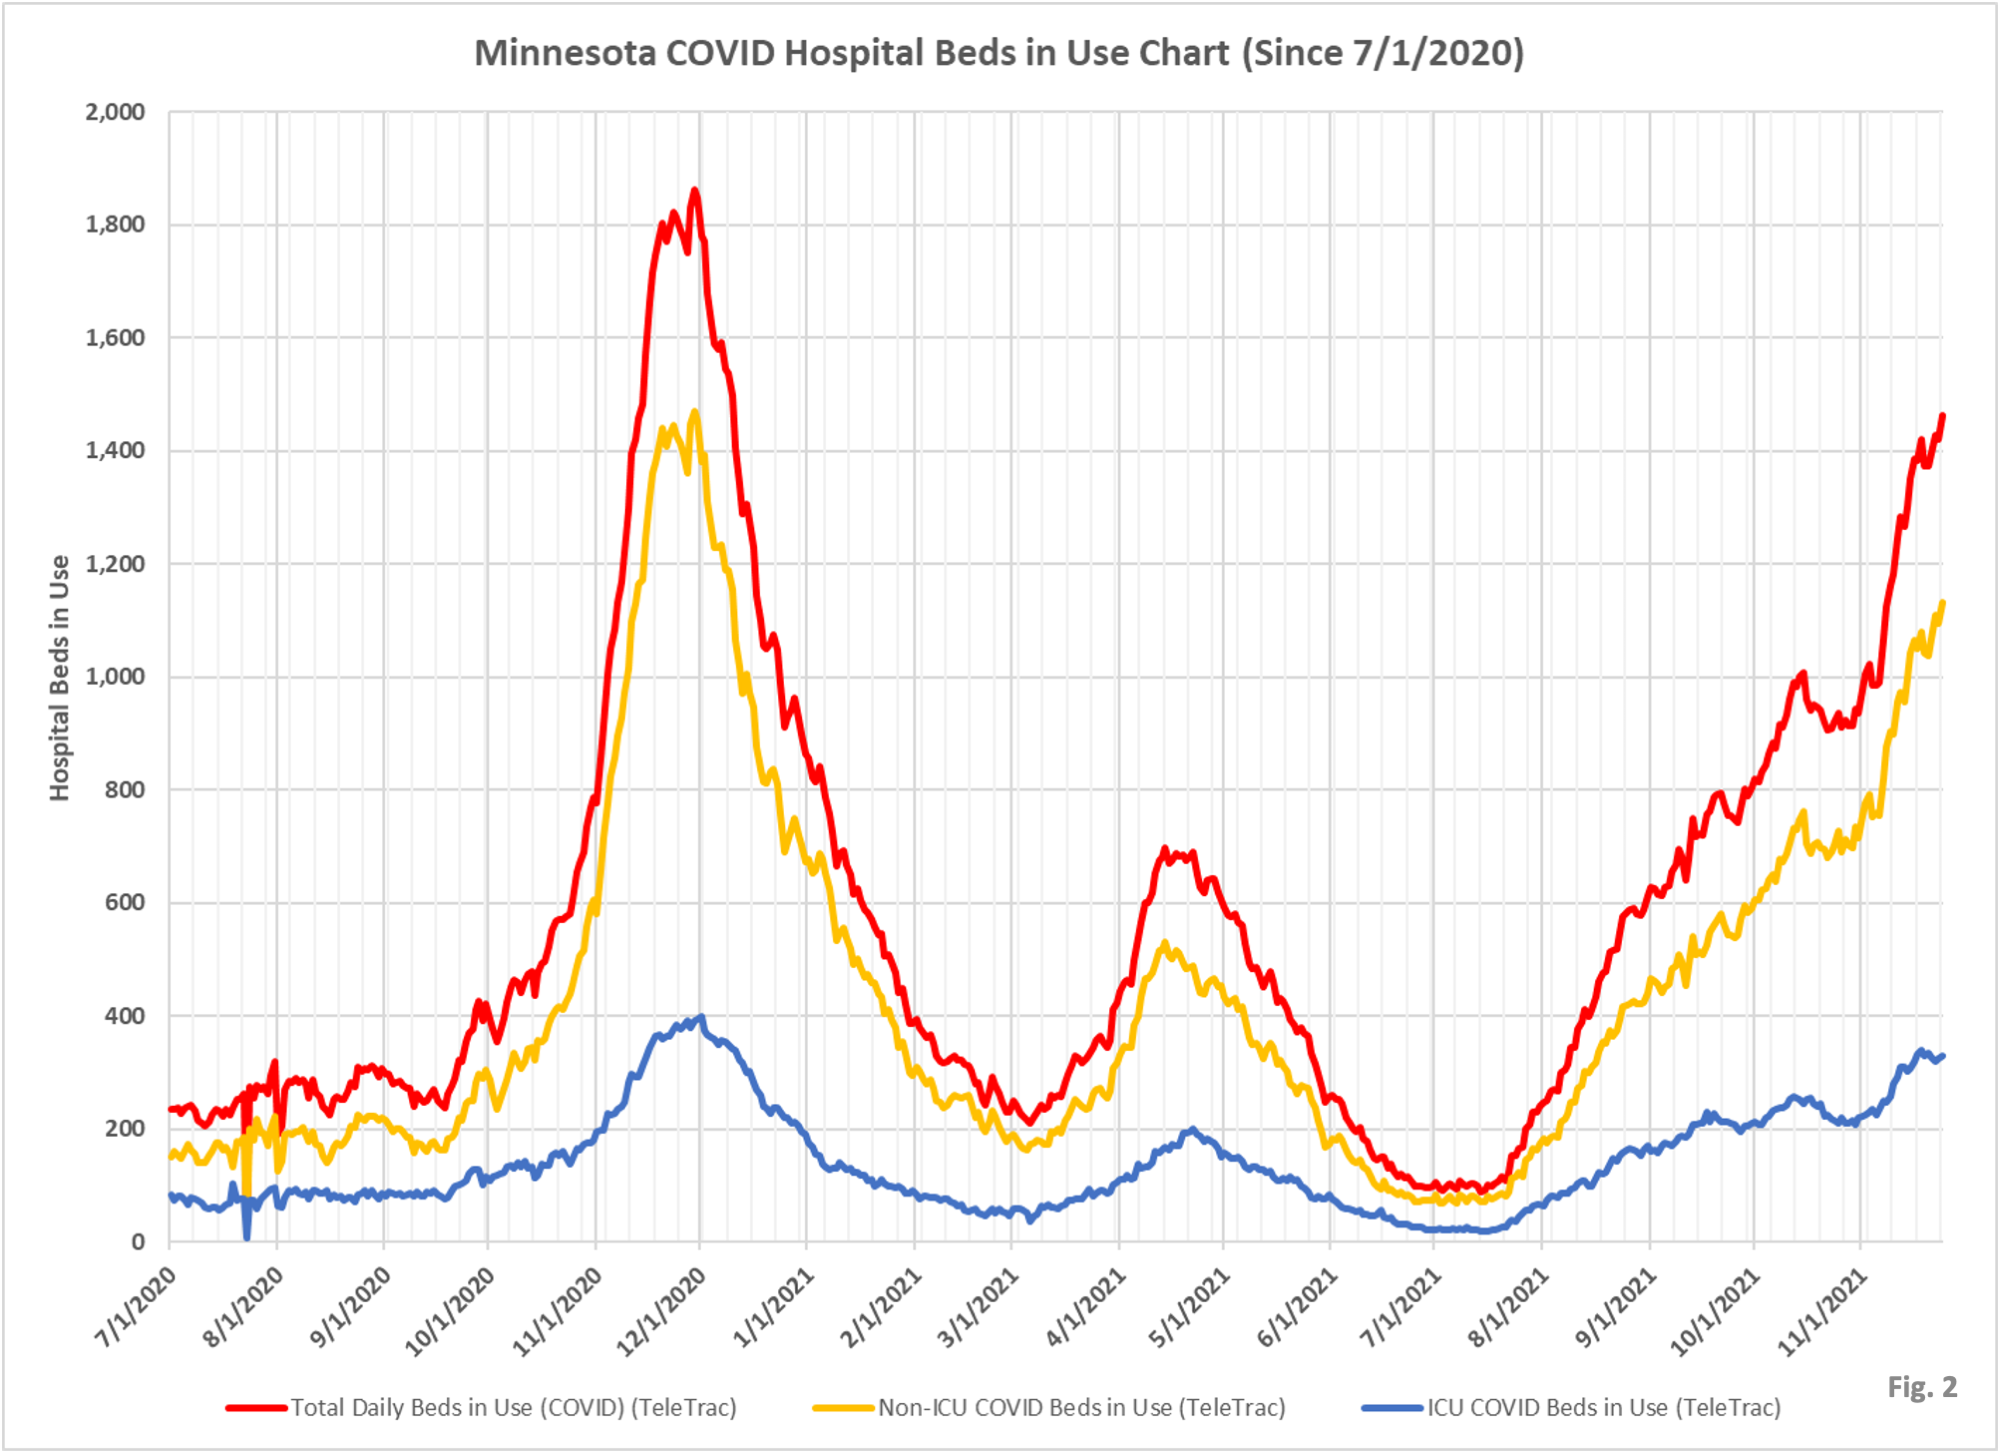
4. Figure 2, Minnesota COVID Hospital Beds is Use, also is a simple plot of data from the TeleTracking data file. We can see that after pausing in mid-October, the rate of increase of hospital beds in use rose dramatically. In the past week the rate of increase has slowed again, but beds in use for Covid patients are still rising and approaching the magnitude of the late 2021 peak.
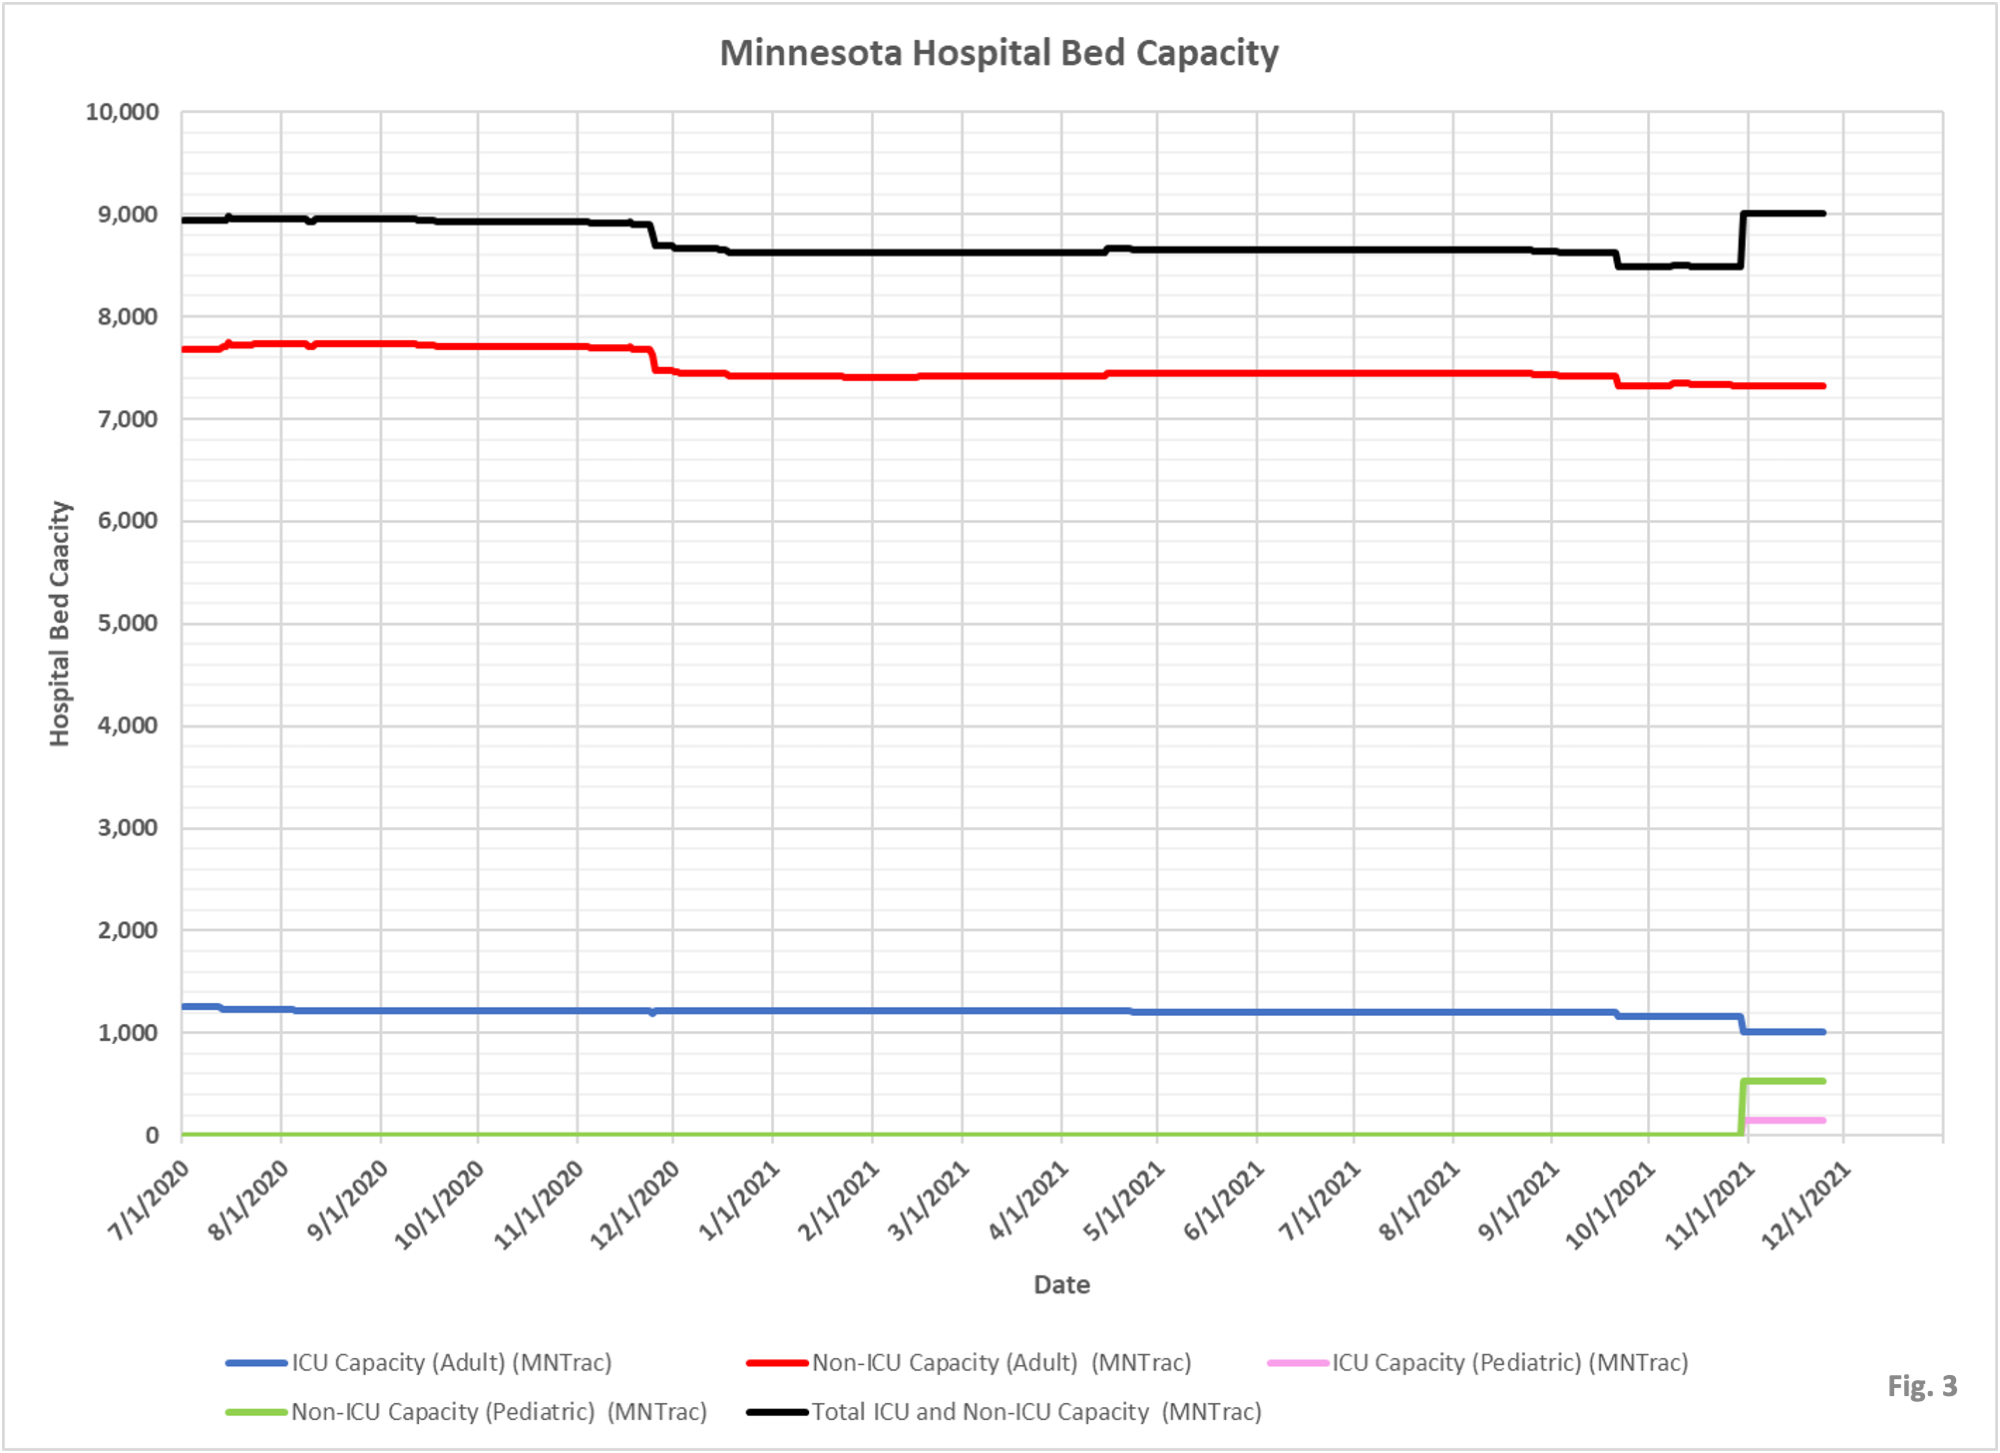
5. Figure 3, Minnesota Hospital Bed Capacity, is a chart we have not published here before. It presents the data in the MNTRAC data file without modification. We can see the new data for Non-ICU pediatric beds (green curve) starting on 11/18. The ICU pediatric beds (pink curve) also started being reported on 11/18, but were previously included in the ICU adult bed totals (blue curve) which is decreased by the same amount as the added pediatric ICU beds. Total bed capacity (black curve) increased on 11/18 due to the reporting of pediatric Non-ICU beds.
It is unknown how accurate and timely the bed capacity information is. This chart is where reductions in hospital staffing should show up, if staff reductions occur and if they are reported.
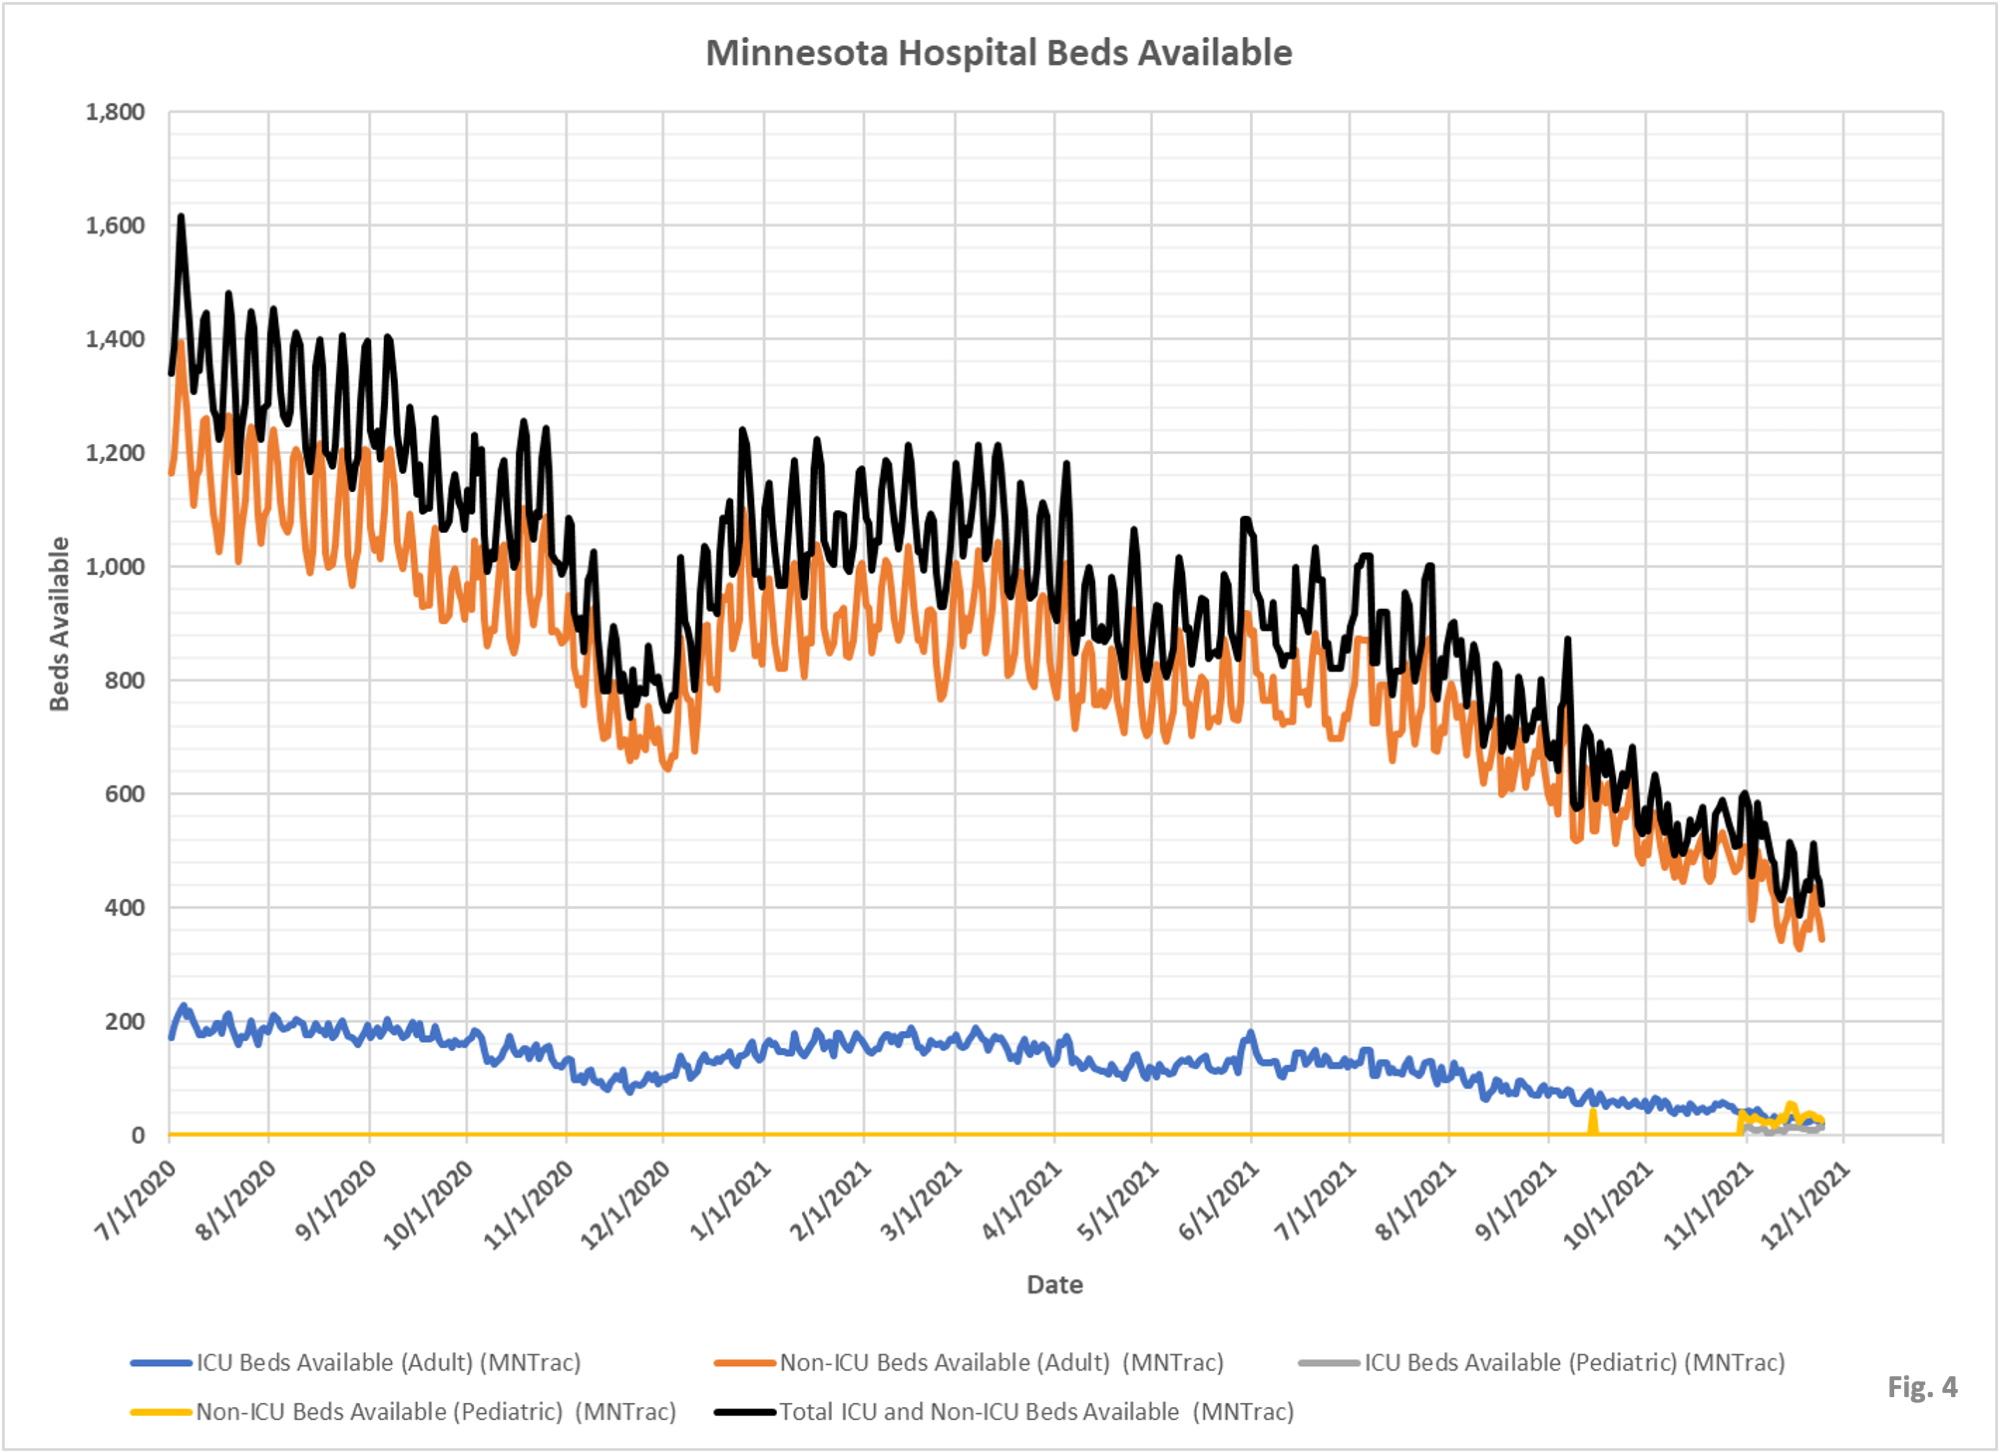
6. Figure 4, Minnesota Hospital Beds Available, is also a new chart that we have not published before. It presents the available beds reported in the MNTRAC data file, without modification. As of 11/24, MNTRAC reports that 13 pediatric and 22 adult ICU beds are available statewide in Minnesota. It also reports that 26 pediatric and 346 adult Non-ICU beds are available statewide, for a total bed availability of 407. Note that the availability of beds found from the TeleTracking data file in Note 3 above was 1,239 beds, a significant discrepancy. It is not obvious from the available data which availability number is right.