The supposed experts in our state government don’t appear to have a clue about the epidemic. They are desperately flailing around still clinging to the vaccine life preserver attached to a 400 pound weight. Now they think, well maybe if we get children vaxed, that will do the trick. Right. So they are busy telling every lie they can about how dangerous CV-19 is to children. Shameless perverts who enjoy child abuse and torturing parents. The age series charts clearly show no change in number of hospitalizations. DOH is sending letters to school districts and boards trying to bully them into forcing vaccinations on children. In the letter they repeat this lie about 1 in a 100 children being hospitalized after infection. They are missing a shitload of infections and a very large percentage of hospitalizations have been shown in the research to have nothing to do with treatment for CV-19. DOH knows this, one of my data requests they won’t answer is about how many children were actually hospitalized with something else and just happened to have a positive test sometime in the last century.
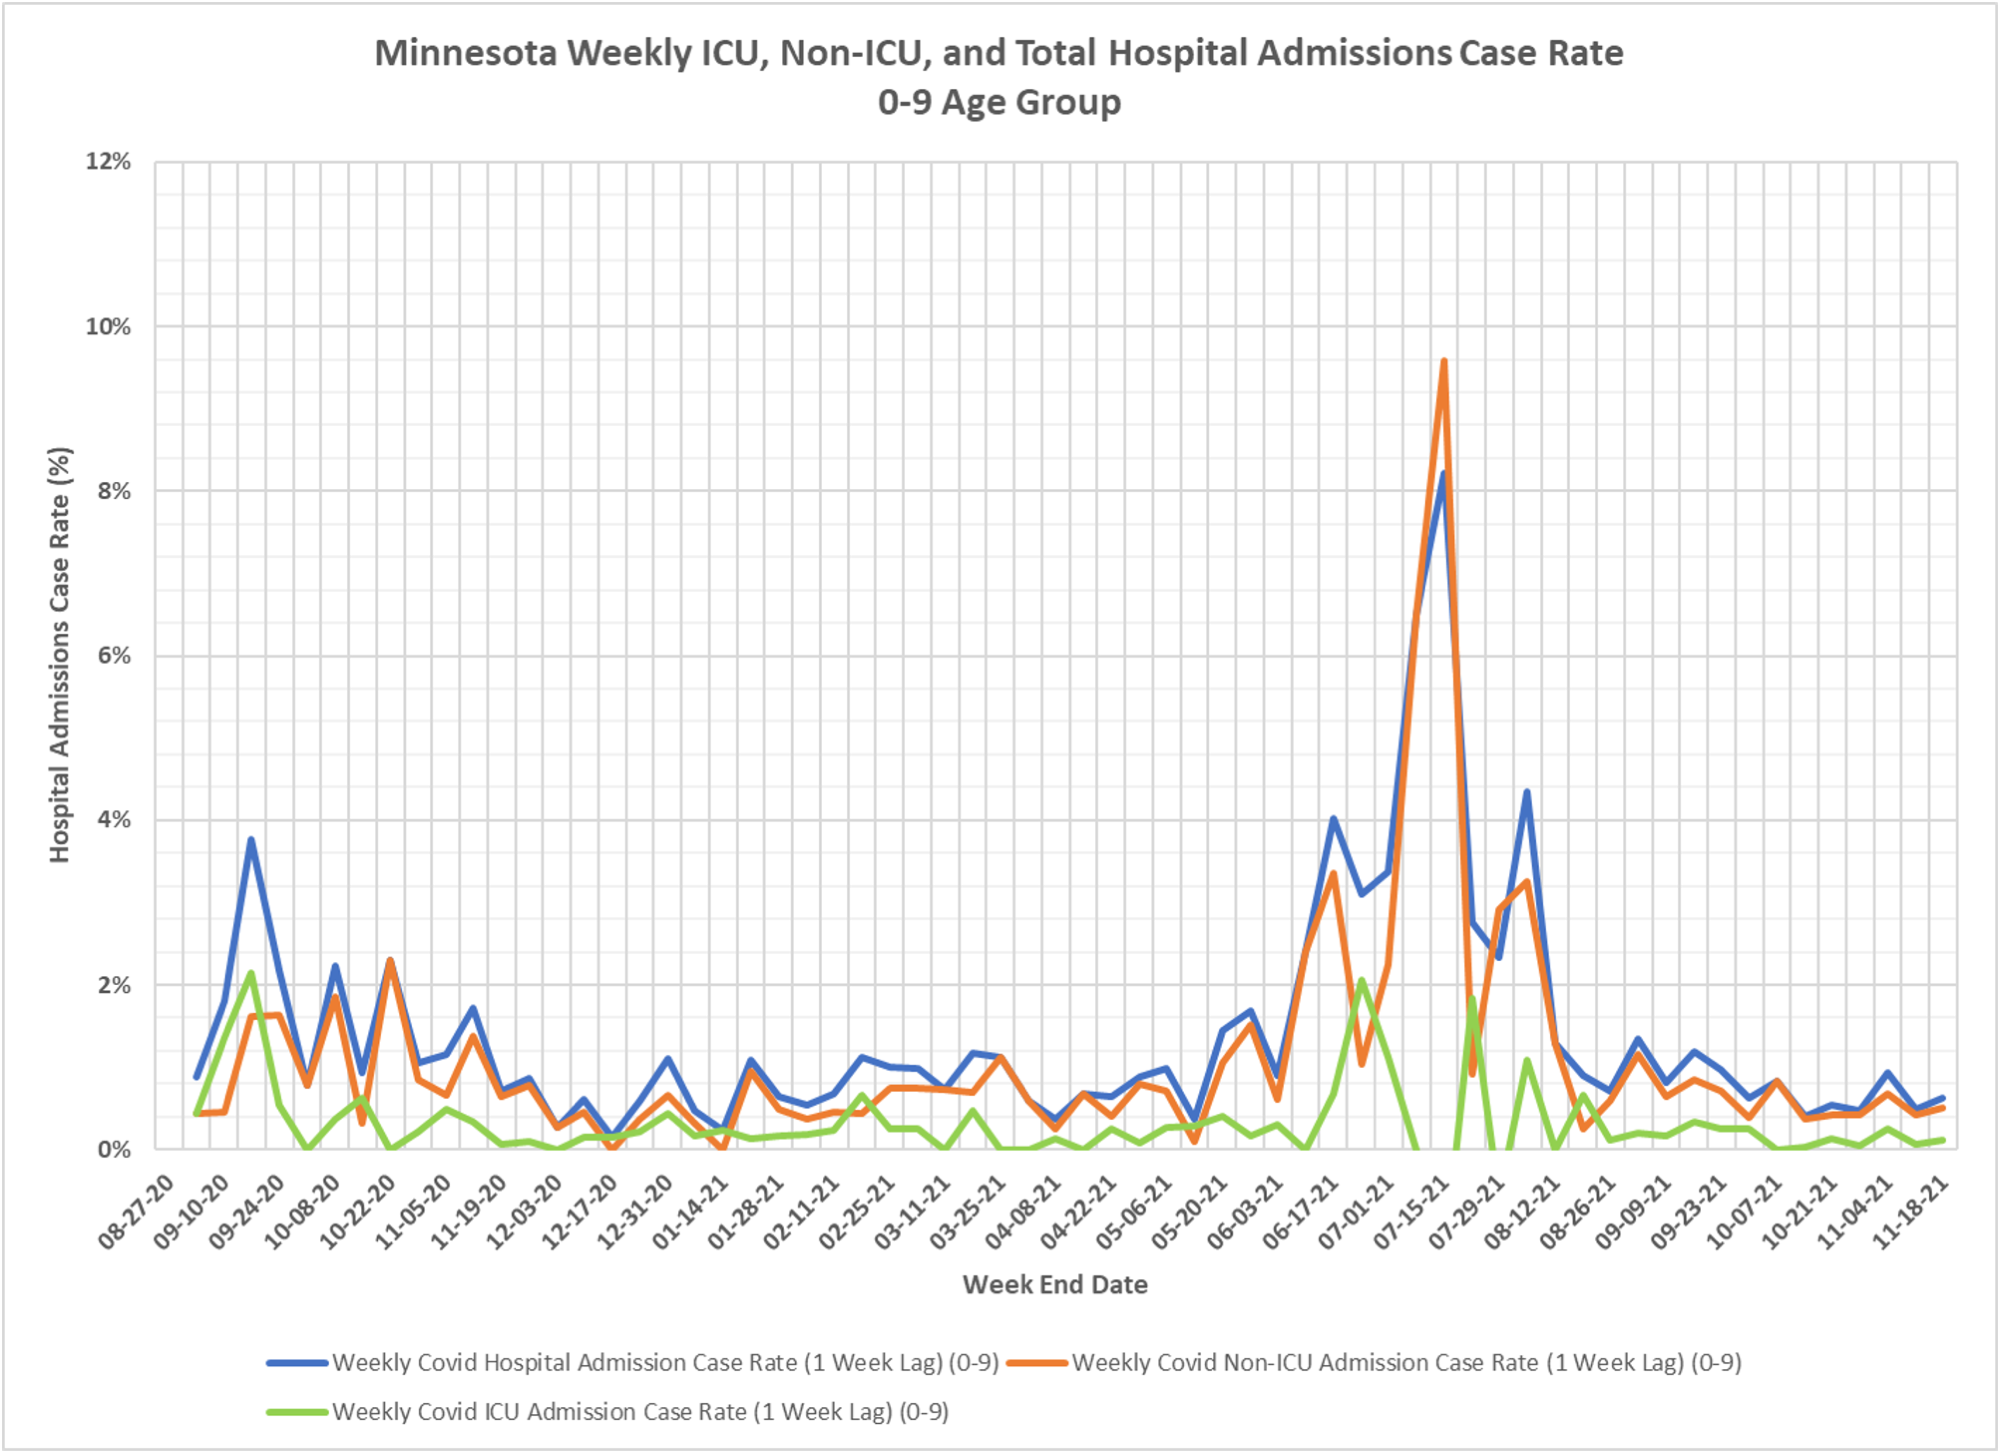
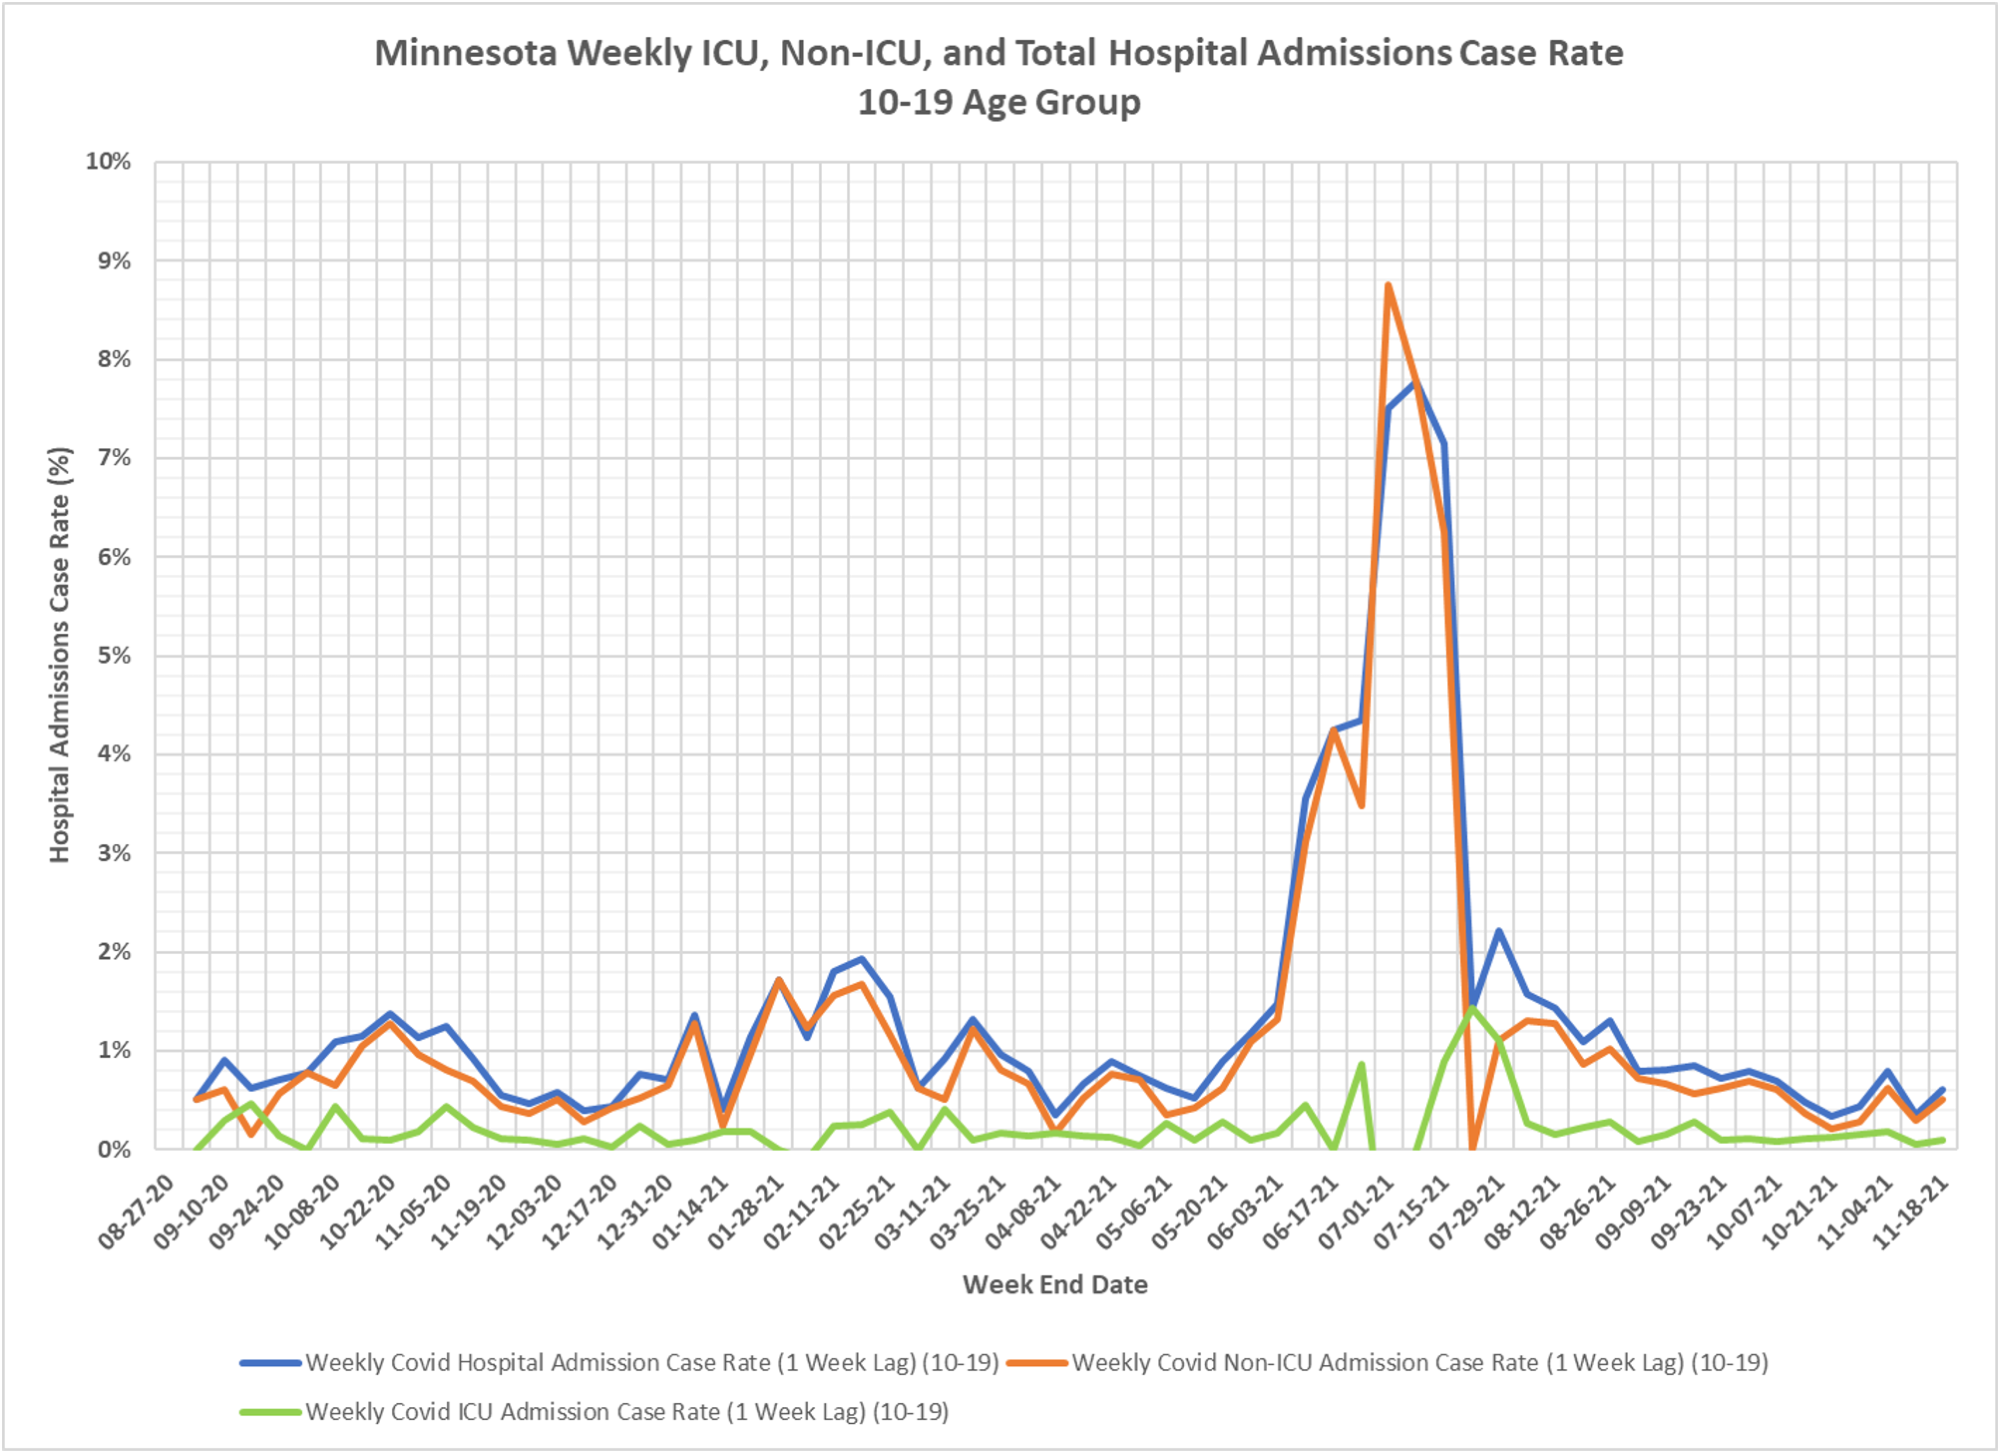
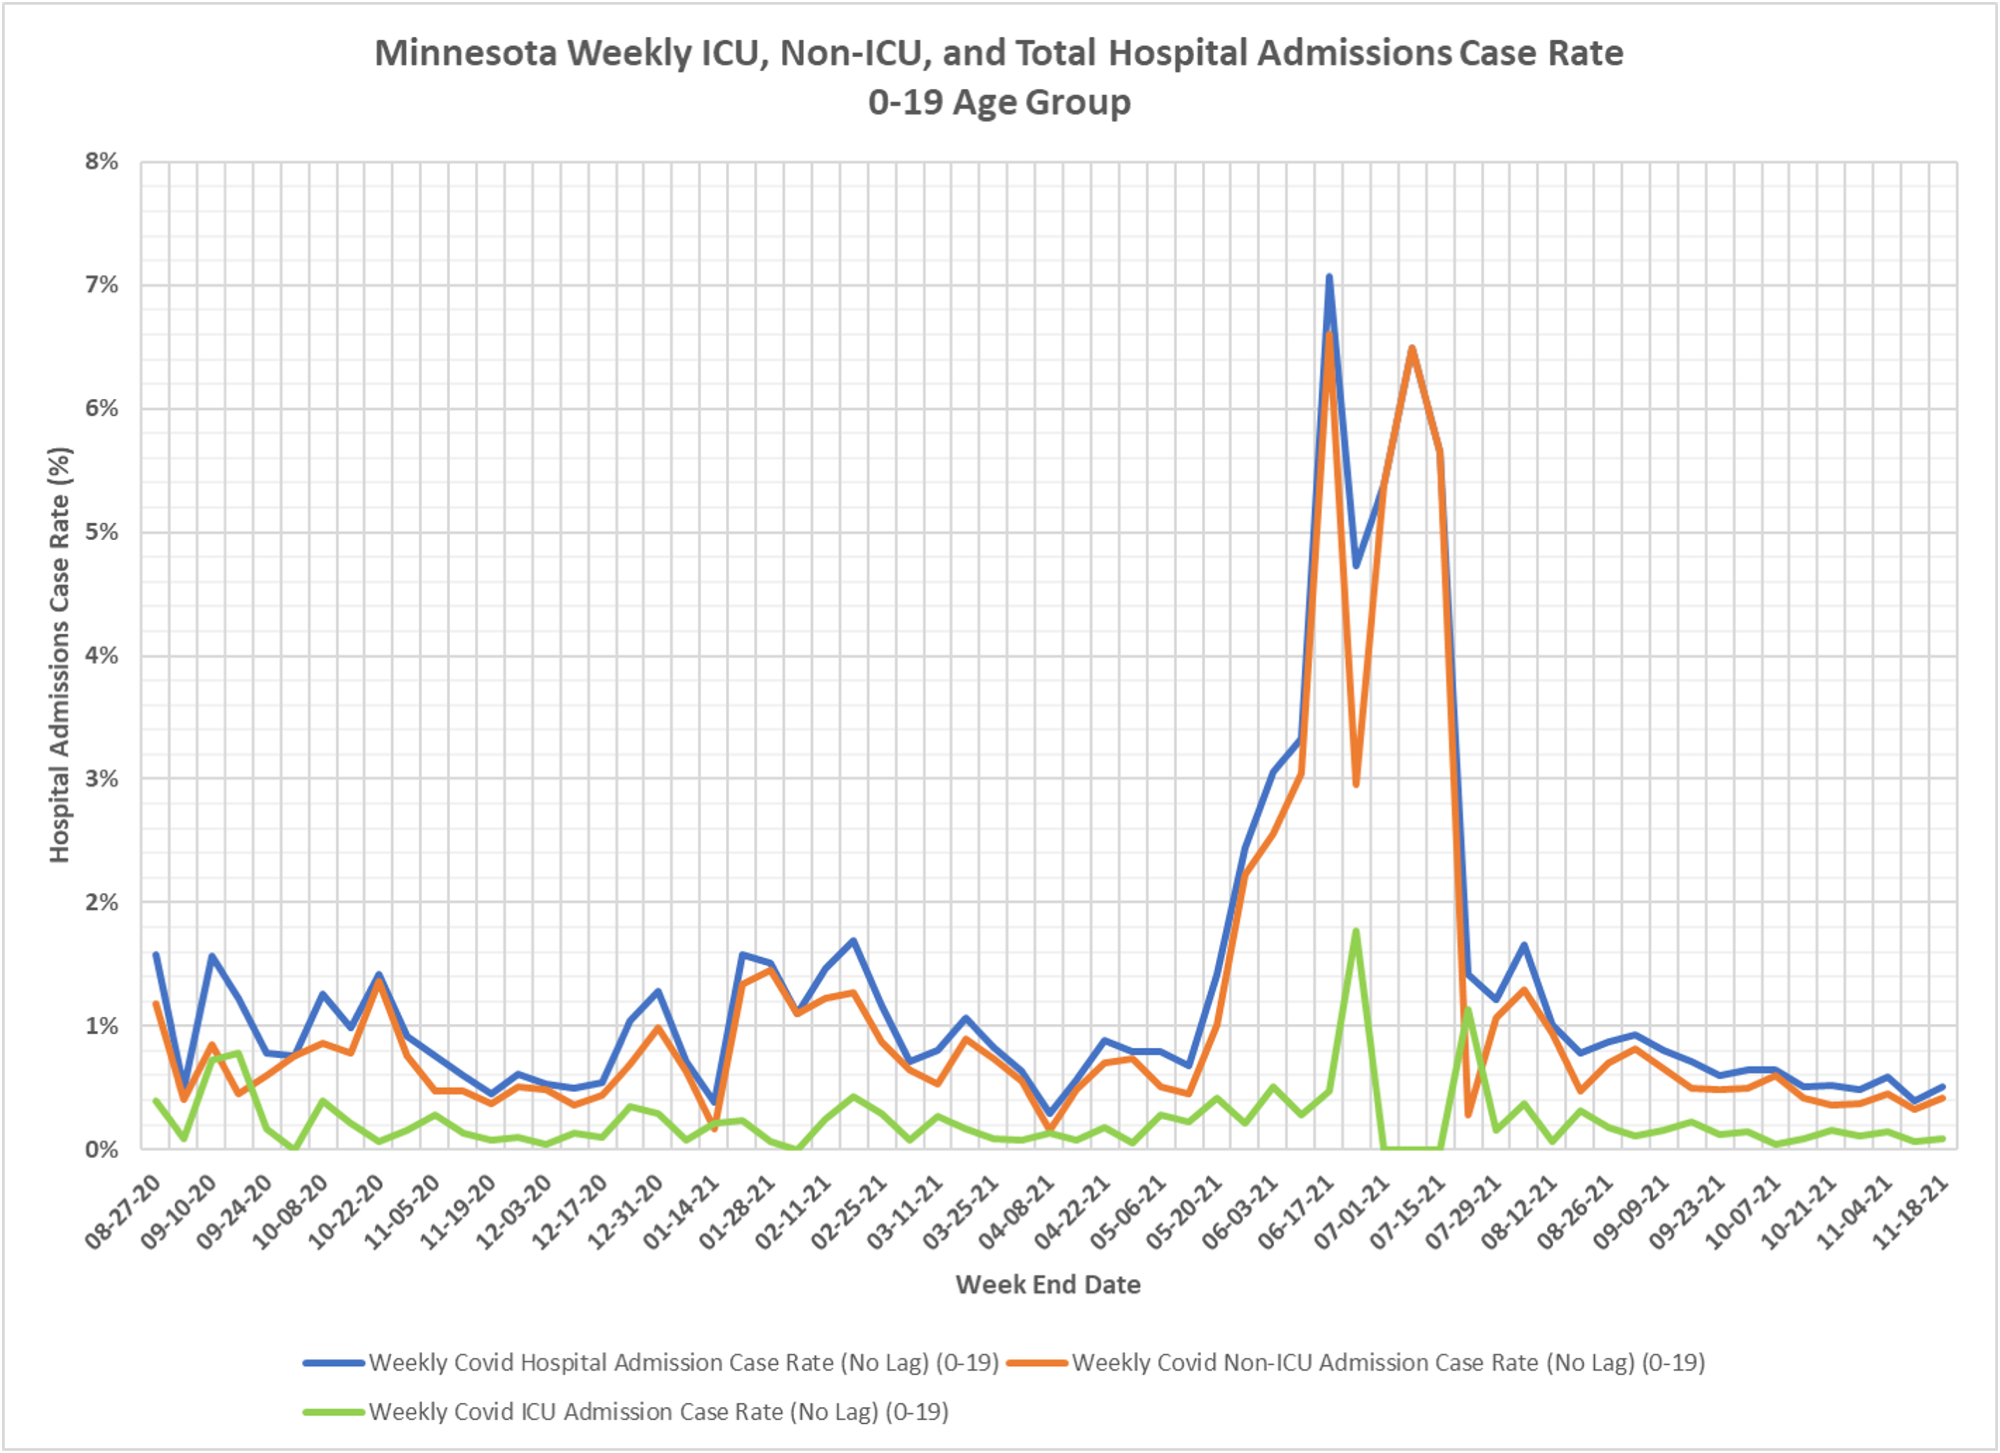
Now look at this chart of hospitalization rates in the child age groups. This is basically hospitalizations as a percent of cases. Read Dave’s notes as well, because once again you see how bad the Minnesota data is. As Dave says, one of the real stories here is how cases in children are totally dependent on testing levels. When school ended last spring, testing and cases dropped precipitously. But look at the case hospitalization rates over time. In the summer the case rate appears to soar, but there are actually no more hospitalizations. Just no crazy testing and finding false and low positives. Now look at the last few weeks, the rate is way back down where is was before, kids are back in school exposed to the inane testing regimen. But that summer spike has excessive weight in the overall case rate calculation. If cases were at the same level in the summer as they are during school, the rate for the entire epidemic would be at that roughly four-tenths of a percent level.
But here is the real rate. CDC says at least 40% of kids have been infected. I think it is likely higher, but even at 40% we aren’t even detecting half the cases. Takes the hospitalization rate to two-tenths of a percent. Studies find maybe half of child hospitalizations attributed to CV-19 are actually for treatment. Takes the rate down to one-tenth of a percent. Maybe one child in a thousand is hospitalized, and unfortunately, most of those children have some serious co-morbidity. The odds of a healthy child ending up in the hospital because of CV-19 are miniscule. But 1 in 100 sounds a lot scarier that 1 in a 1000. And we definitely want to terrorize children and parents.
The only thing I am really surprised about is that DOH didn’t just use that summer period when they could claim that the hospitalization rate was way higher.
Dave’s notes:
1. In June and July the case rates spike up. This isn’t because admissions spiked, it is because admissions continued at a low, fairly continuous rate, but cases collapsed to very low levels.
2. There are also some data issues. When you see the ICU case rates go to zero in July, they are actually going negative. There are a couple weeks where cumulative admissions for some age groups for some weeks in July went negative. I fixed the bottom of the vertical axis at 0% otherwise it would have gone to negative 2%,