Every week, Dave Dixon does a tremendous job of pulling data from the Minnesota weekly report and other sources to compile a picture of how the epidemic is affecting various age groups. I am always looking for discontinuities or variable trends across age groups and these charts are the best way to spot that. Because the state’s primary message right now is to push for the probably unnecessary vaccination of young children, they lie a lot about cases and hospitalizations in that age group. You can see nothing different going on with either cases or hospitalizations, especially hospitalizations, which remain very stable at very low levels. At the other end of the age spectrum you see that hospitalizations and deaths have risen disporportionately among the very old. Dave’s notes below as well.
Note:
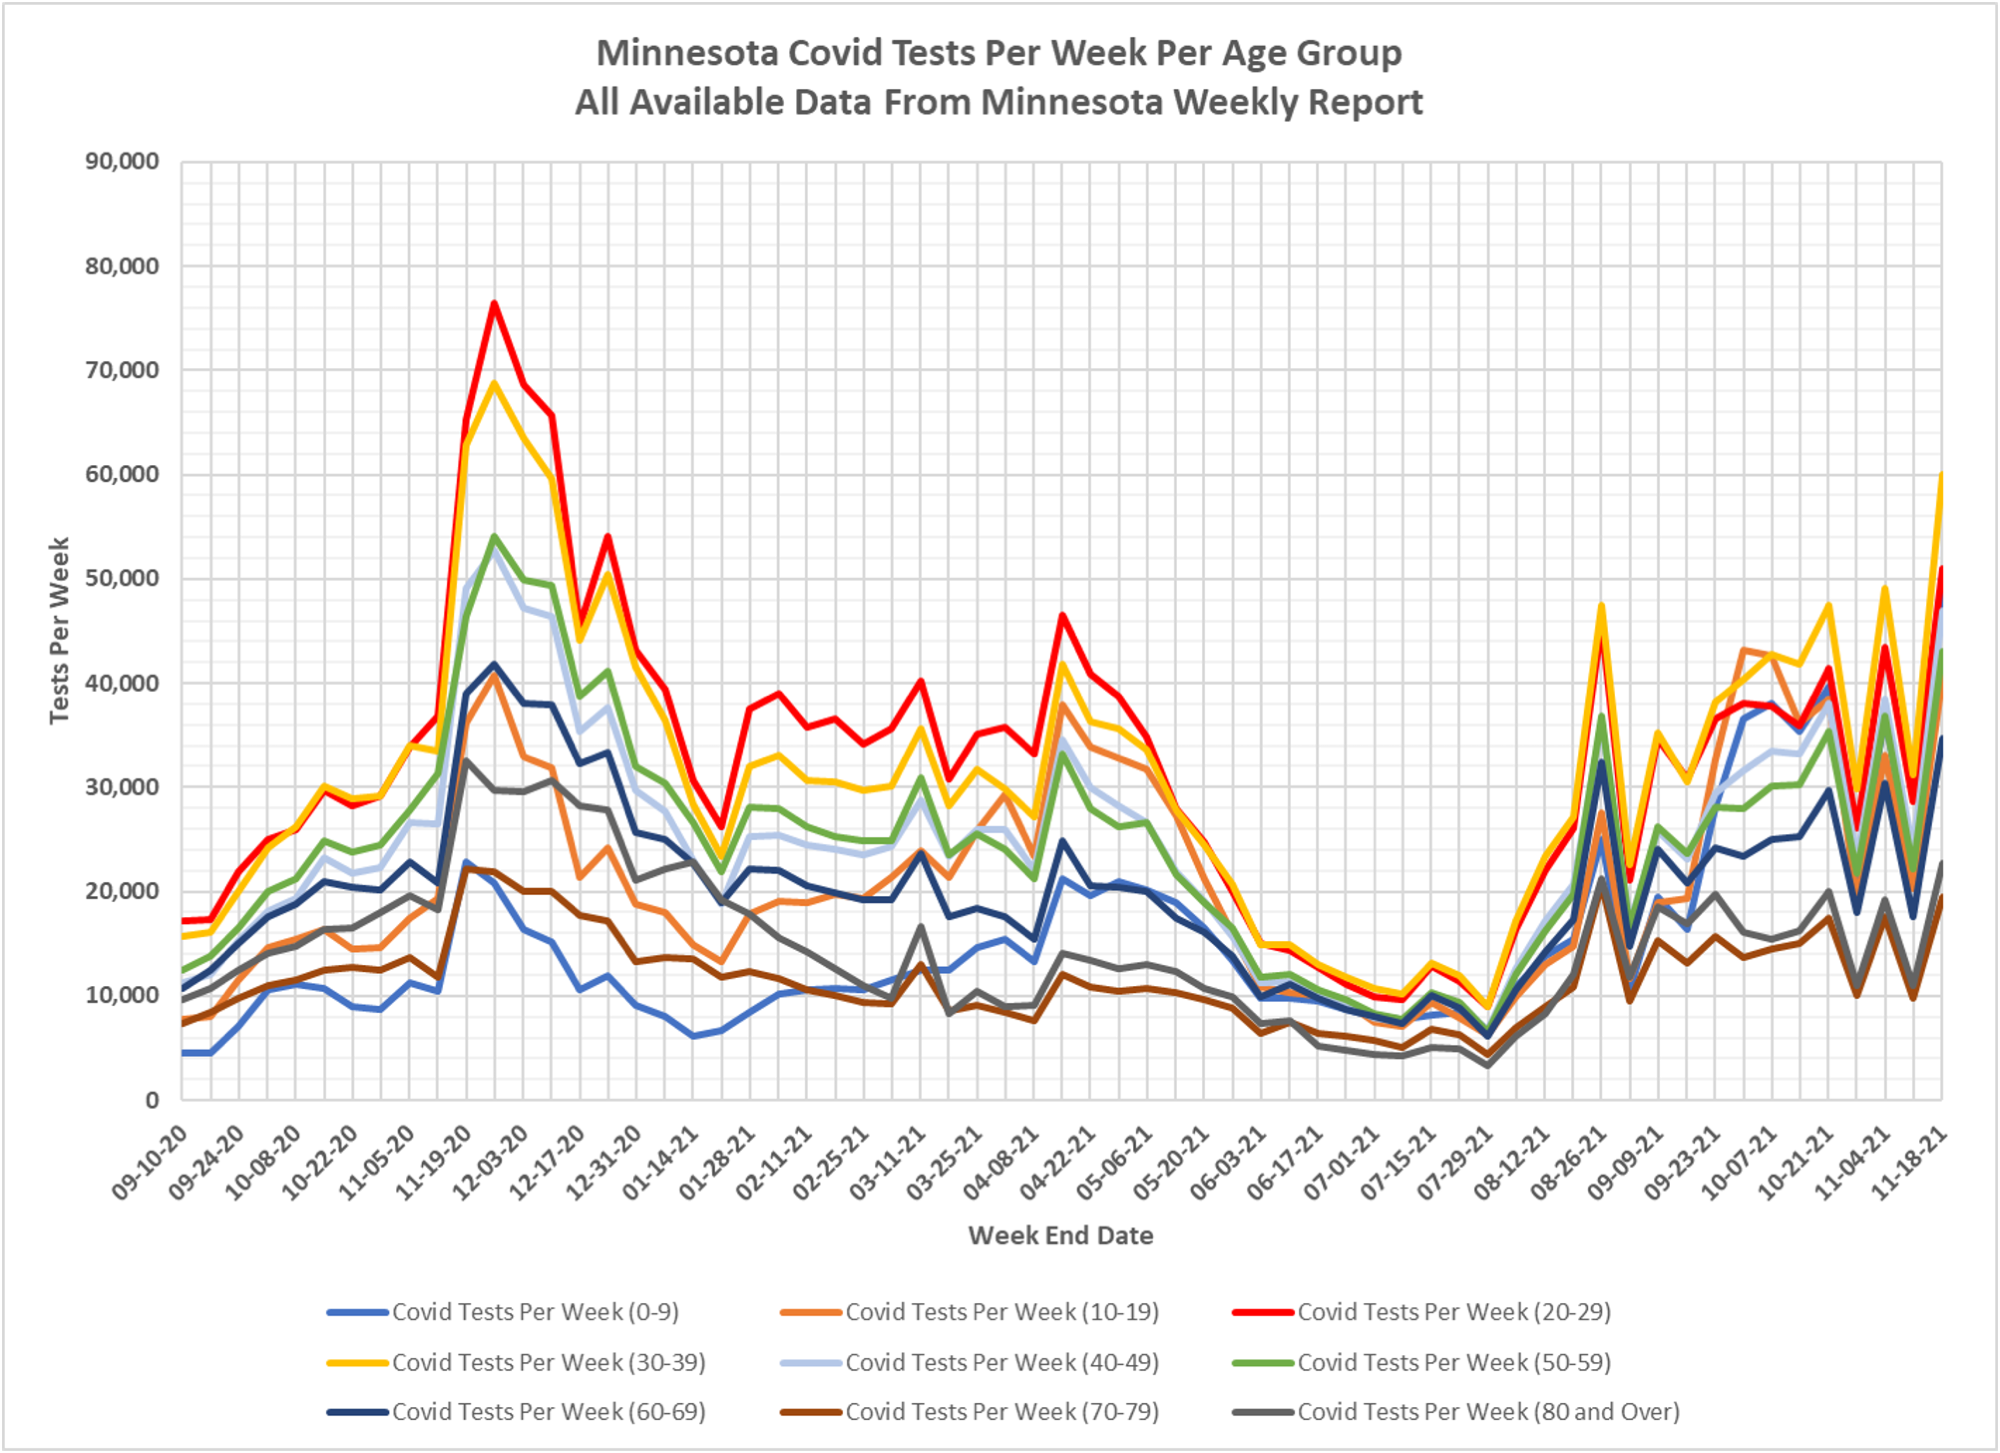
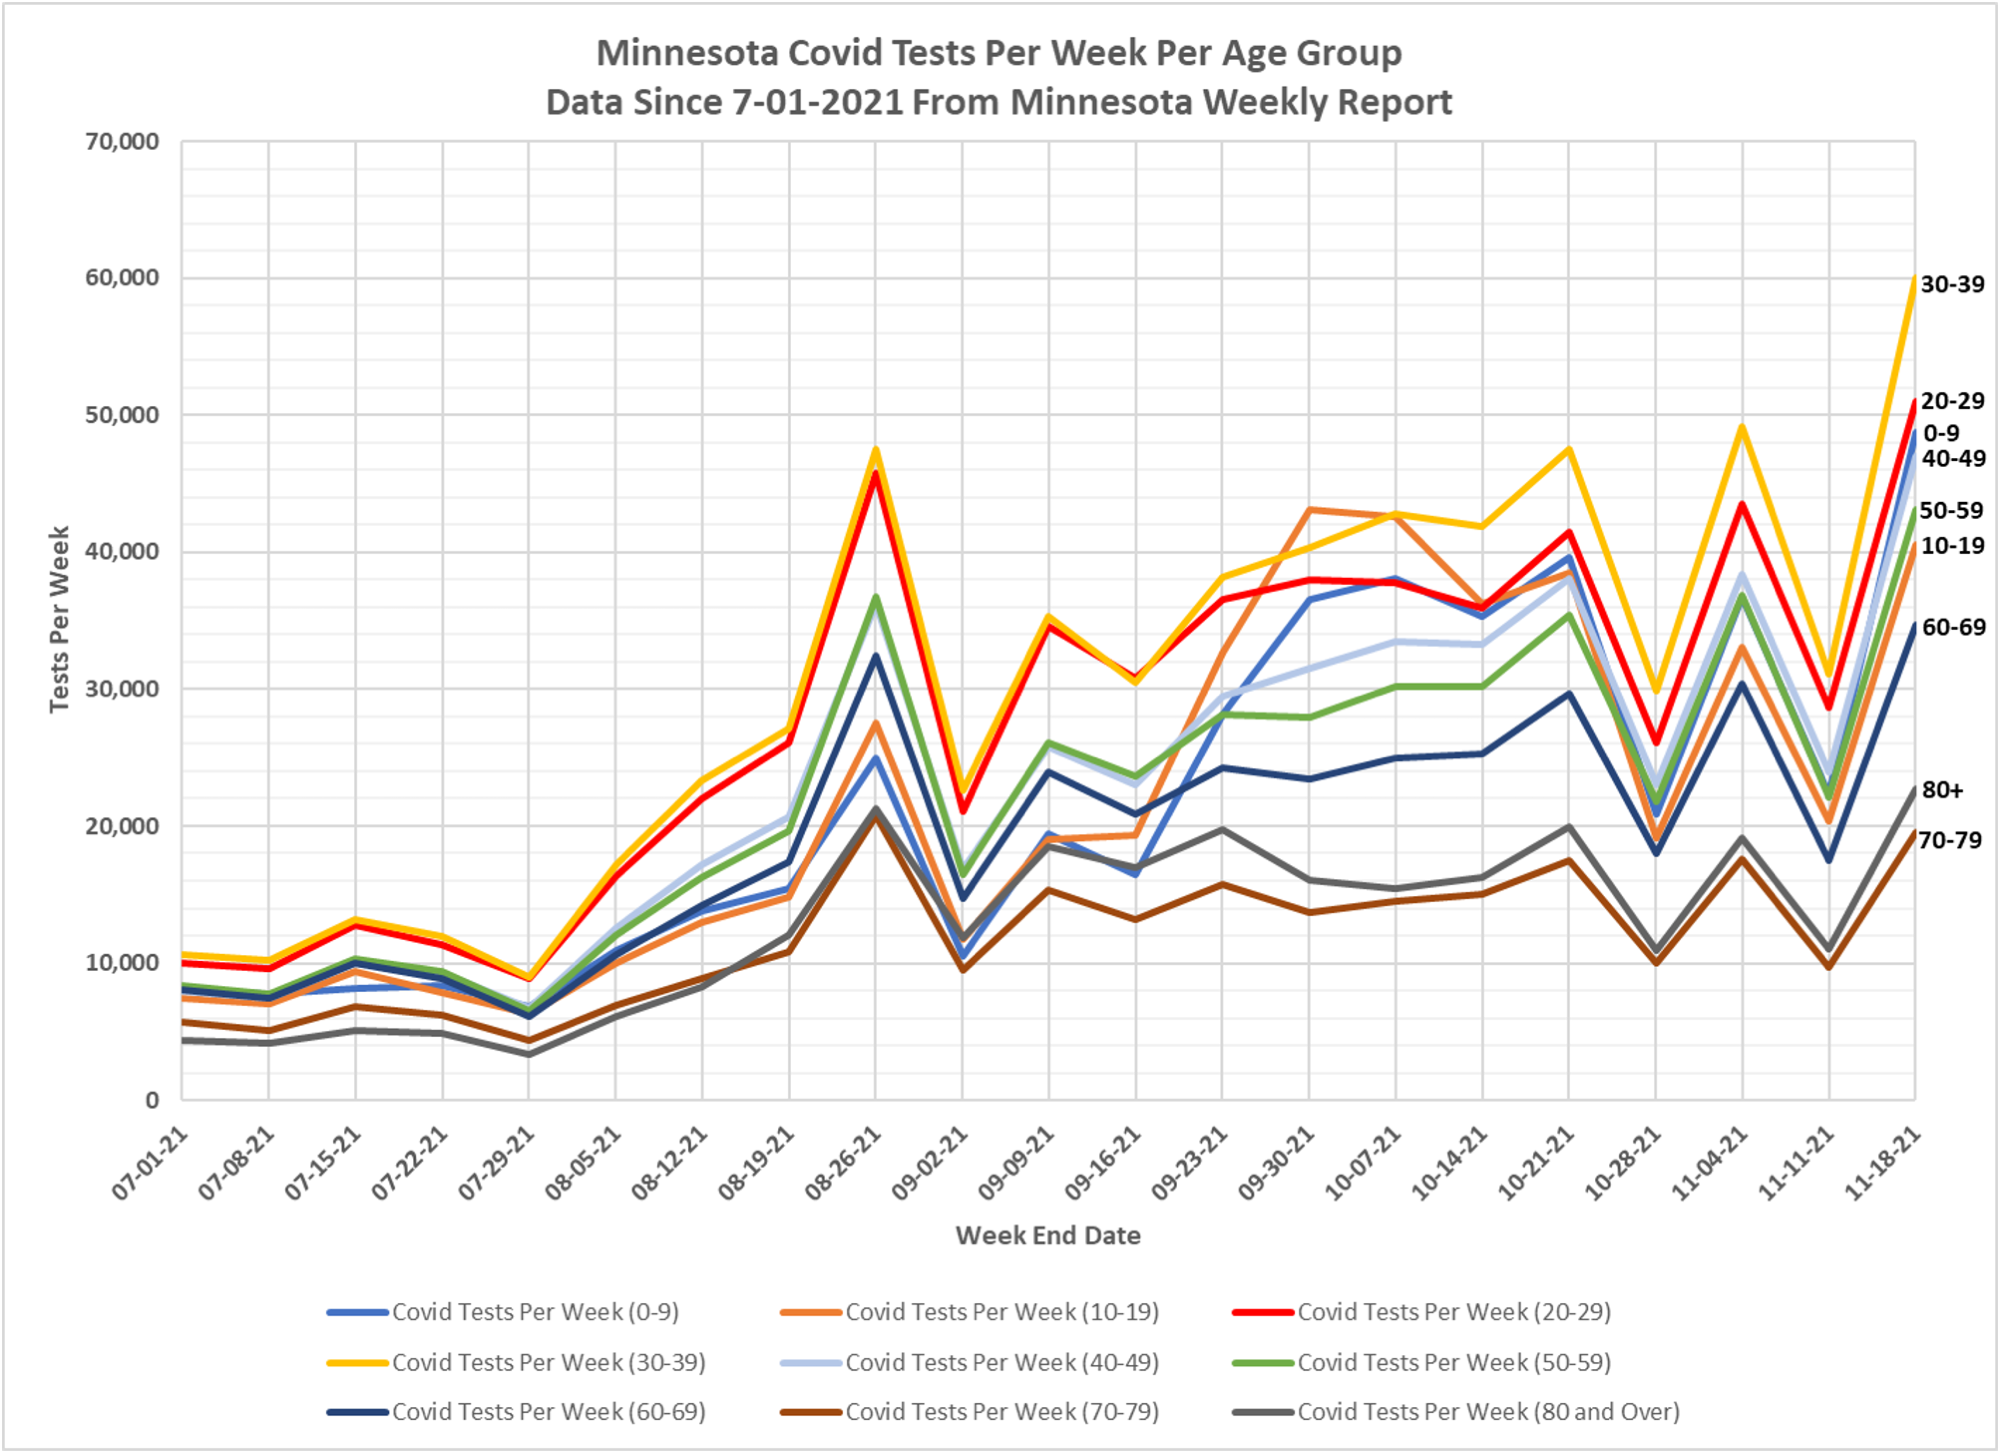
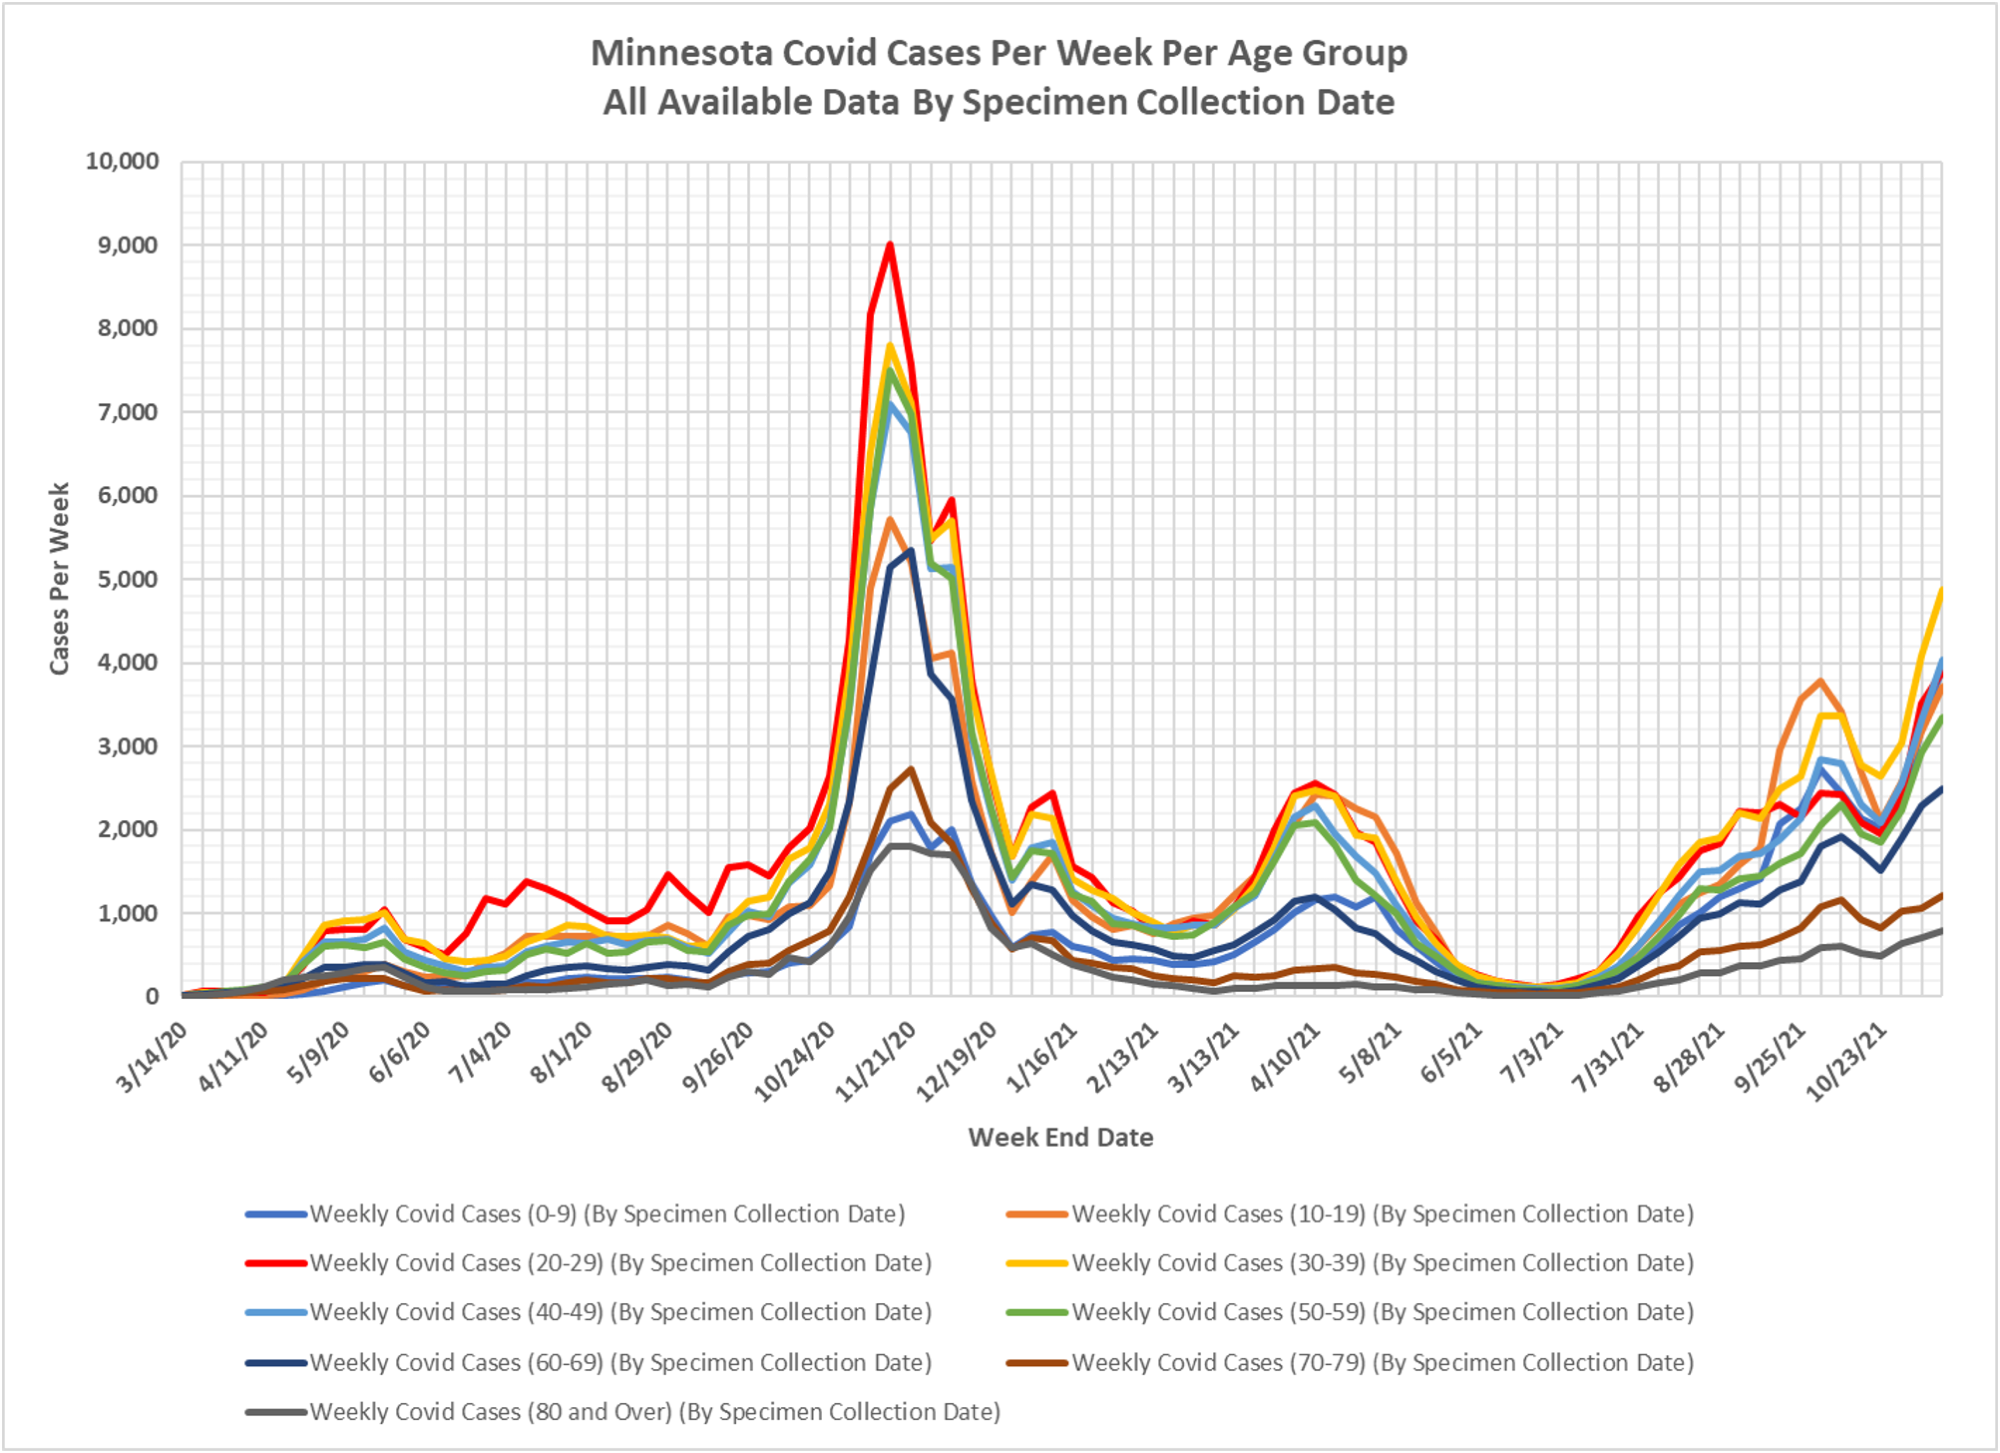
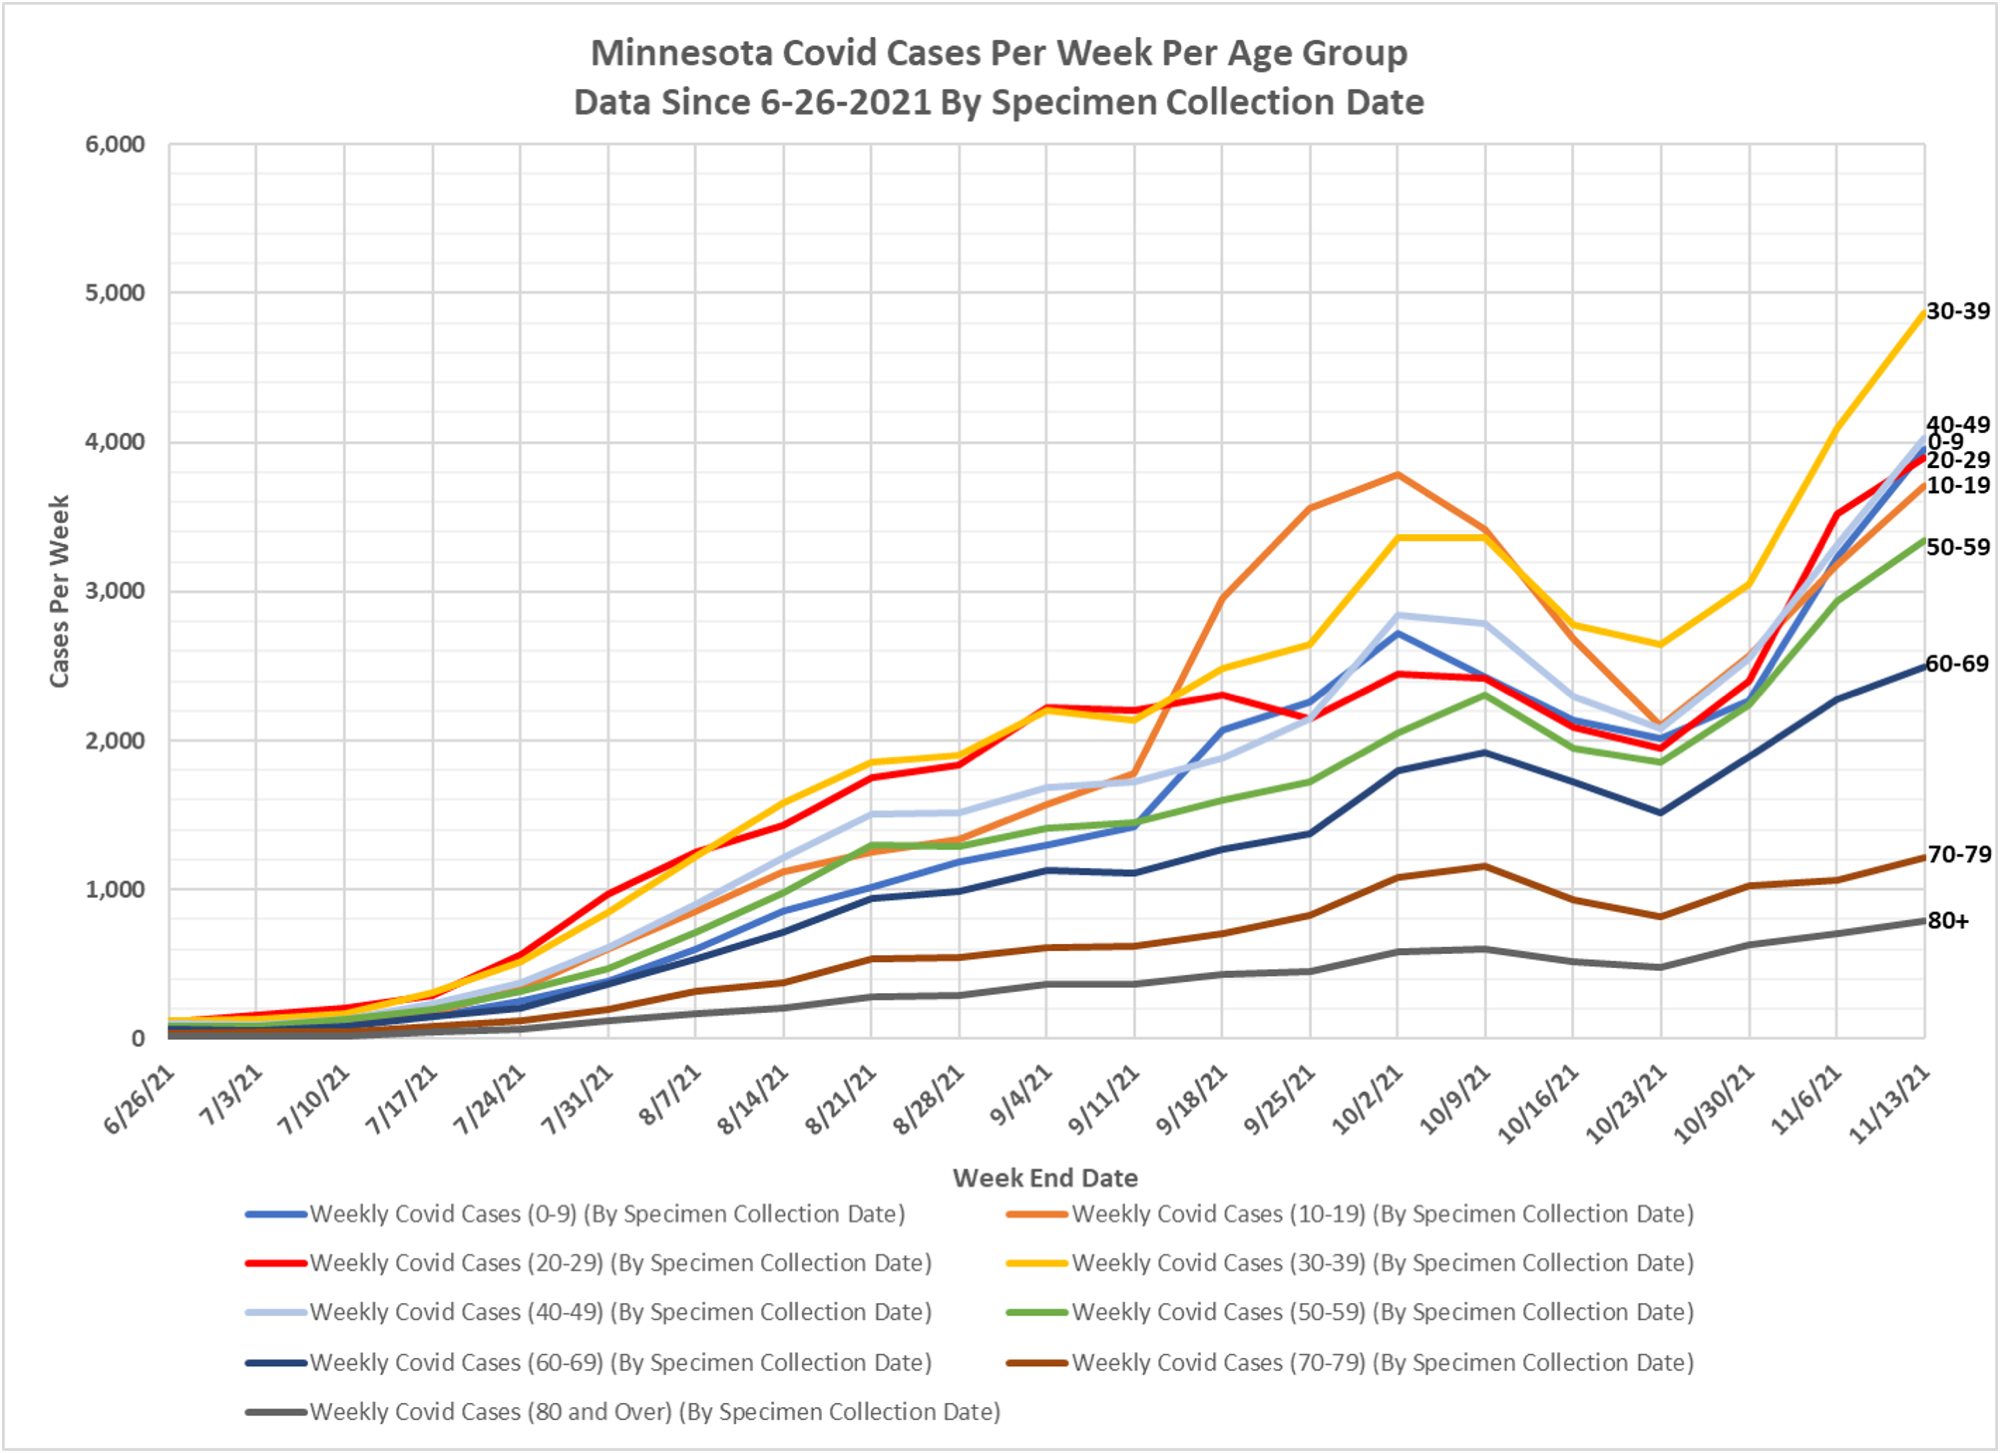
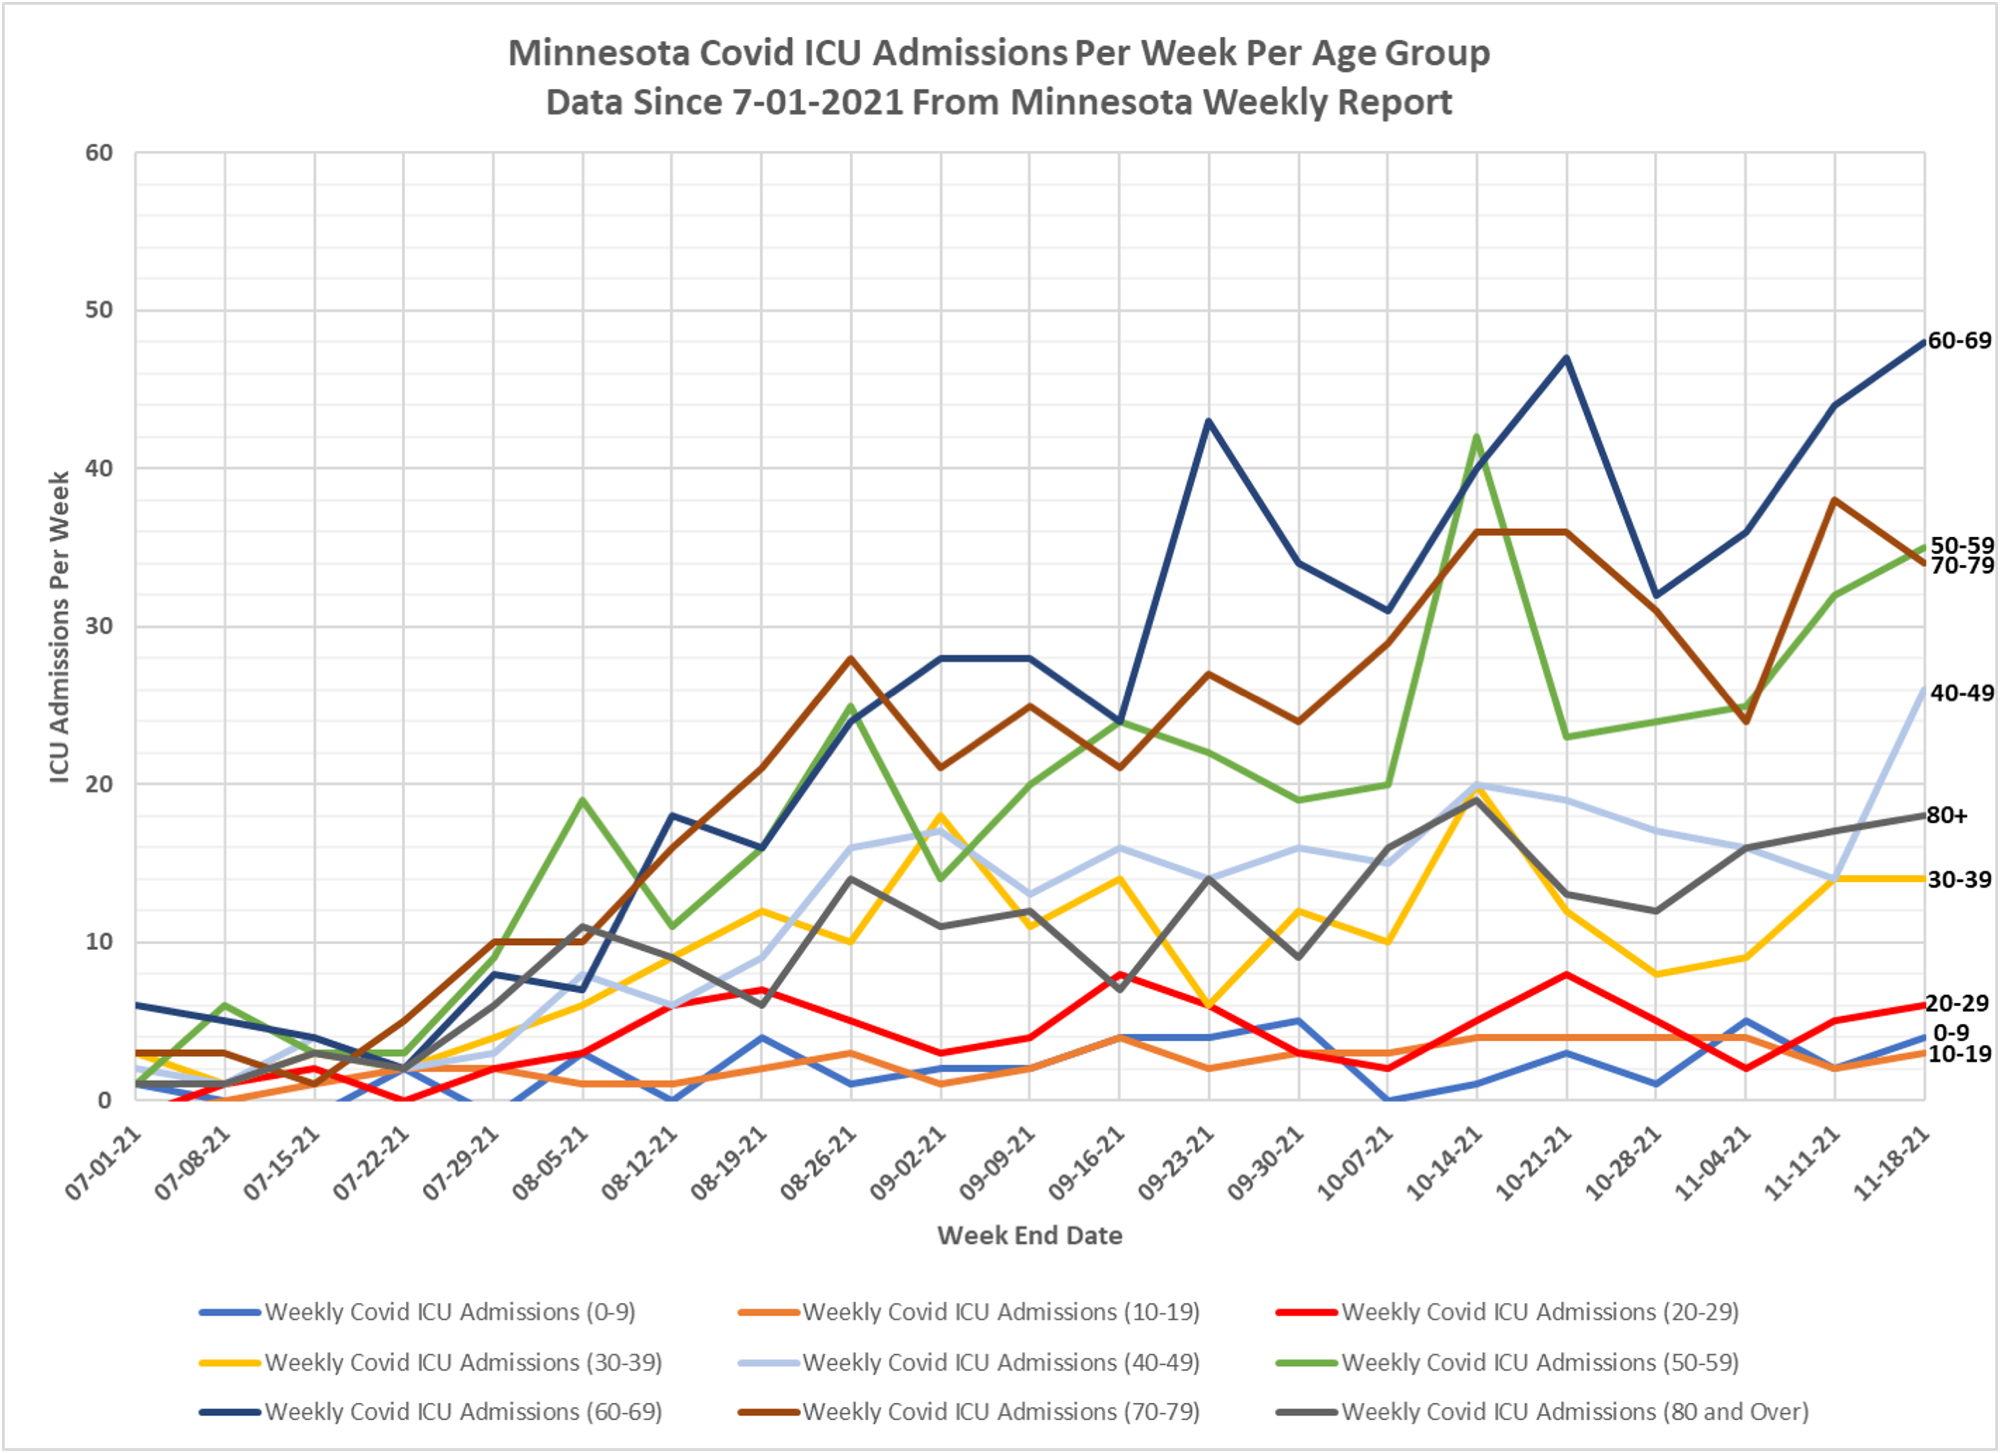
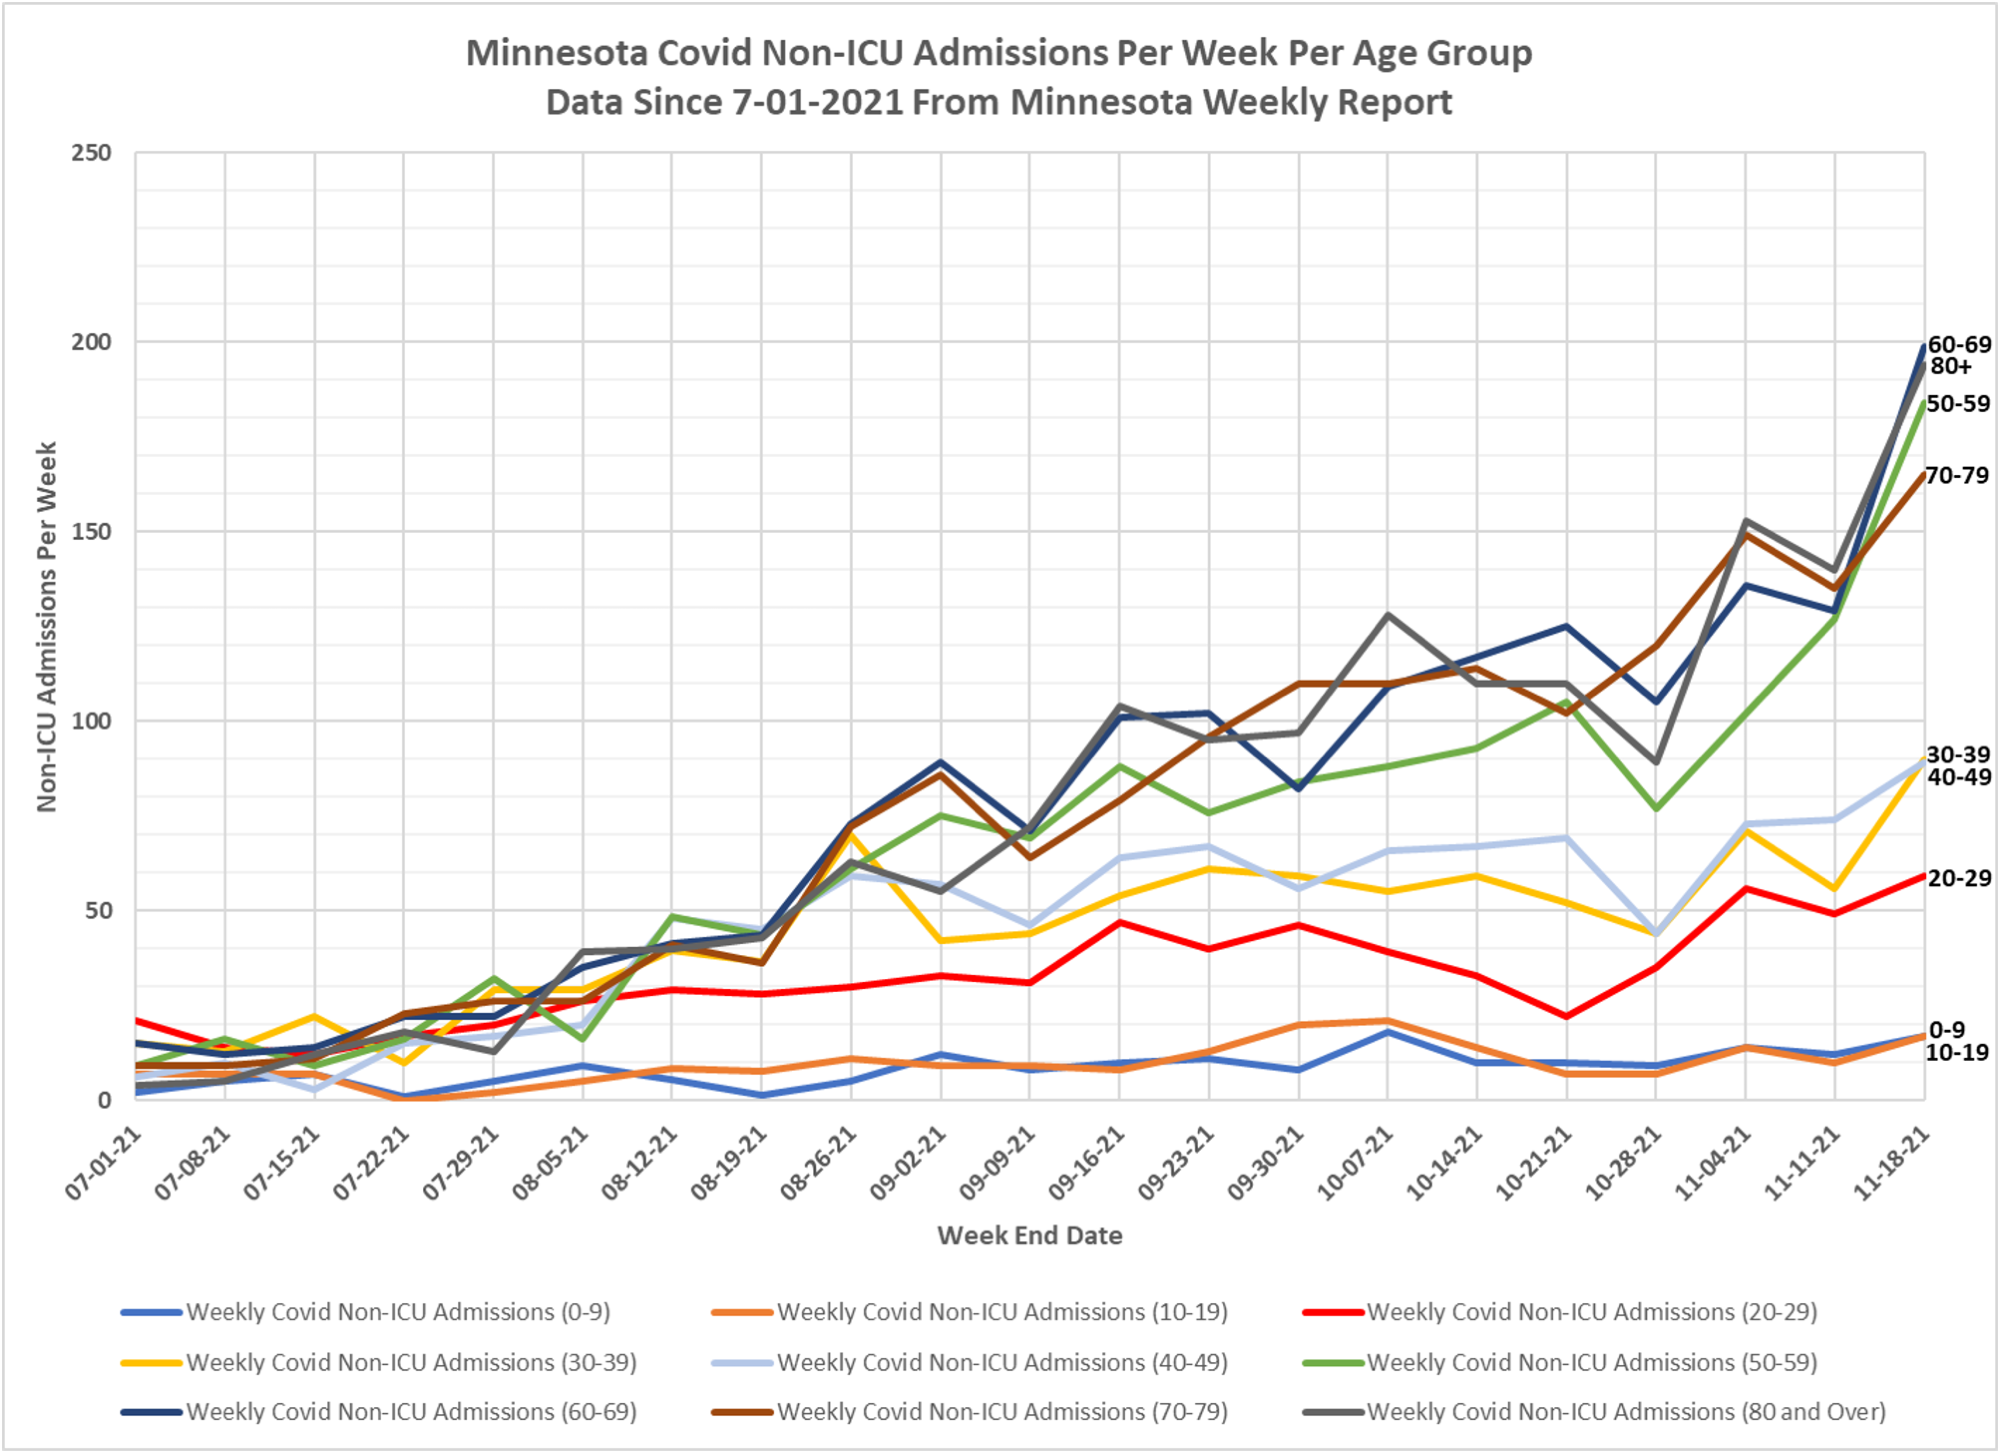
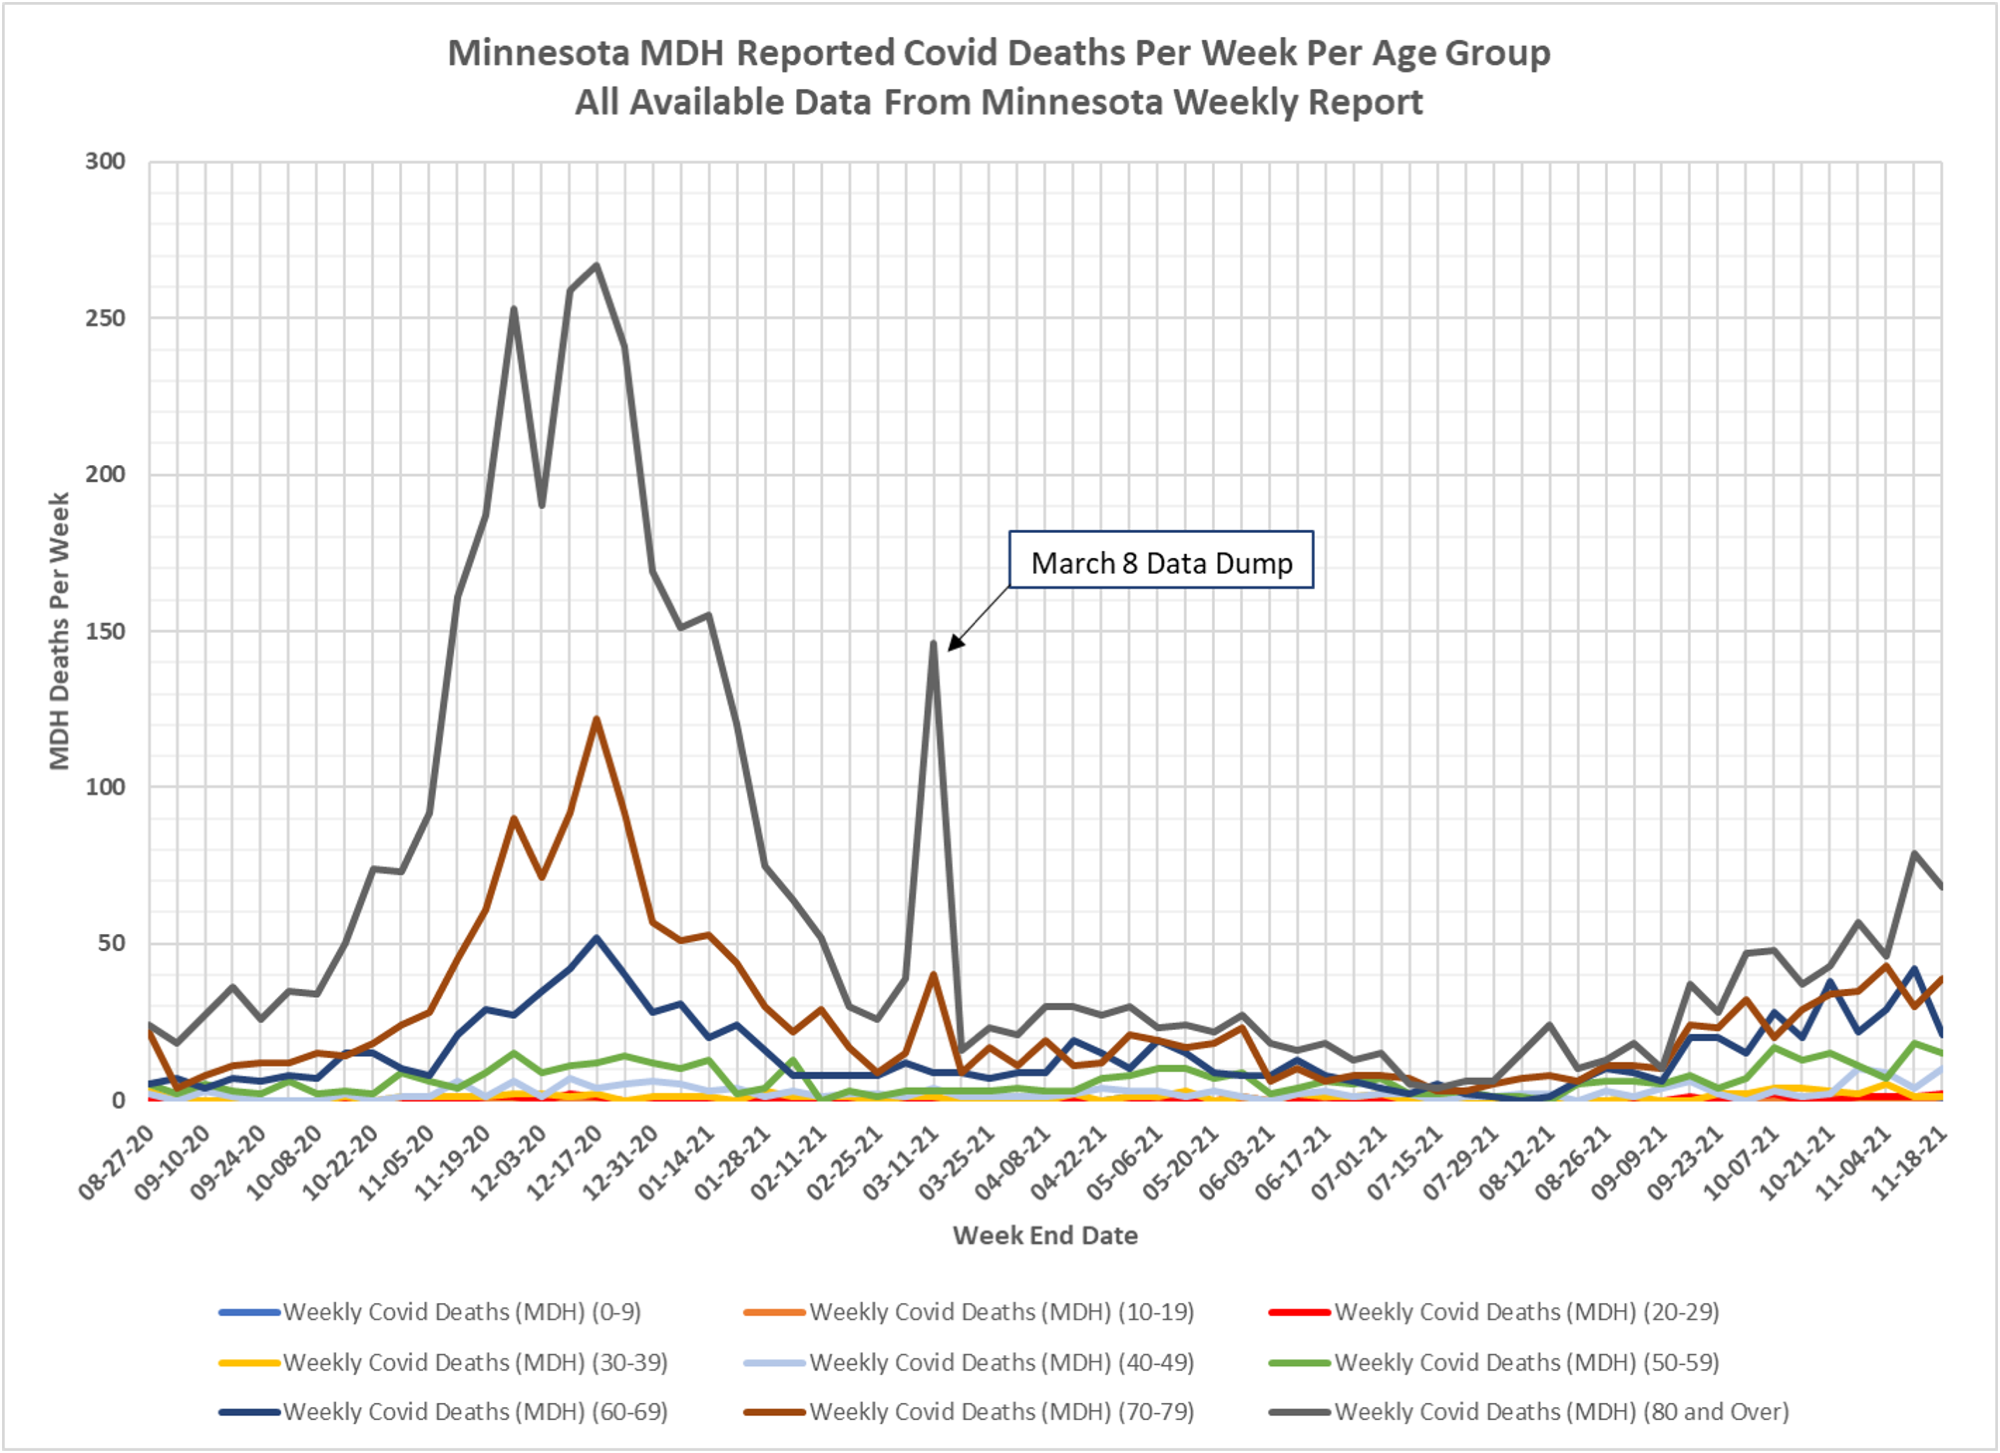
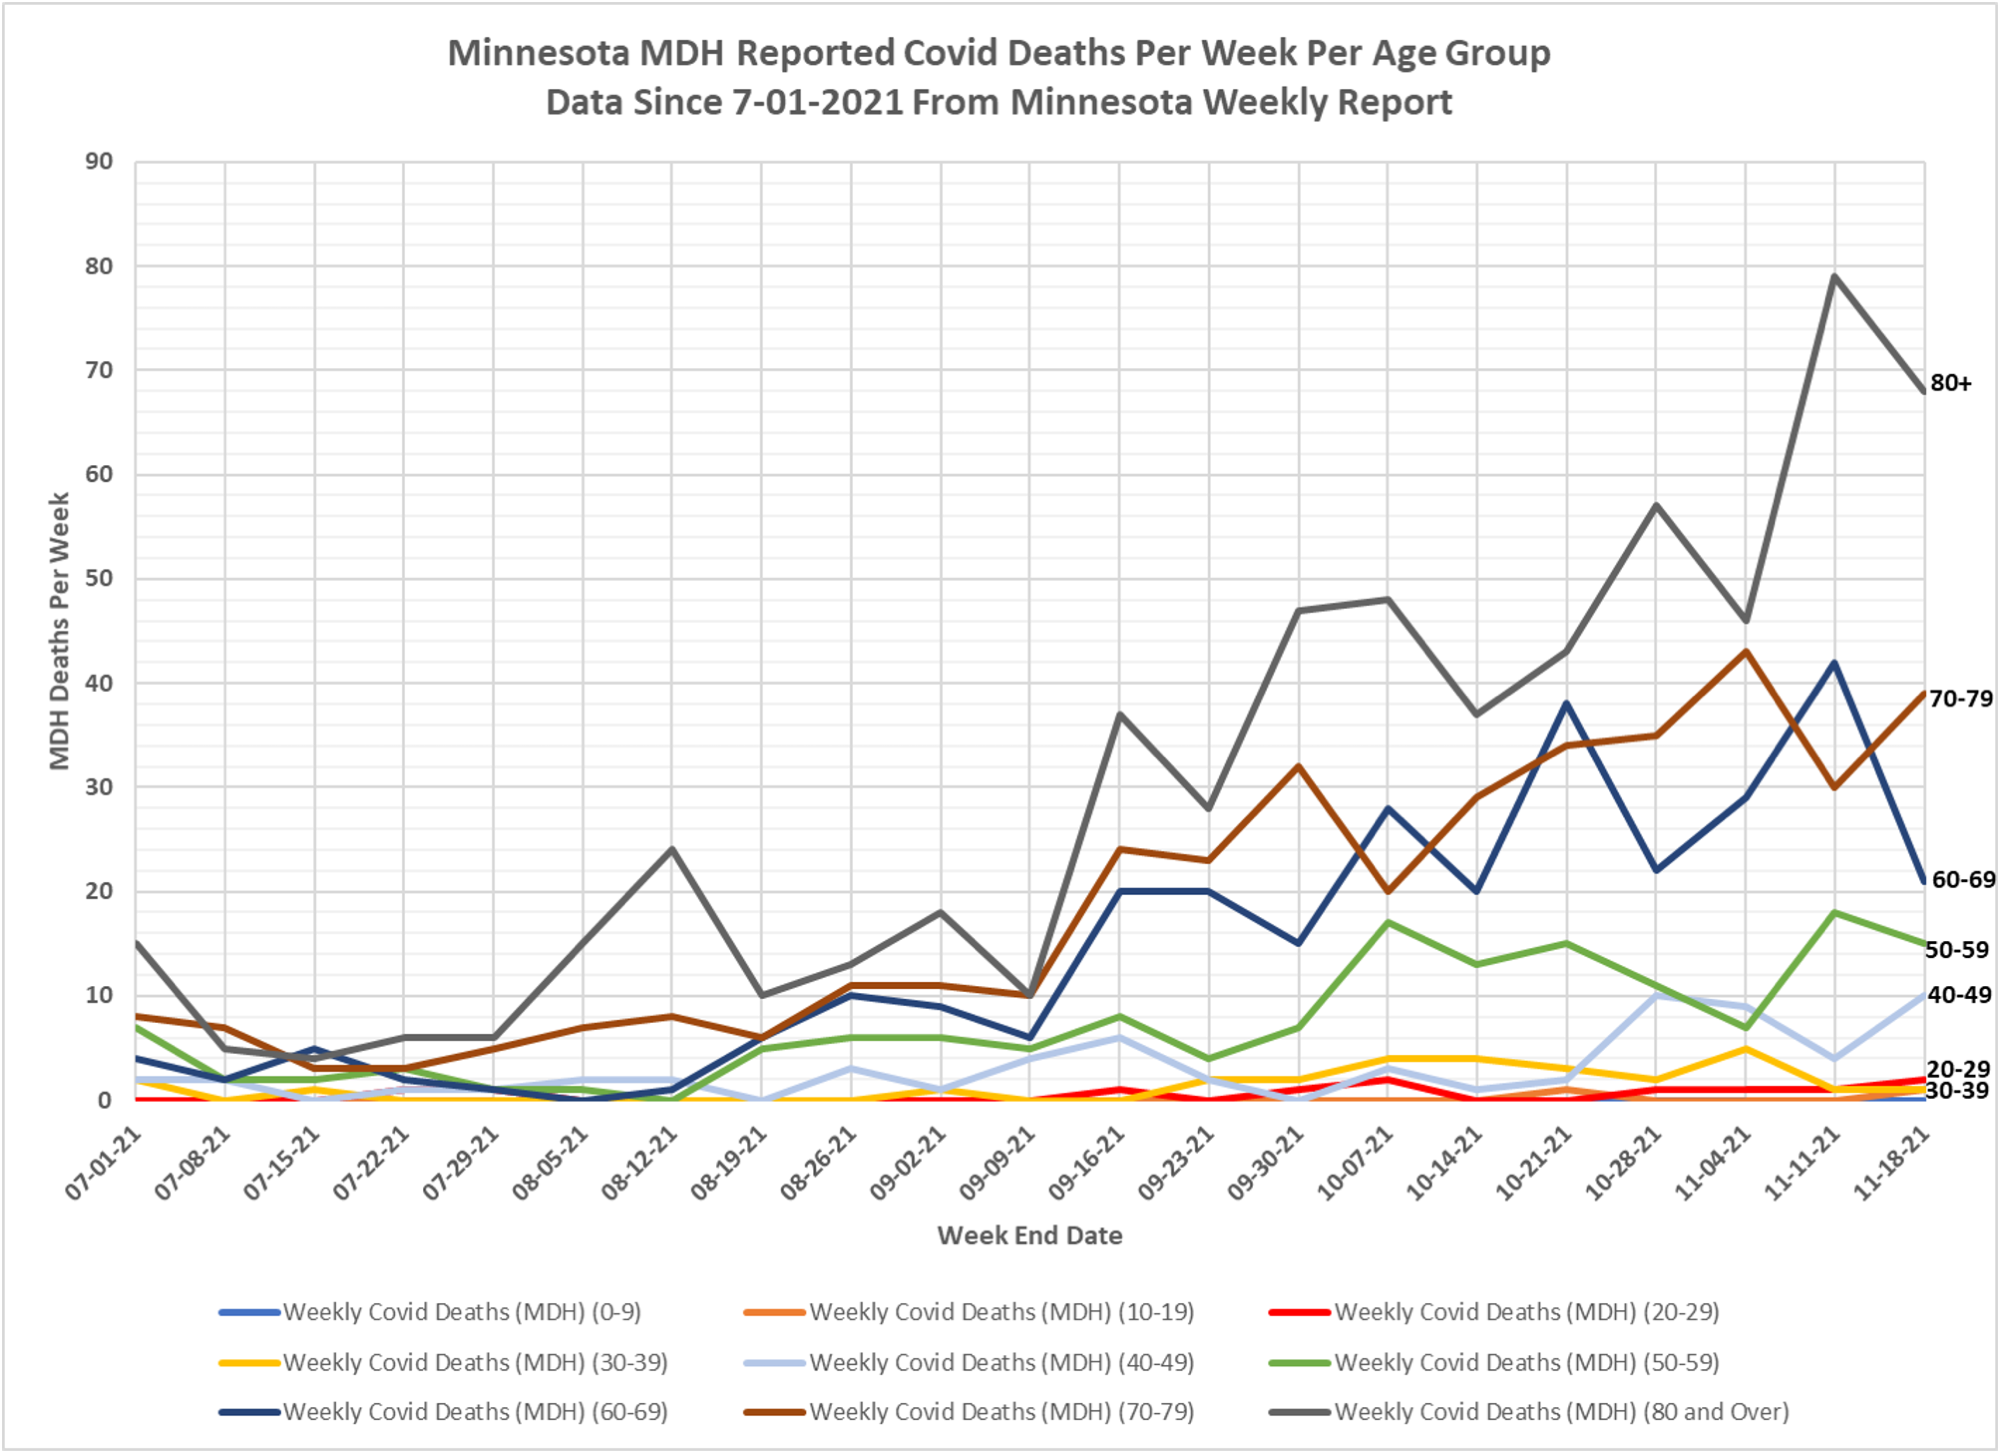
1. As always, there are 2 slides for each set of data, one showing data for the whole pandemic and a second chart showing only data since early July 2021.
2. The data for the charts on testing, hospital admissions, and deaths comes from the Minnesota Weekly Report (available here: https://www.health.state.mn.us/diseases/coronavirus/stats/index.html). The data in the Weekly Report is presented as cumulative totals for each data type each week. I am taking weekly differences and assembling the data into charts. This data is by date of report, meaning the charts are documenting new events reported this week, even though the underlying event occurred sometime in the past. The data is provided for 5 year age groups, and I am assembling into 10 year age groups to make the charts more readable.
3. The data for the Covid cases per week come from a data file published along with the Minnesota Weekly Report, here: https://www.health.state.mn.us/diseases/coronavirus/stats/index.html#wagscd1 This data is published by date of specimen collection, rather than by date of report as the other data is. The data is provided as cases per week in 5 year age groups. I am compiling the data into 10 year age groups in order for the charts to be more readable.
4. Slides 1 and 2: Covid Tests Per Week. The major changes up and down in weekly testing rates continues for the fourth week in a row. The Minnesota Situation Update page (https://www.health.state.mn.us/diseases/coronavirus/situation.html) reports testing by date of test (although without the age breakdowns). The testing reported in the Situation Update does not exhibit the large up and down swings that the Weekly Report does. For the 7 days ending 11-17 the Situation Update page reports a total of 301,421 PCR and antigen tests completed. The Weekly Report released 11-18 reports a total of 371,014 tests completed in the same time period.
5. Slides 3 and 4: Covid Cases Per Week. The Covid cases per week is higher this week in all age groups, for the fourth week in a row. Total cases for the week were reported as 28,297, an increase of 16.3% over last week’s total.
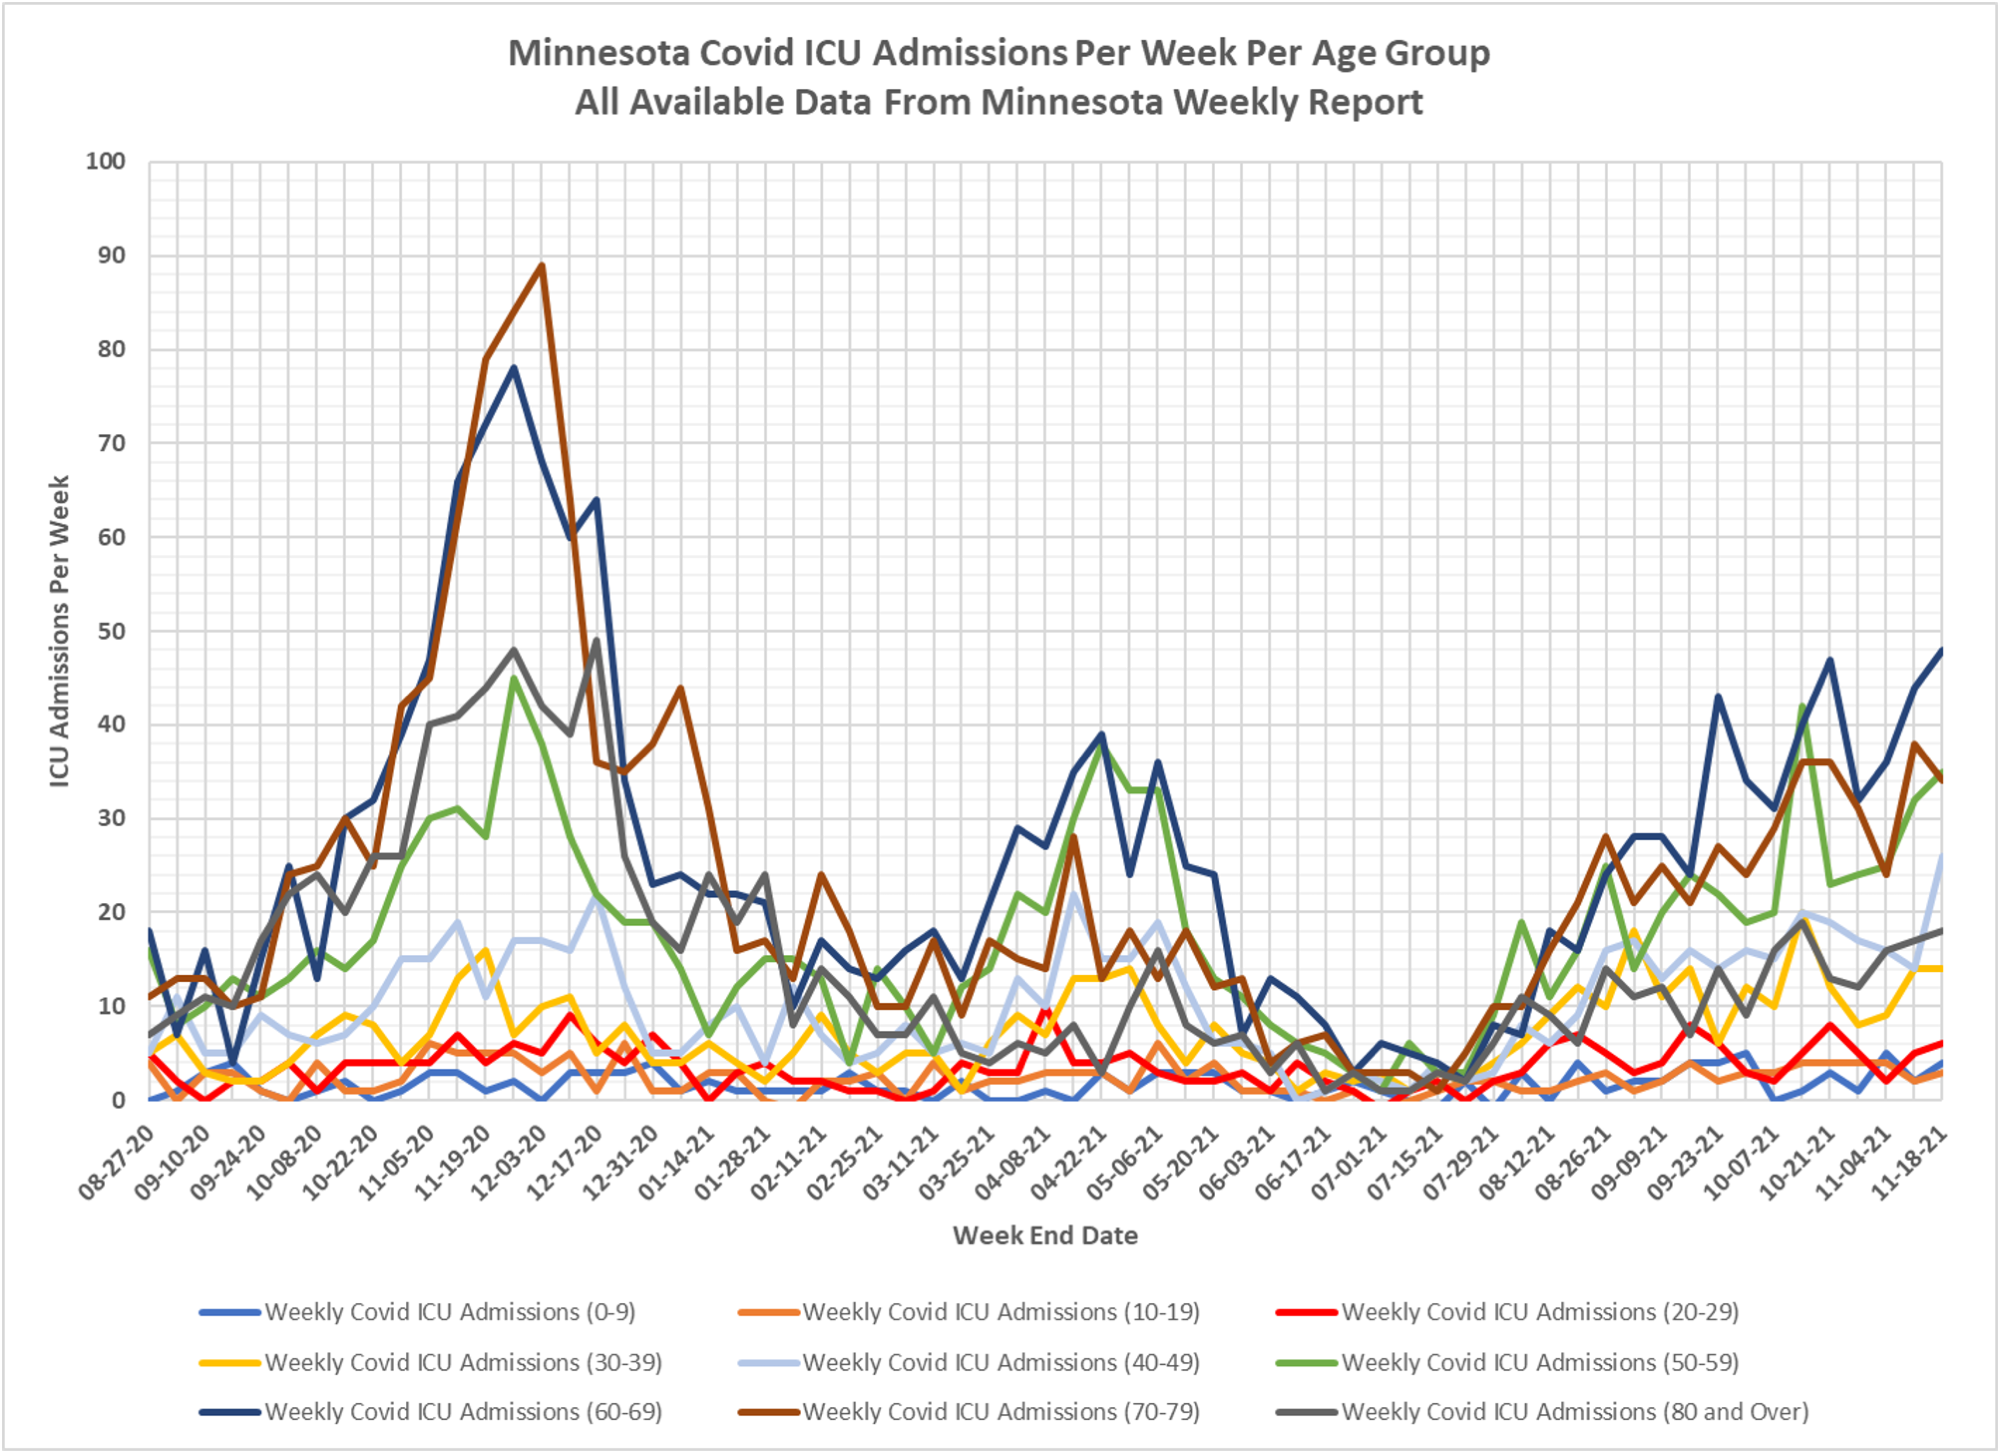
6. Slides 5 and 6: ICU Admissions Per Week. There were 4 reported Covid ICU admissions in the 0-9 age group in this Weekly Report, and 3 in the 10-19 age group. There still appears to be very minor impact of Covid infections on ICU admissions for school age children, with little change in the rate of childhood ICU admissions over many months. Total ICU admissions for the week were 188, which is 20 more than the prior week. The highest reported Covid ICU admissions were 292 the week ending 11/26/2020, at last winter’s peak.
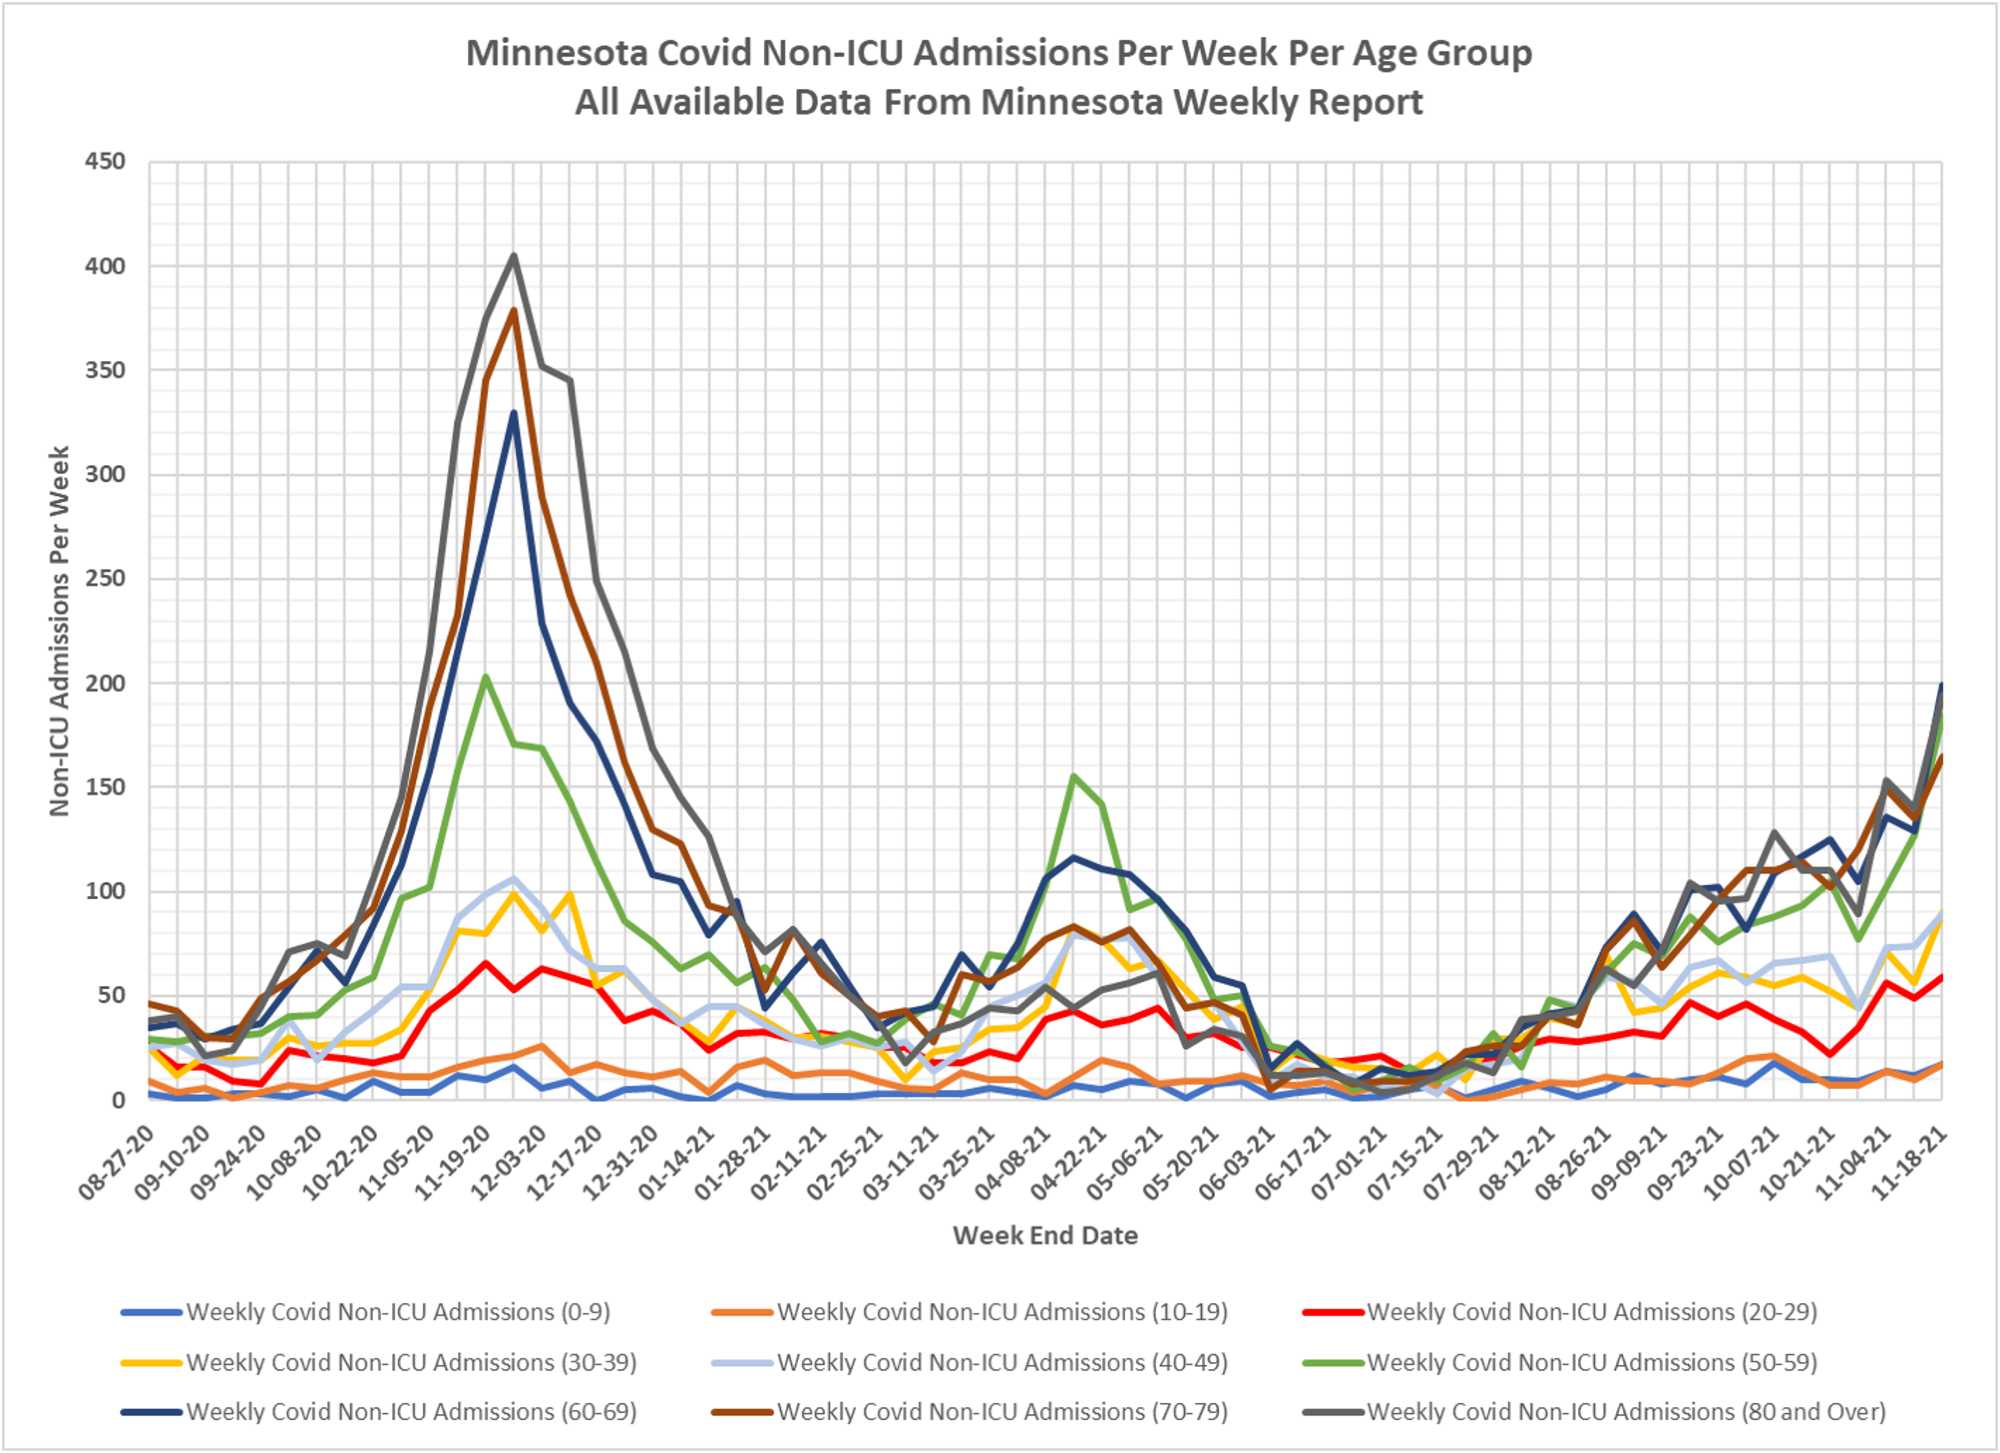
7. Slides 7 and 8: Non-ICU Admissions Per Week. Non-ICU admissions were higher in all age groups this week.
Non-ICU Covid admissions for the younger age groups remain very low, as they have for many months. The 0-9 and 10-19 age groups each had 17 Non-ICU Covid admissions for the week. Total Non-ICU Covid admissions for the week were 1014, a large increase of 282 admissions from the 732 admissions last week. It is a little puzzling to me why the 80+ age group would have the second highest Non-ICU admissions for the week, but have the fifth highest ICU admissions for the week. Other than the 80+ age group, all of age groups are ranked fairly consistently on the ICU and Non-ICU admissions per week charts.
8. Slides 9 and 10: Deaths Per Week. Total reported deaths for the week were 157, down from 175 reported deaths the week before. Deaths per age group remain very well correlated with age.