Dave Dixon’s updated production. Notes below. Lot more tests this year, so a lot more cases, hard to know which drives which. Lot more vaxed people this year, i.e., there were none last year. How can this be happening? But you do see some effect of vaccines I think, especially in the death line, and maybe a little in the hospital line.
Dave’s notes:
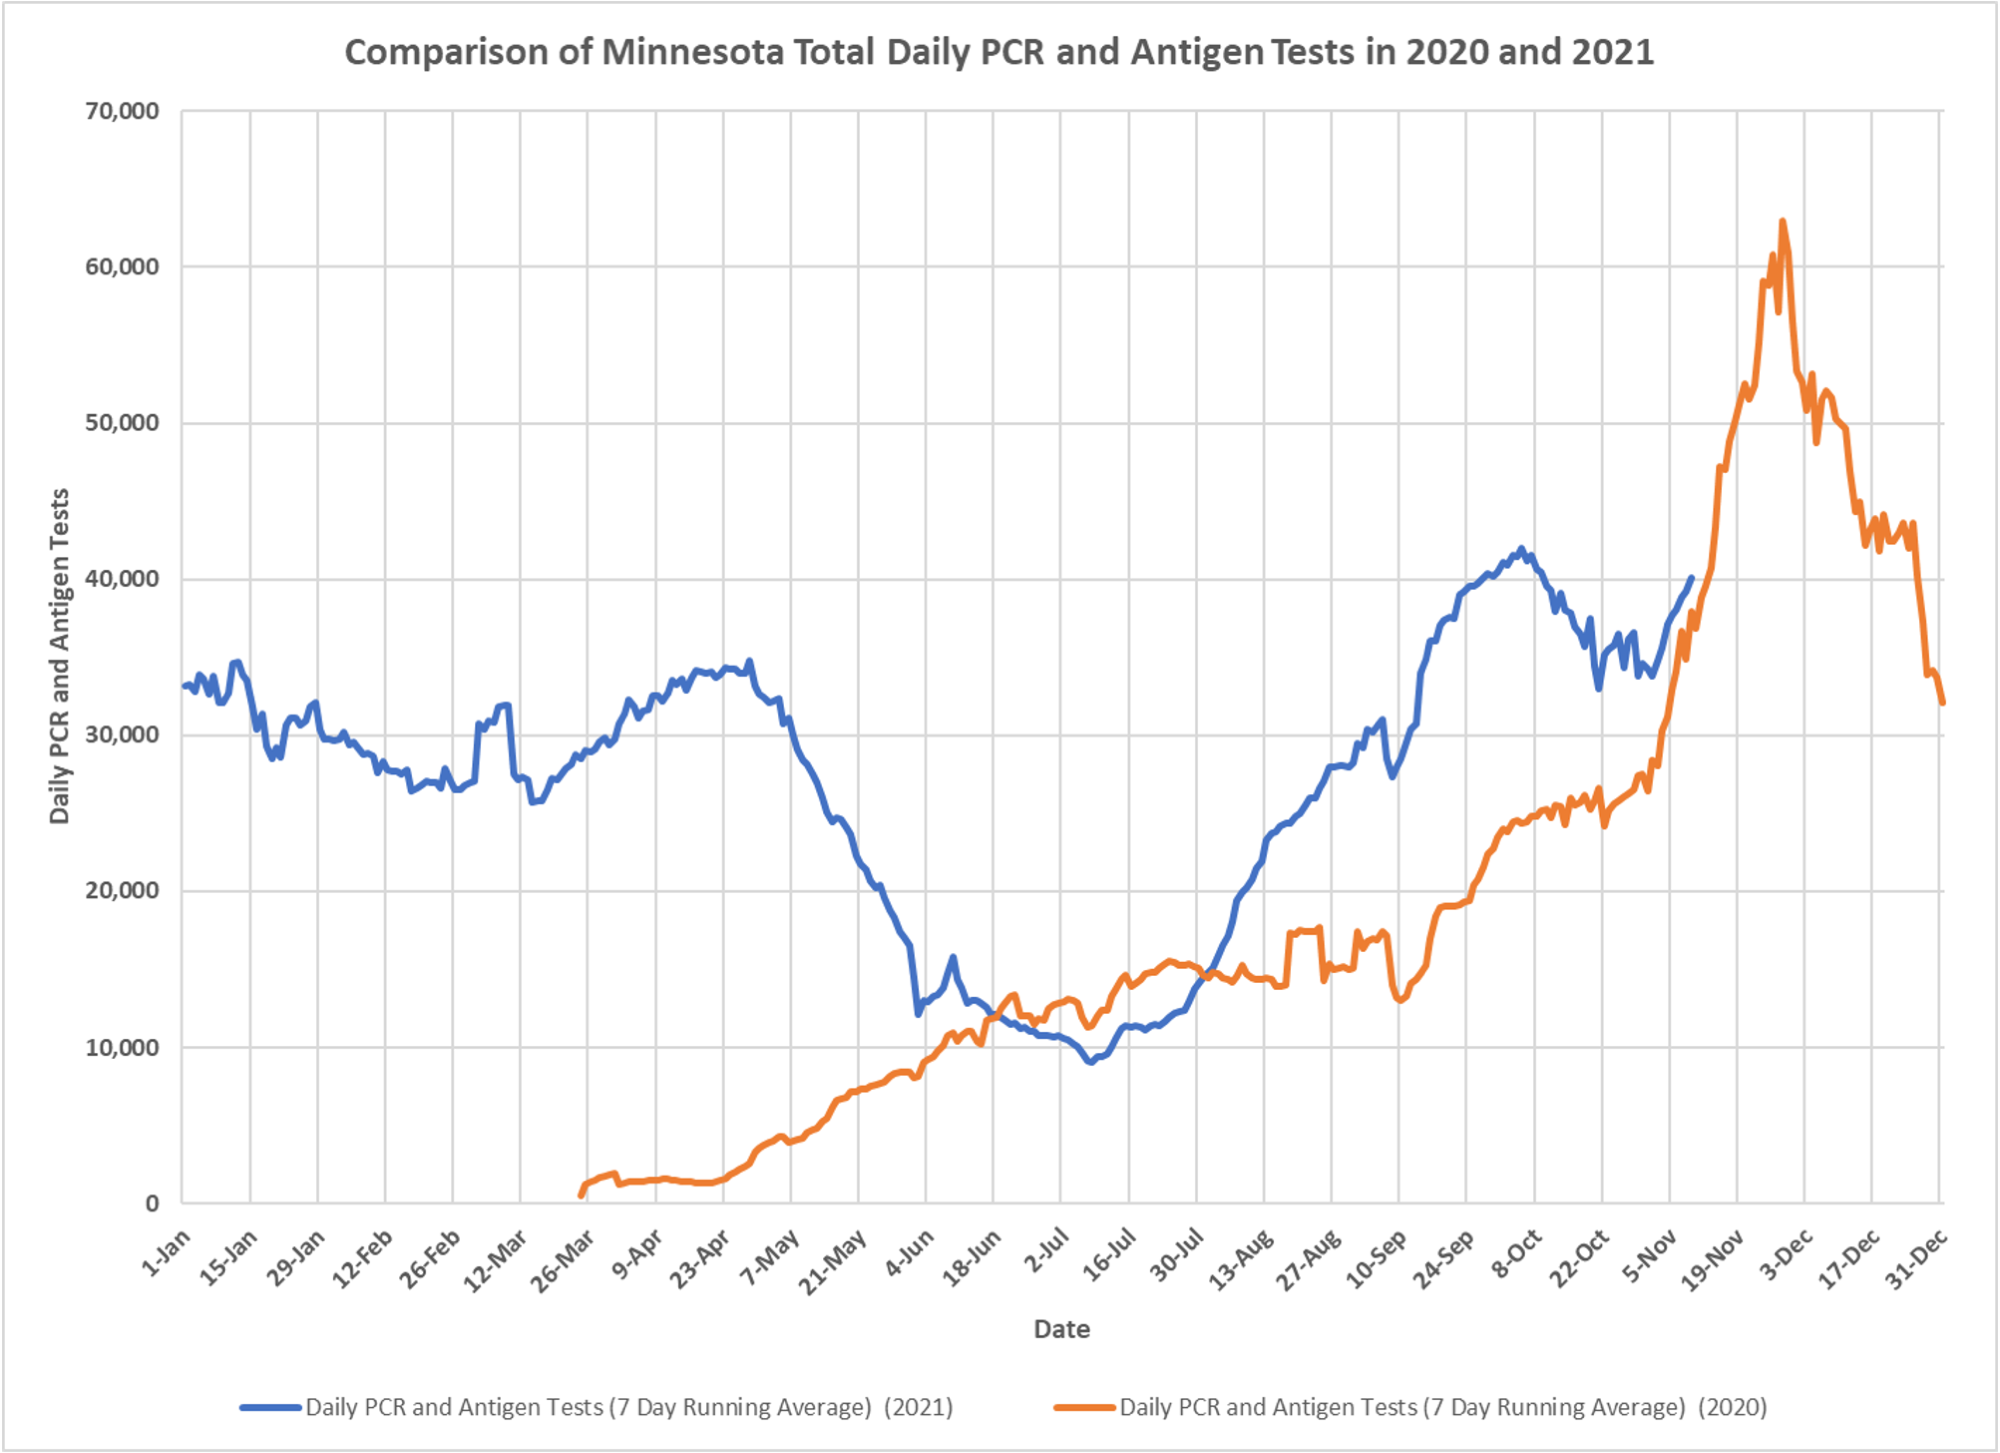
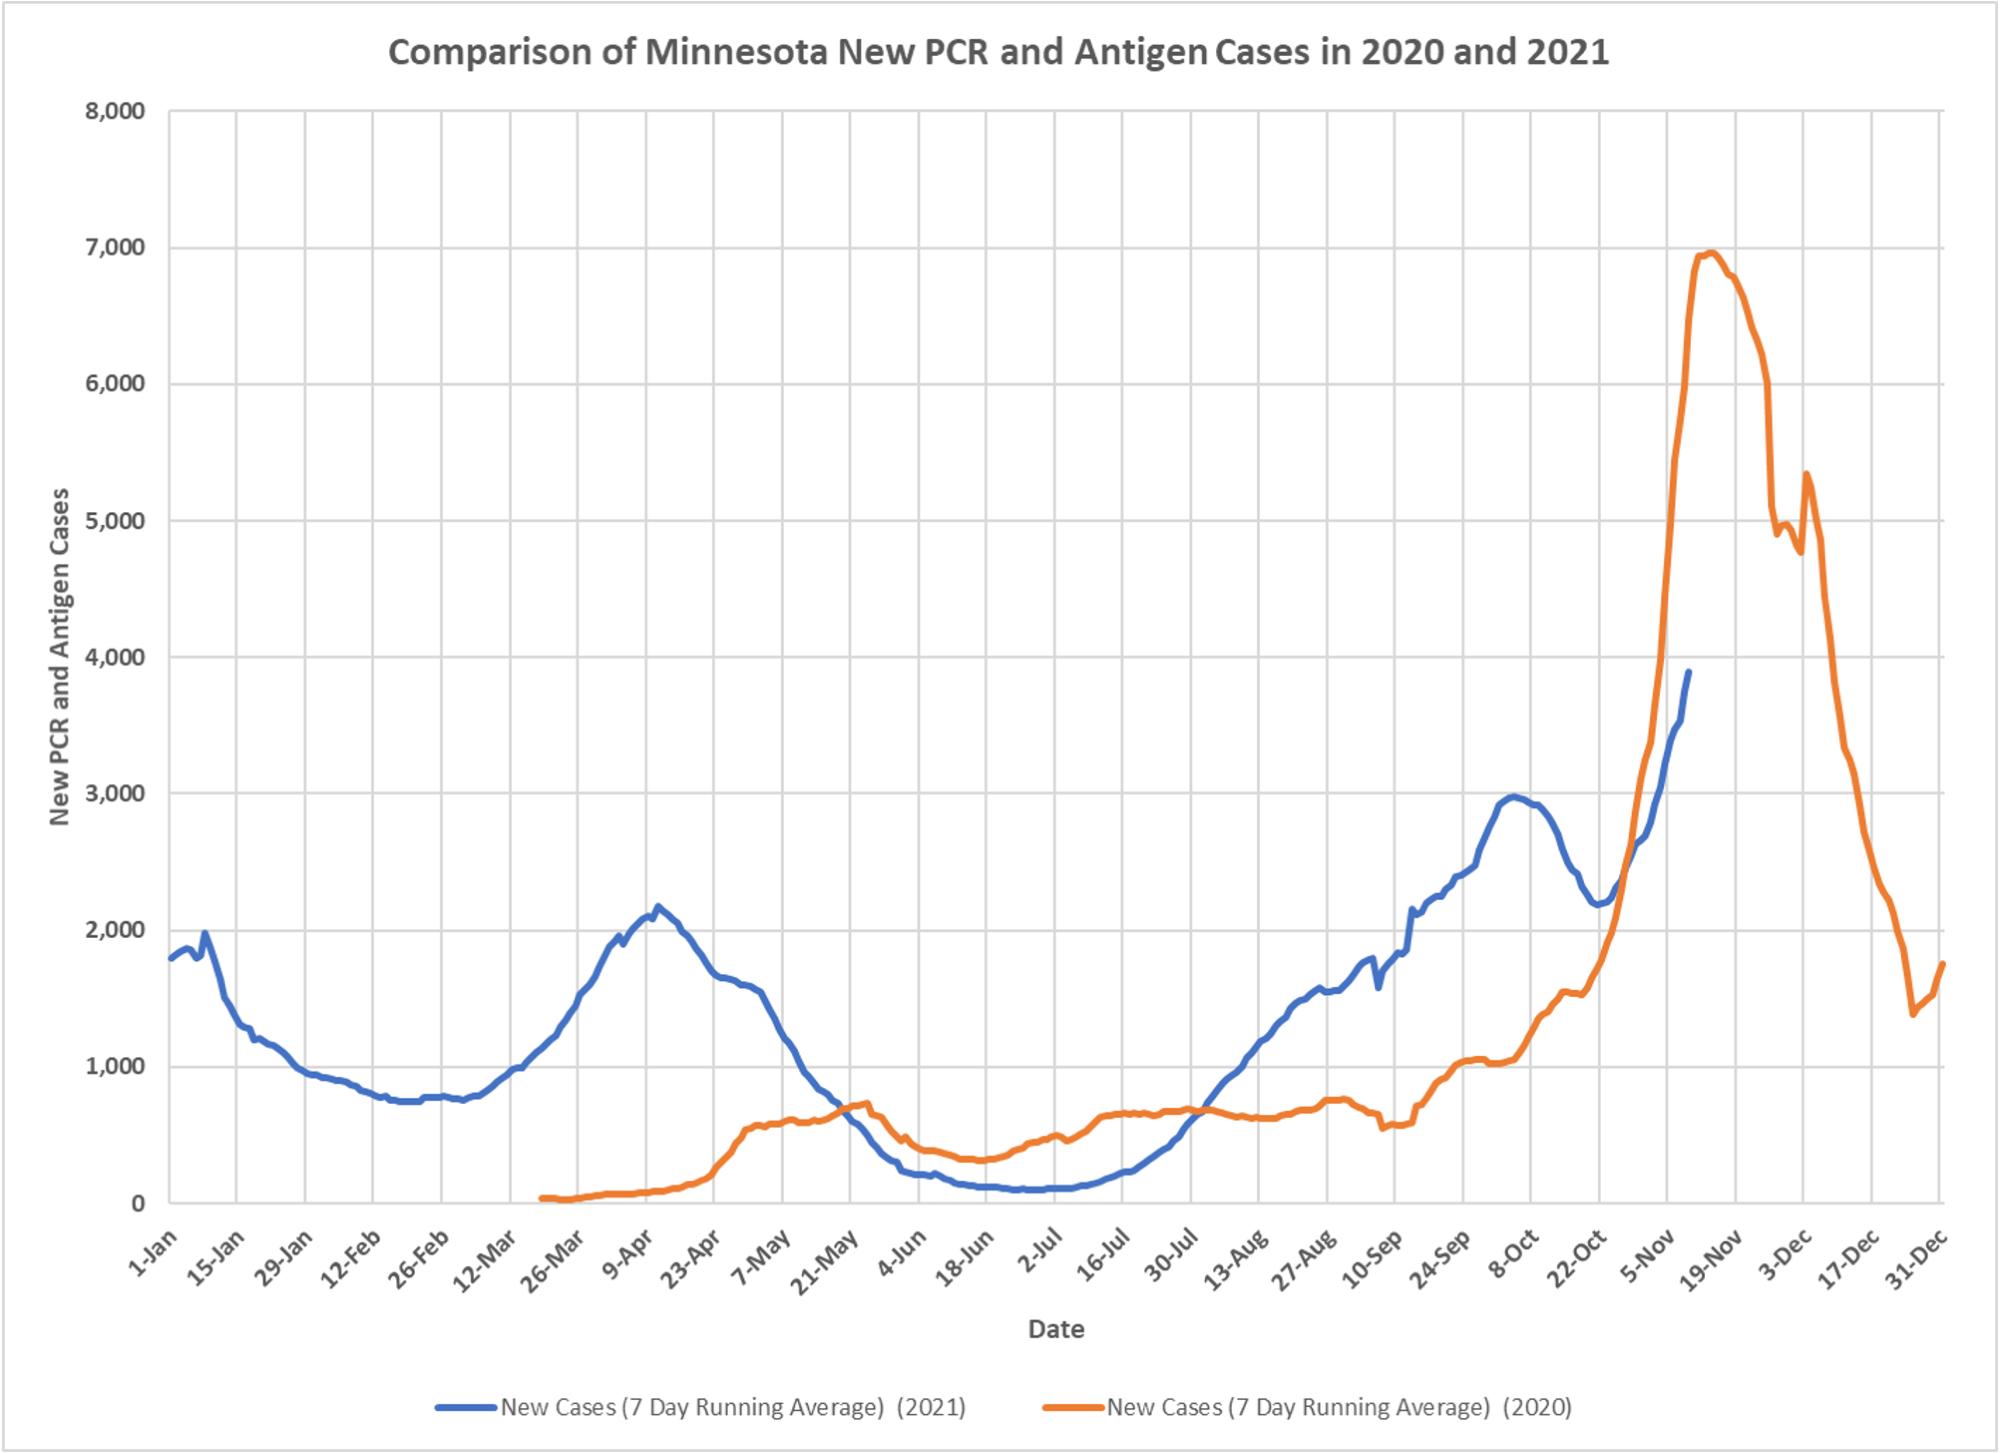
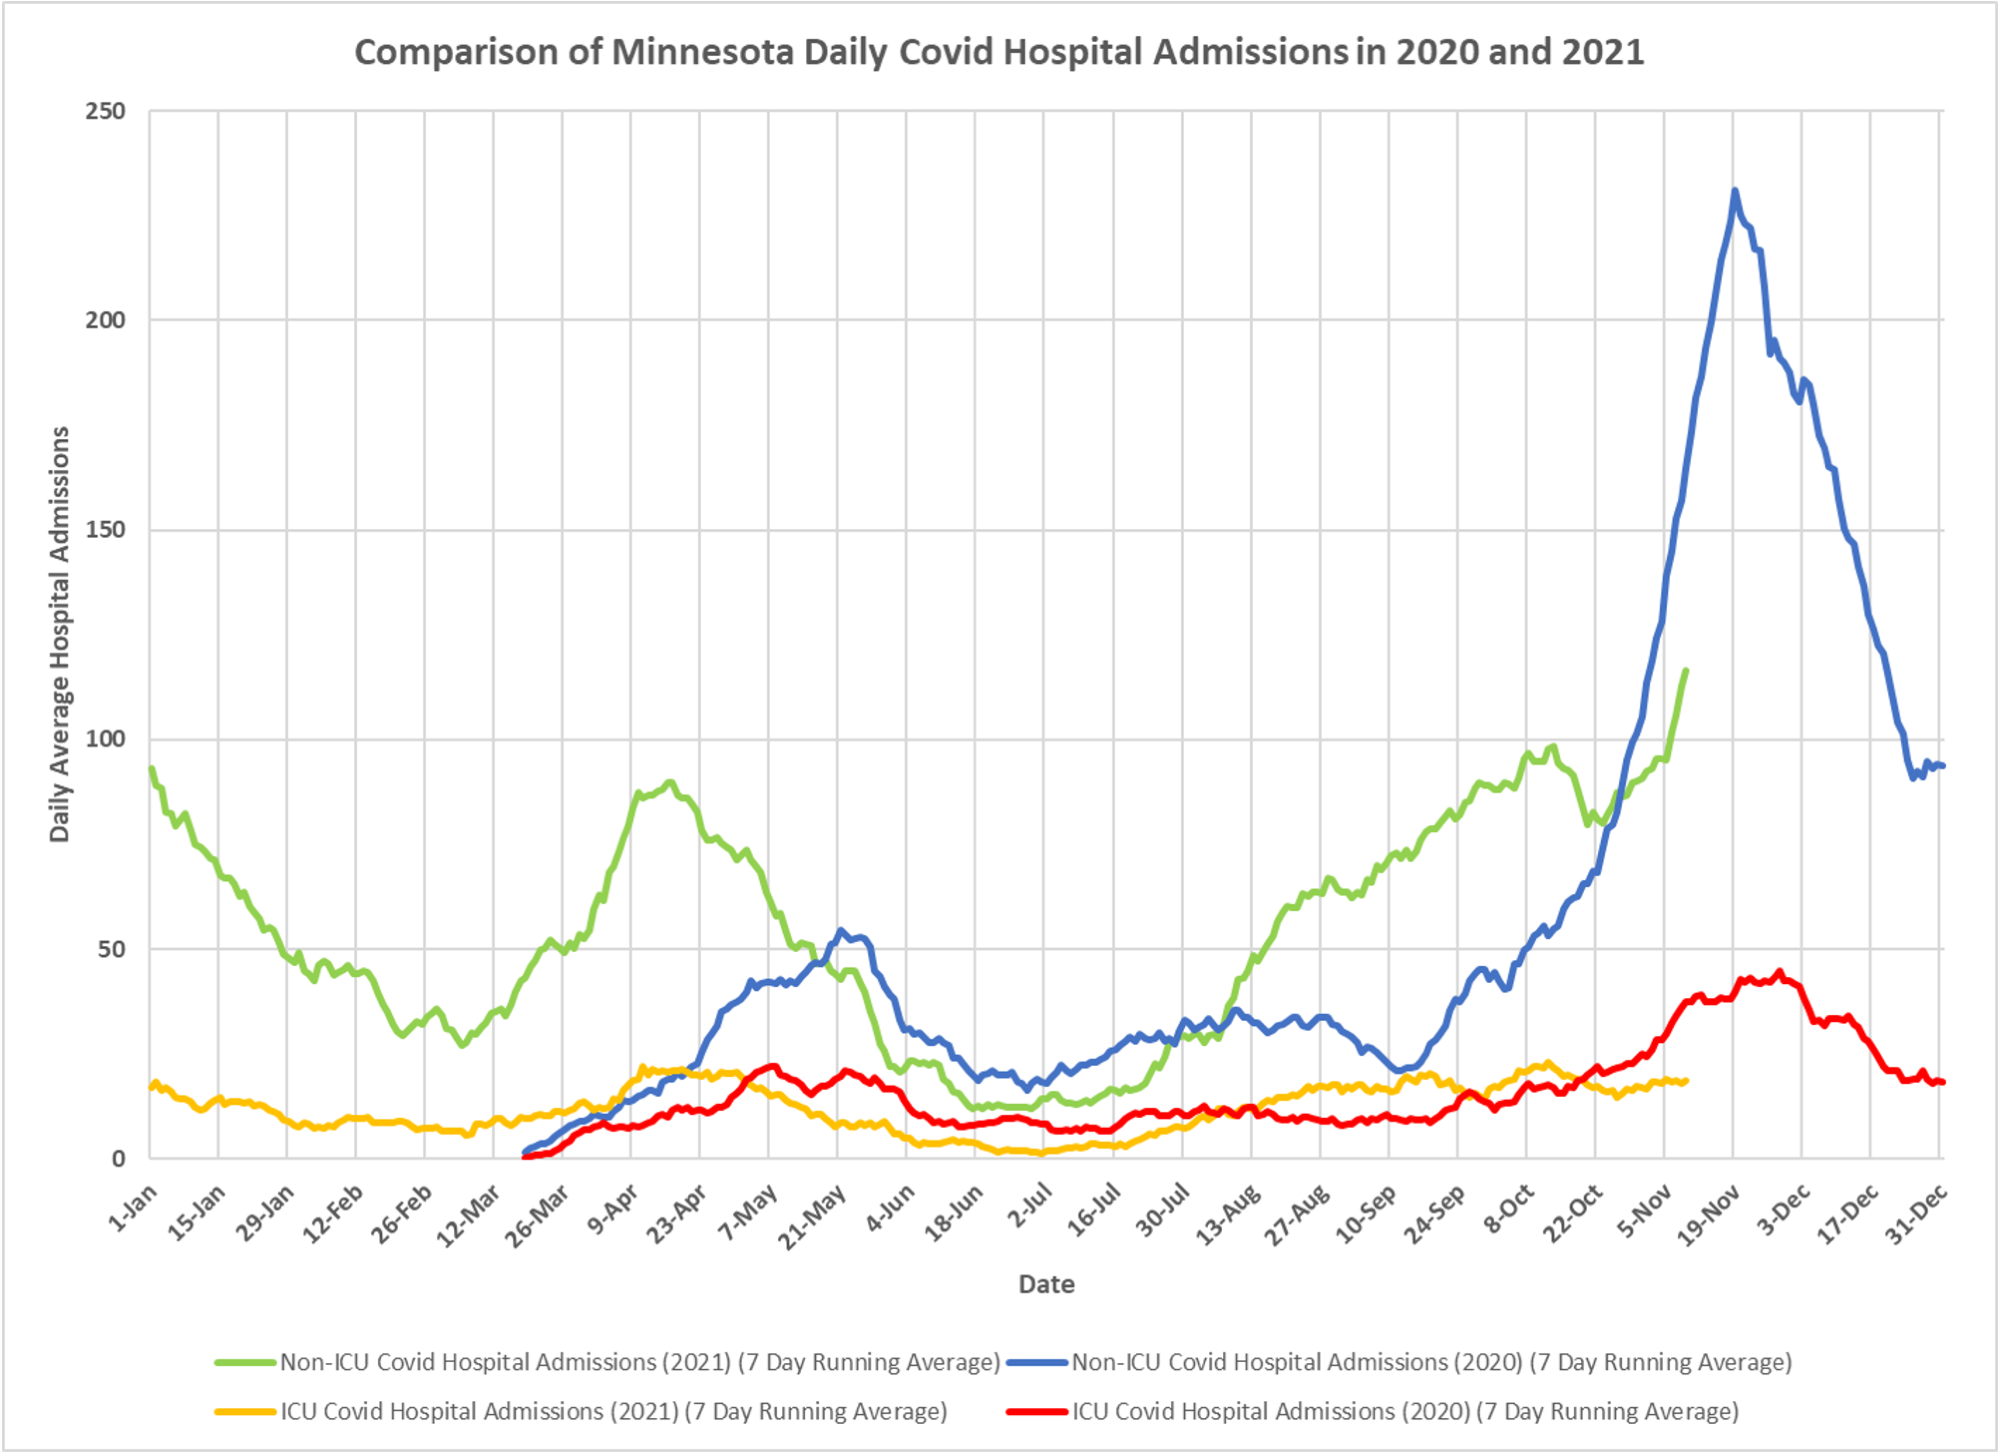
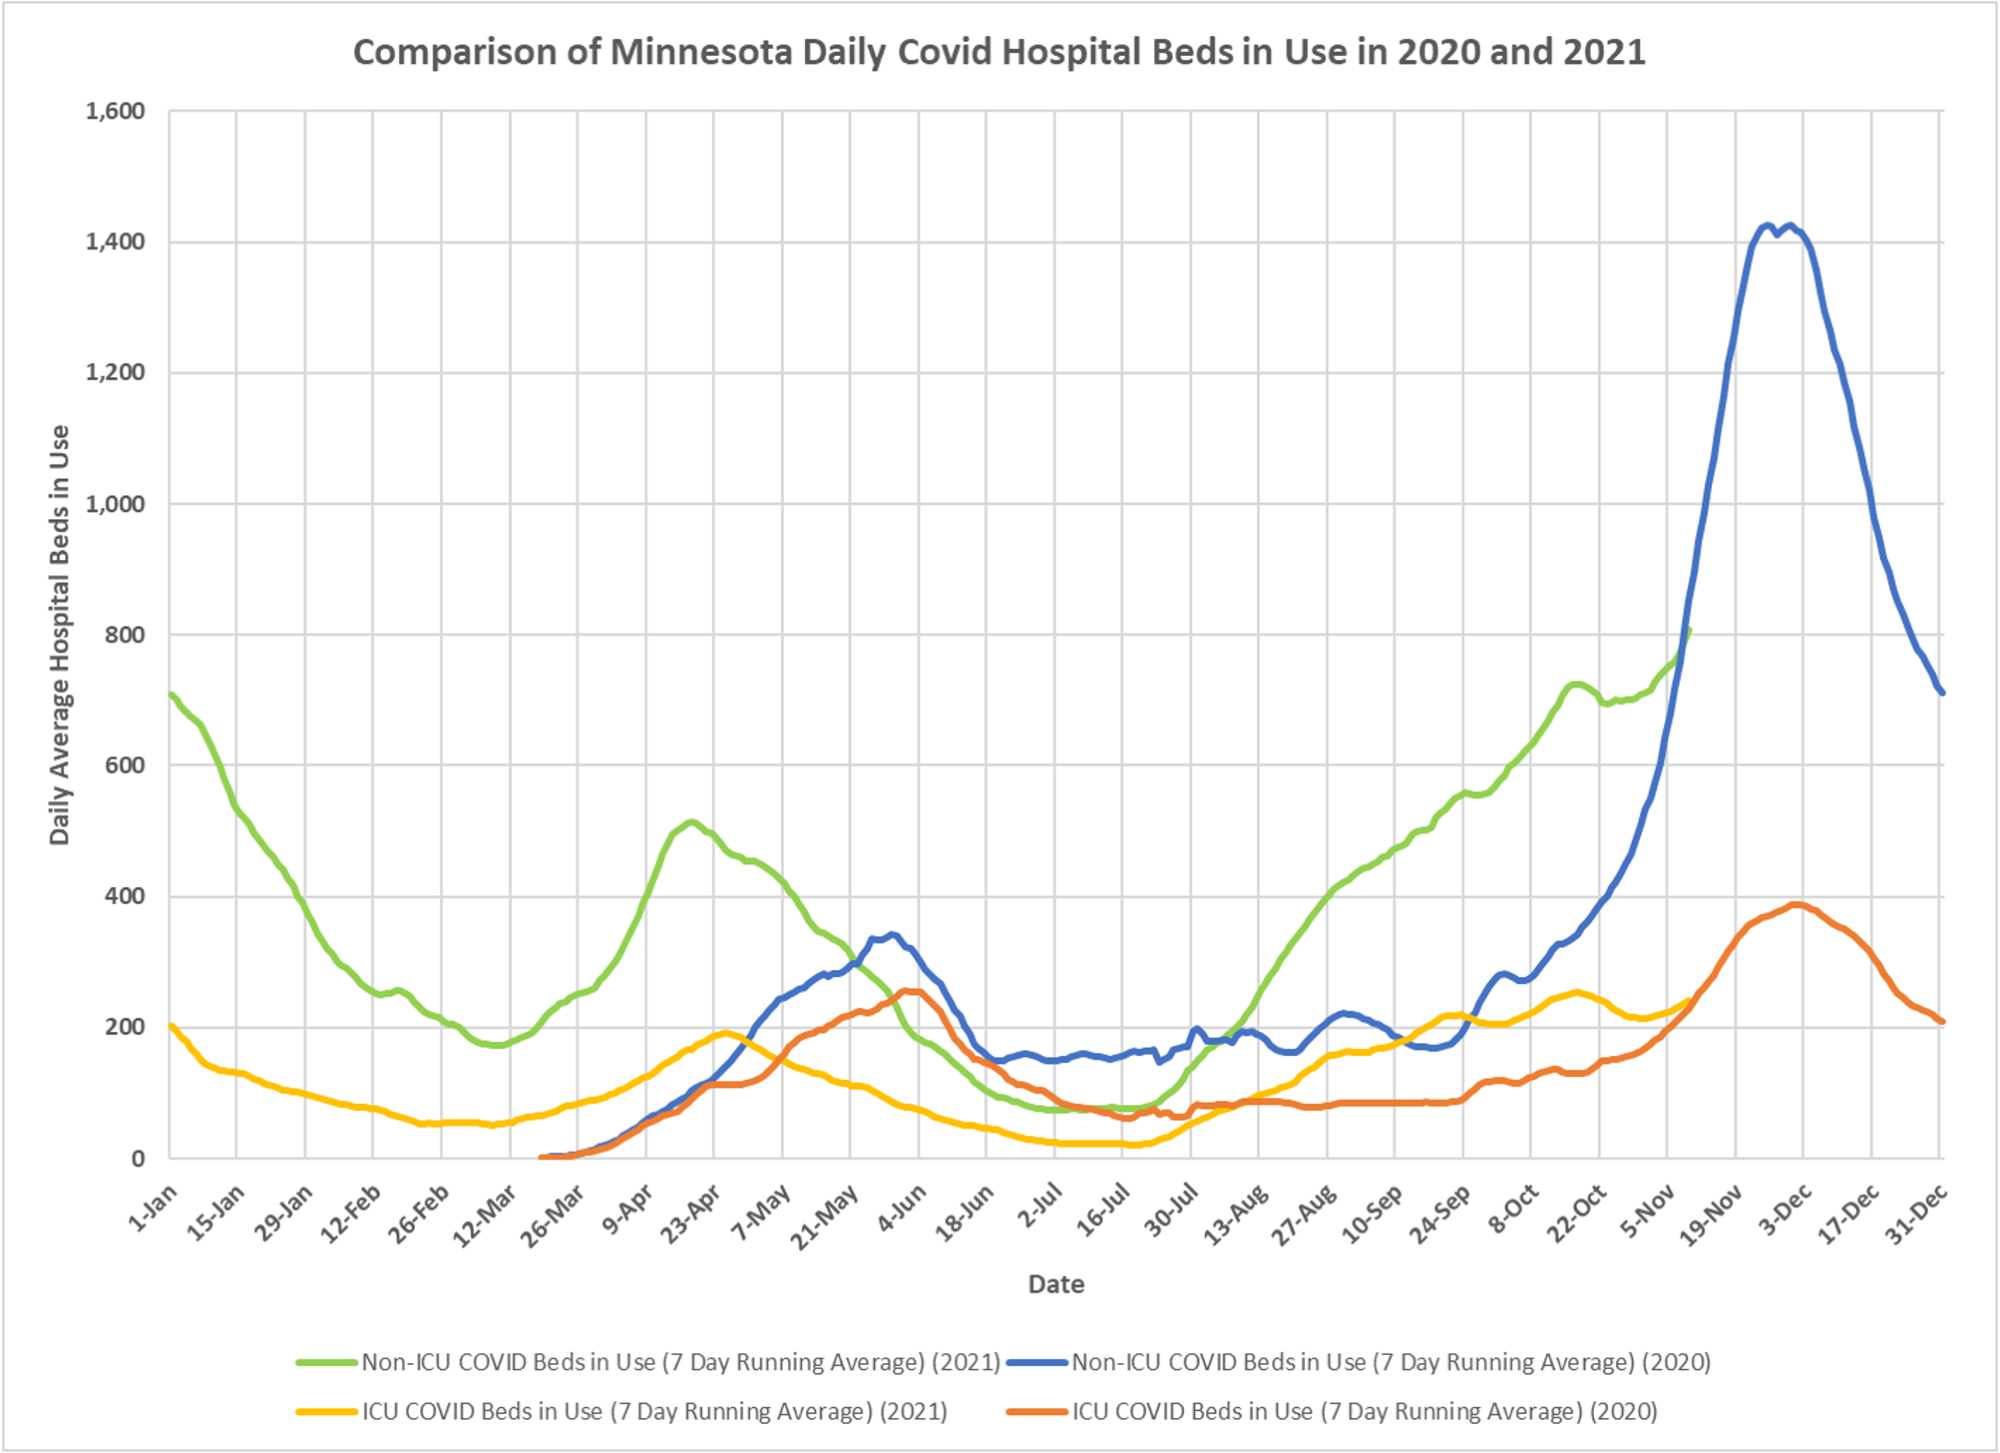
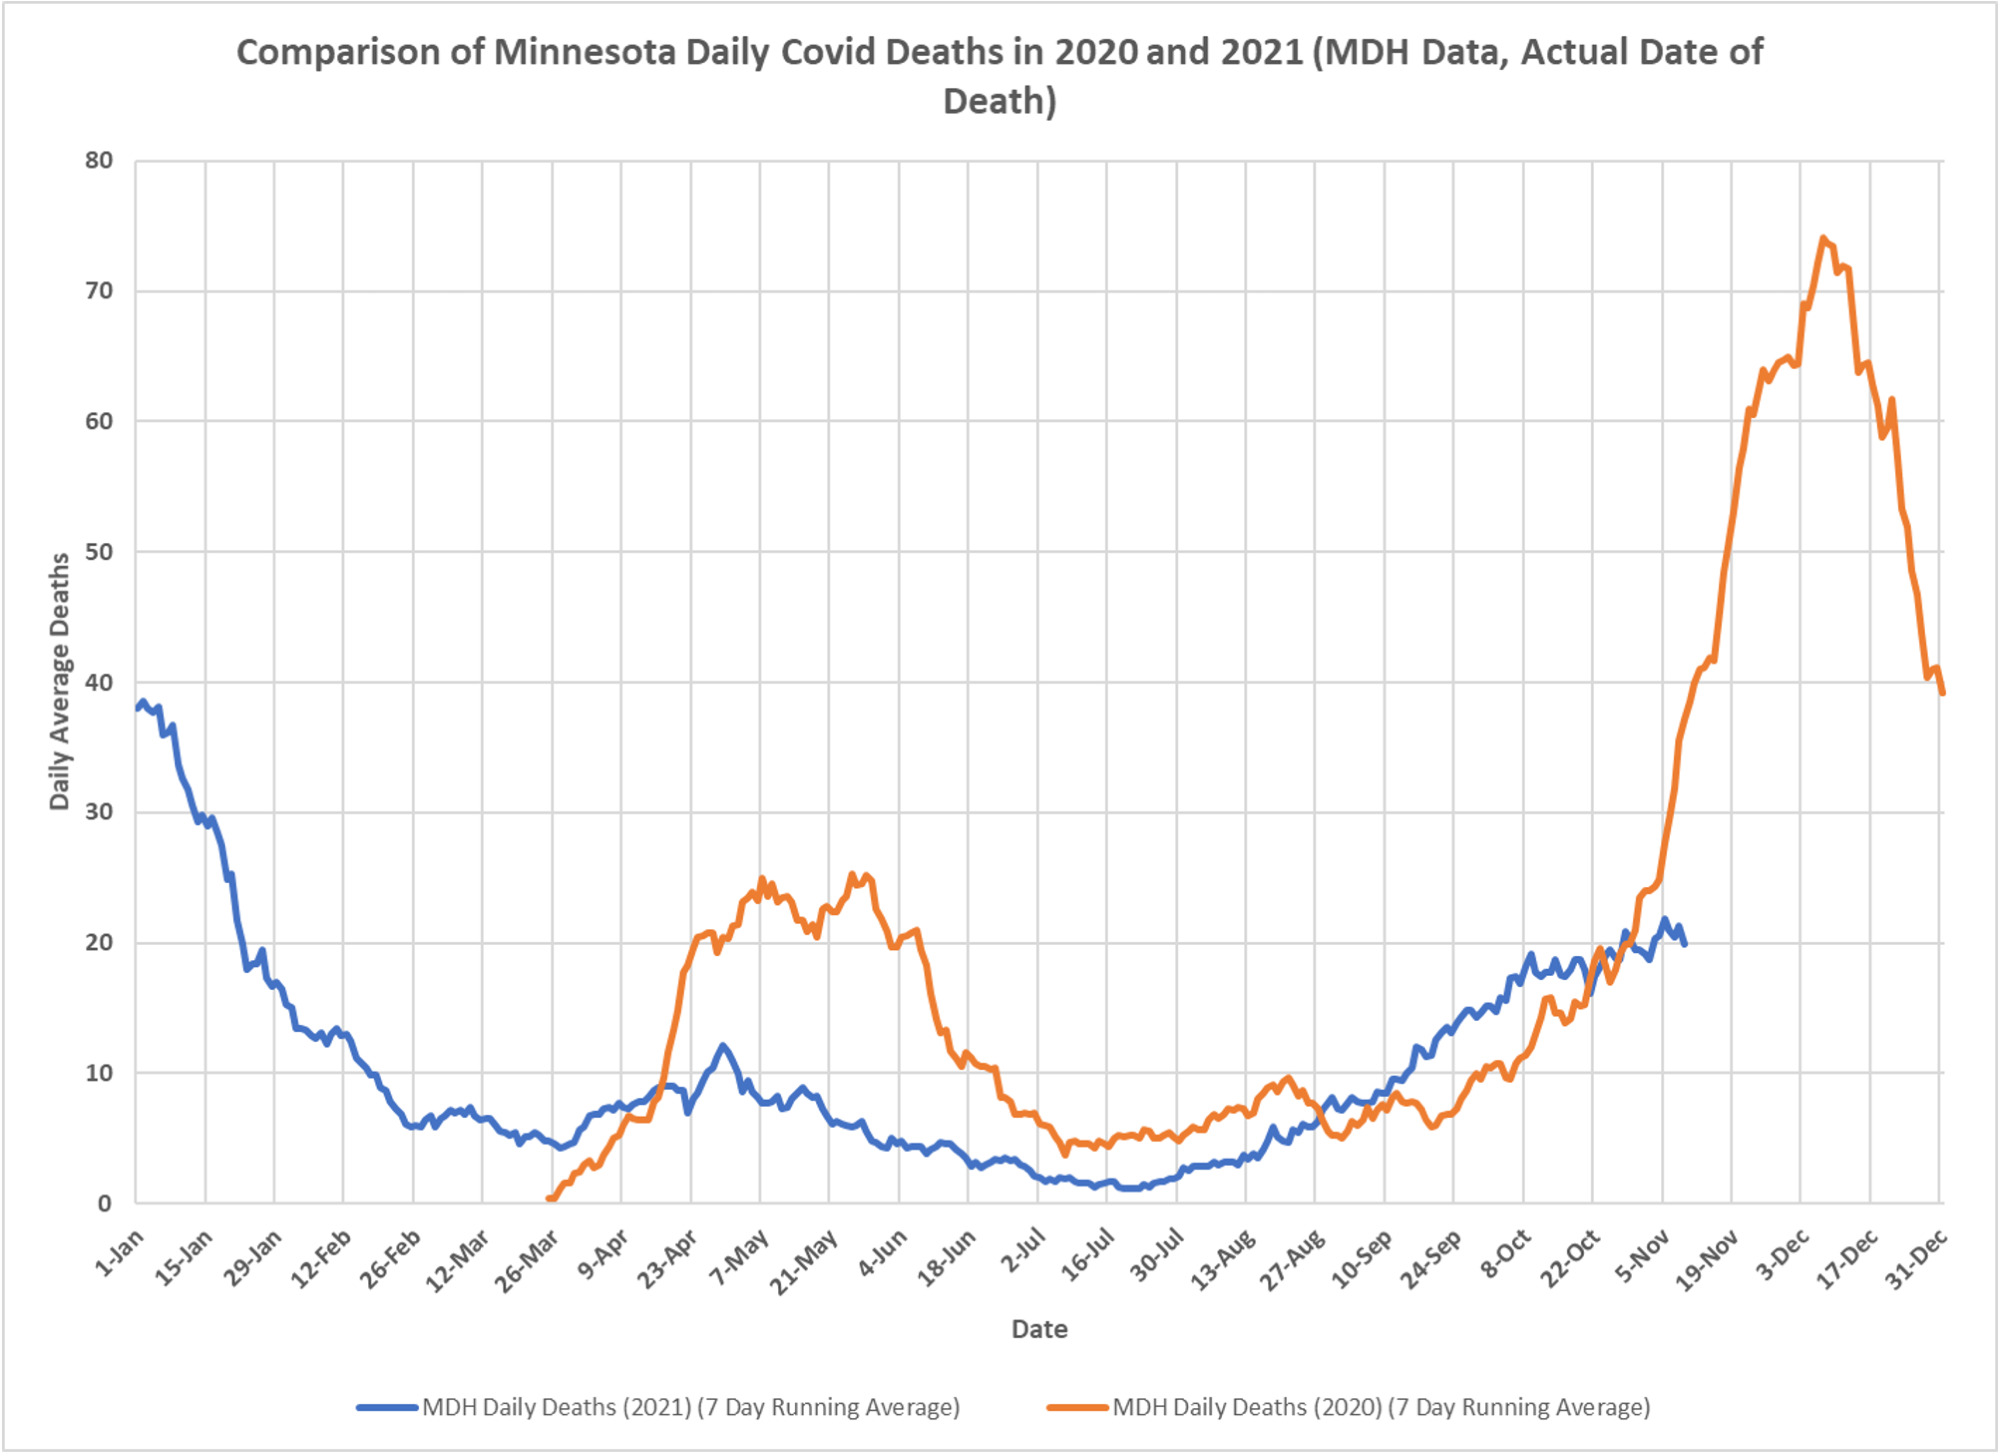
1. The sharp rise in cases, hospital admissions, and hospital beds in use is stunning given the levels of vaccination in Minnesota. One month ago I thought the worst was over after cases peaked in early October. The data looks very much like last year. Reported deaths is the only data point that has not accelerated as much as last year at the same time.
2, All data for testing, cases, hospital admissions, and deaths are taken from the data table on the Minnesota Situation Update page: https://www.health.state.mn.us/diseases/coronavirus/situation.html The only modification to the data is to calculate 7 day running averages in order to make the trends easier to see.
3. The underlying data for hospital beds in use is taken from the Teletracking data file found on the Response and Preparation web page: https://mn.gov/covid19/data/response-prep/response-capacity.jsp The Teletracking data file is also cited as the data source for the graphic on this same page. 7 day running averages are calculated for beds in use as well.
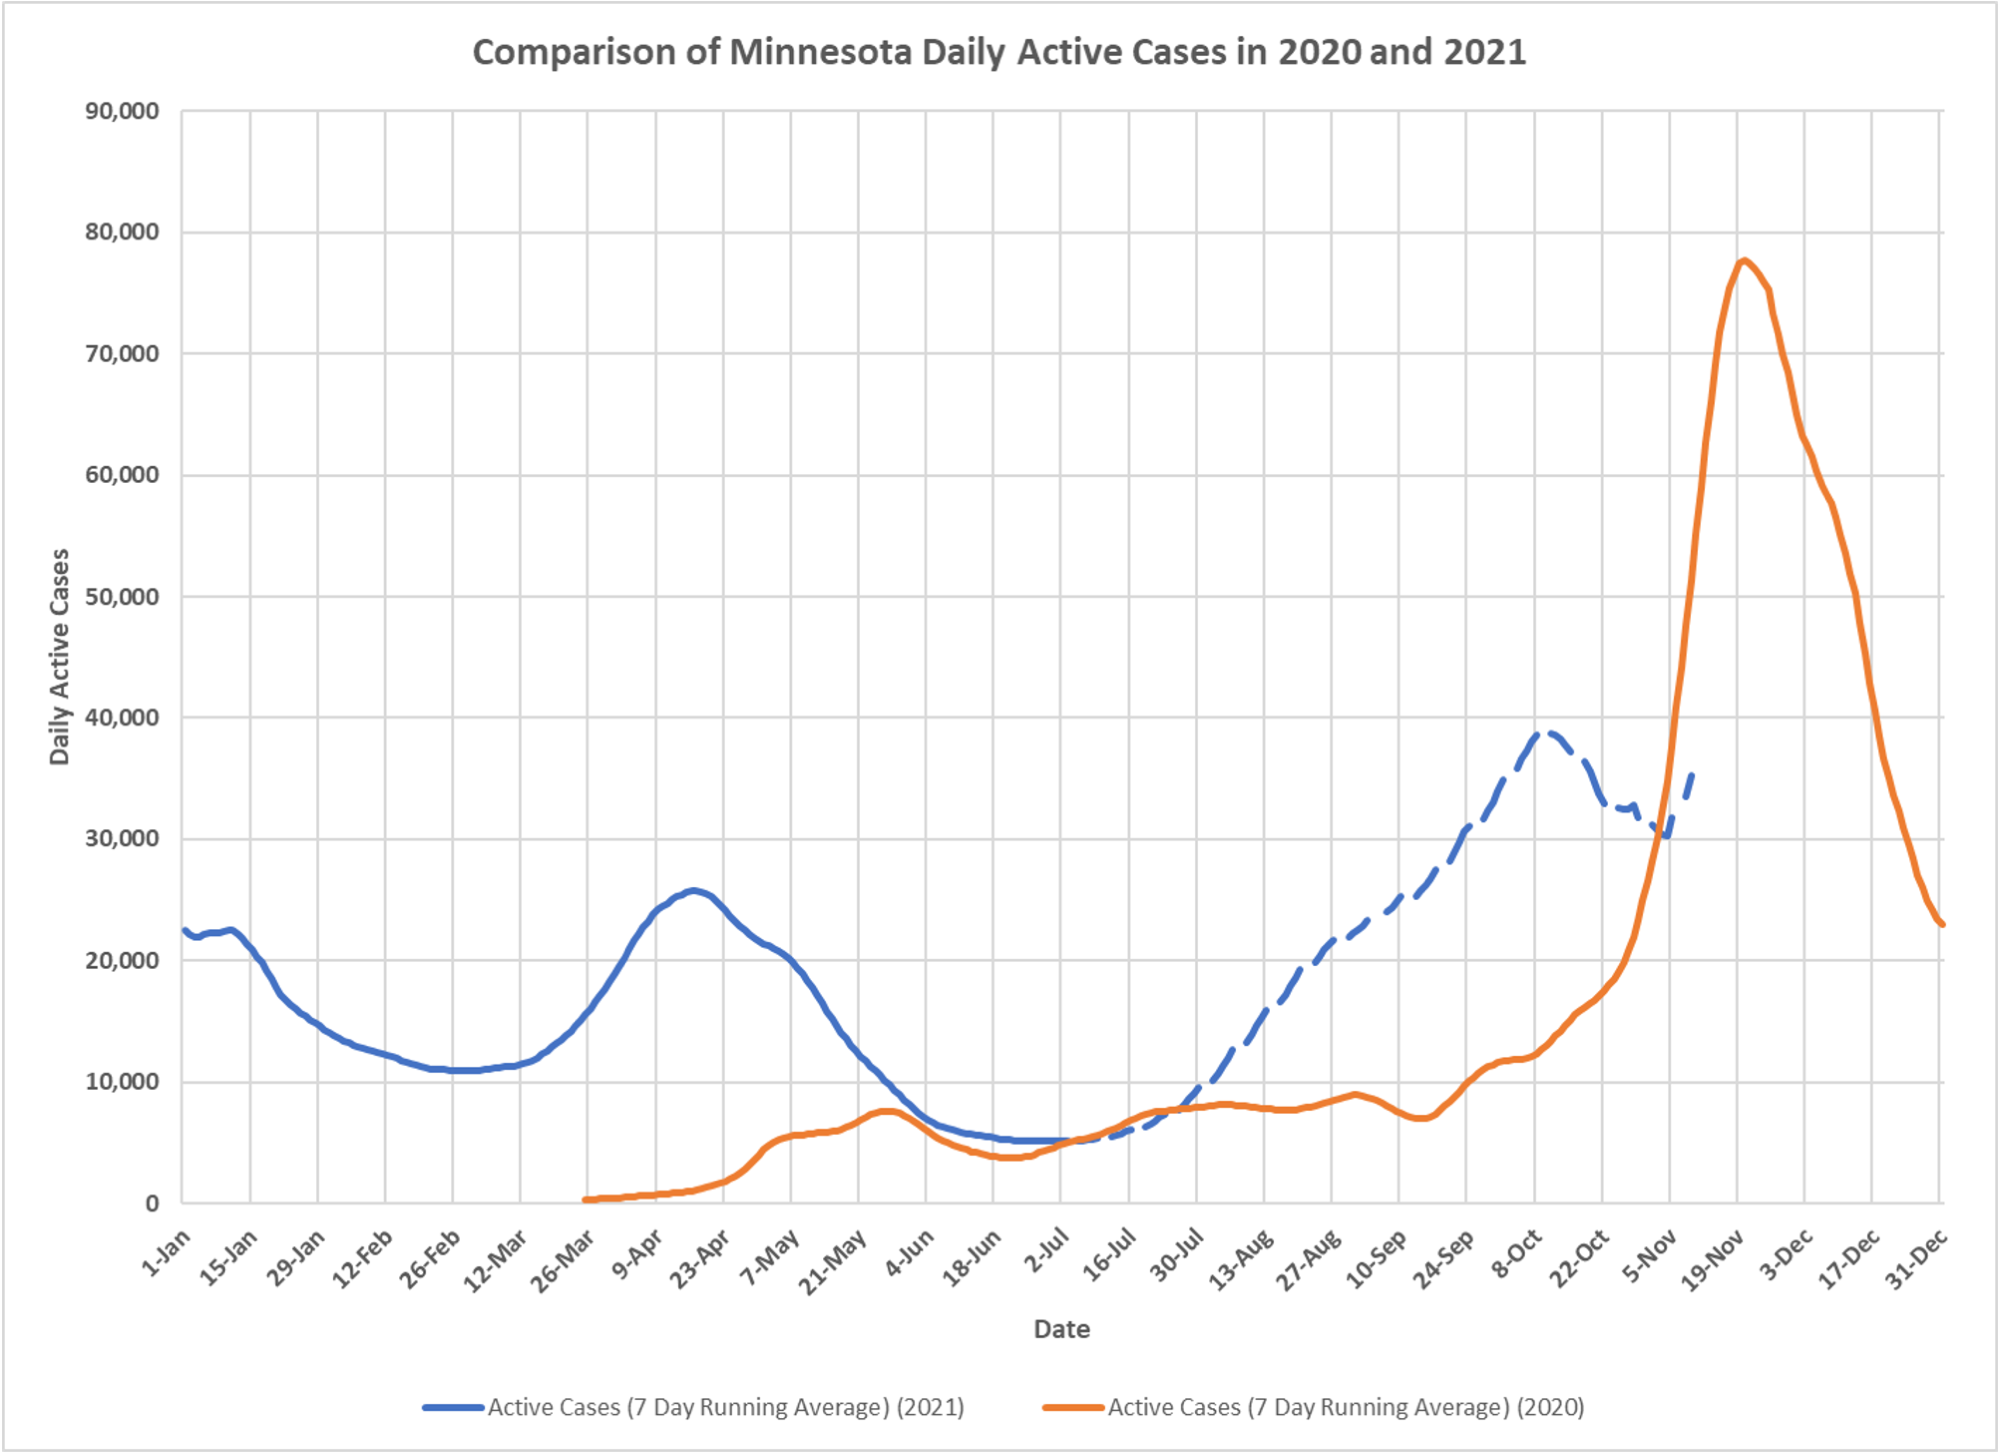
4. Active cases are calculated as the cumulative PCR and antigen positive cases minus cumulative deaths minus the people No Longer Needing Isolation. The No Longer Needing Isolation total is found on the Situation Update page. In recent days MDH has started publishing the Total Positive People (Cumulative) statistic. It is on our to-do list to figure out the impact of this reporting change on Active Cases.
5. For all charts the most recent 7 days of data is excluded, in order to avoid charting incomplete data.

Remember as you make year-to-year comparisons that since July we are now dealing with the delta variant. It infects cells much faster, and infects cells with a lower concentration of ACE2 on their surface. The net result is much higher viral loads and a larger R0. Combined with the fact that a 2-dose series is less effective against delta infection, less effective at preventing transmission, and results in waning immunity, and you can see why we’re probably approximately back where we started with regards to Rt. Notably, Israel experienced the same problem, but when they introduced booster doses, cases began to fall immediately. Correlation is not proof of causation, but their data comport with quantitative expectations based on increased anti-delta titers.
Is it possible that the deaths are not accelerating because we lost so many people last year?
yes, I think the pool of vulnerable people was somewhat depleted
By the completely unfit for purpose, screwed-up, process called PCR, ~3.25% of the global population have had ‘Cases” so far. A fraction of that percentage at any one time. Alpha, Delta, Schmelta, it’s still a big SO WHAT ! Certainly nothing to waste any of your time worrying about or hiding from. If we’d spent as much time improving our own health and immune system as we do online wanking off to the Covid fear porn, we’d be much better off.