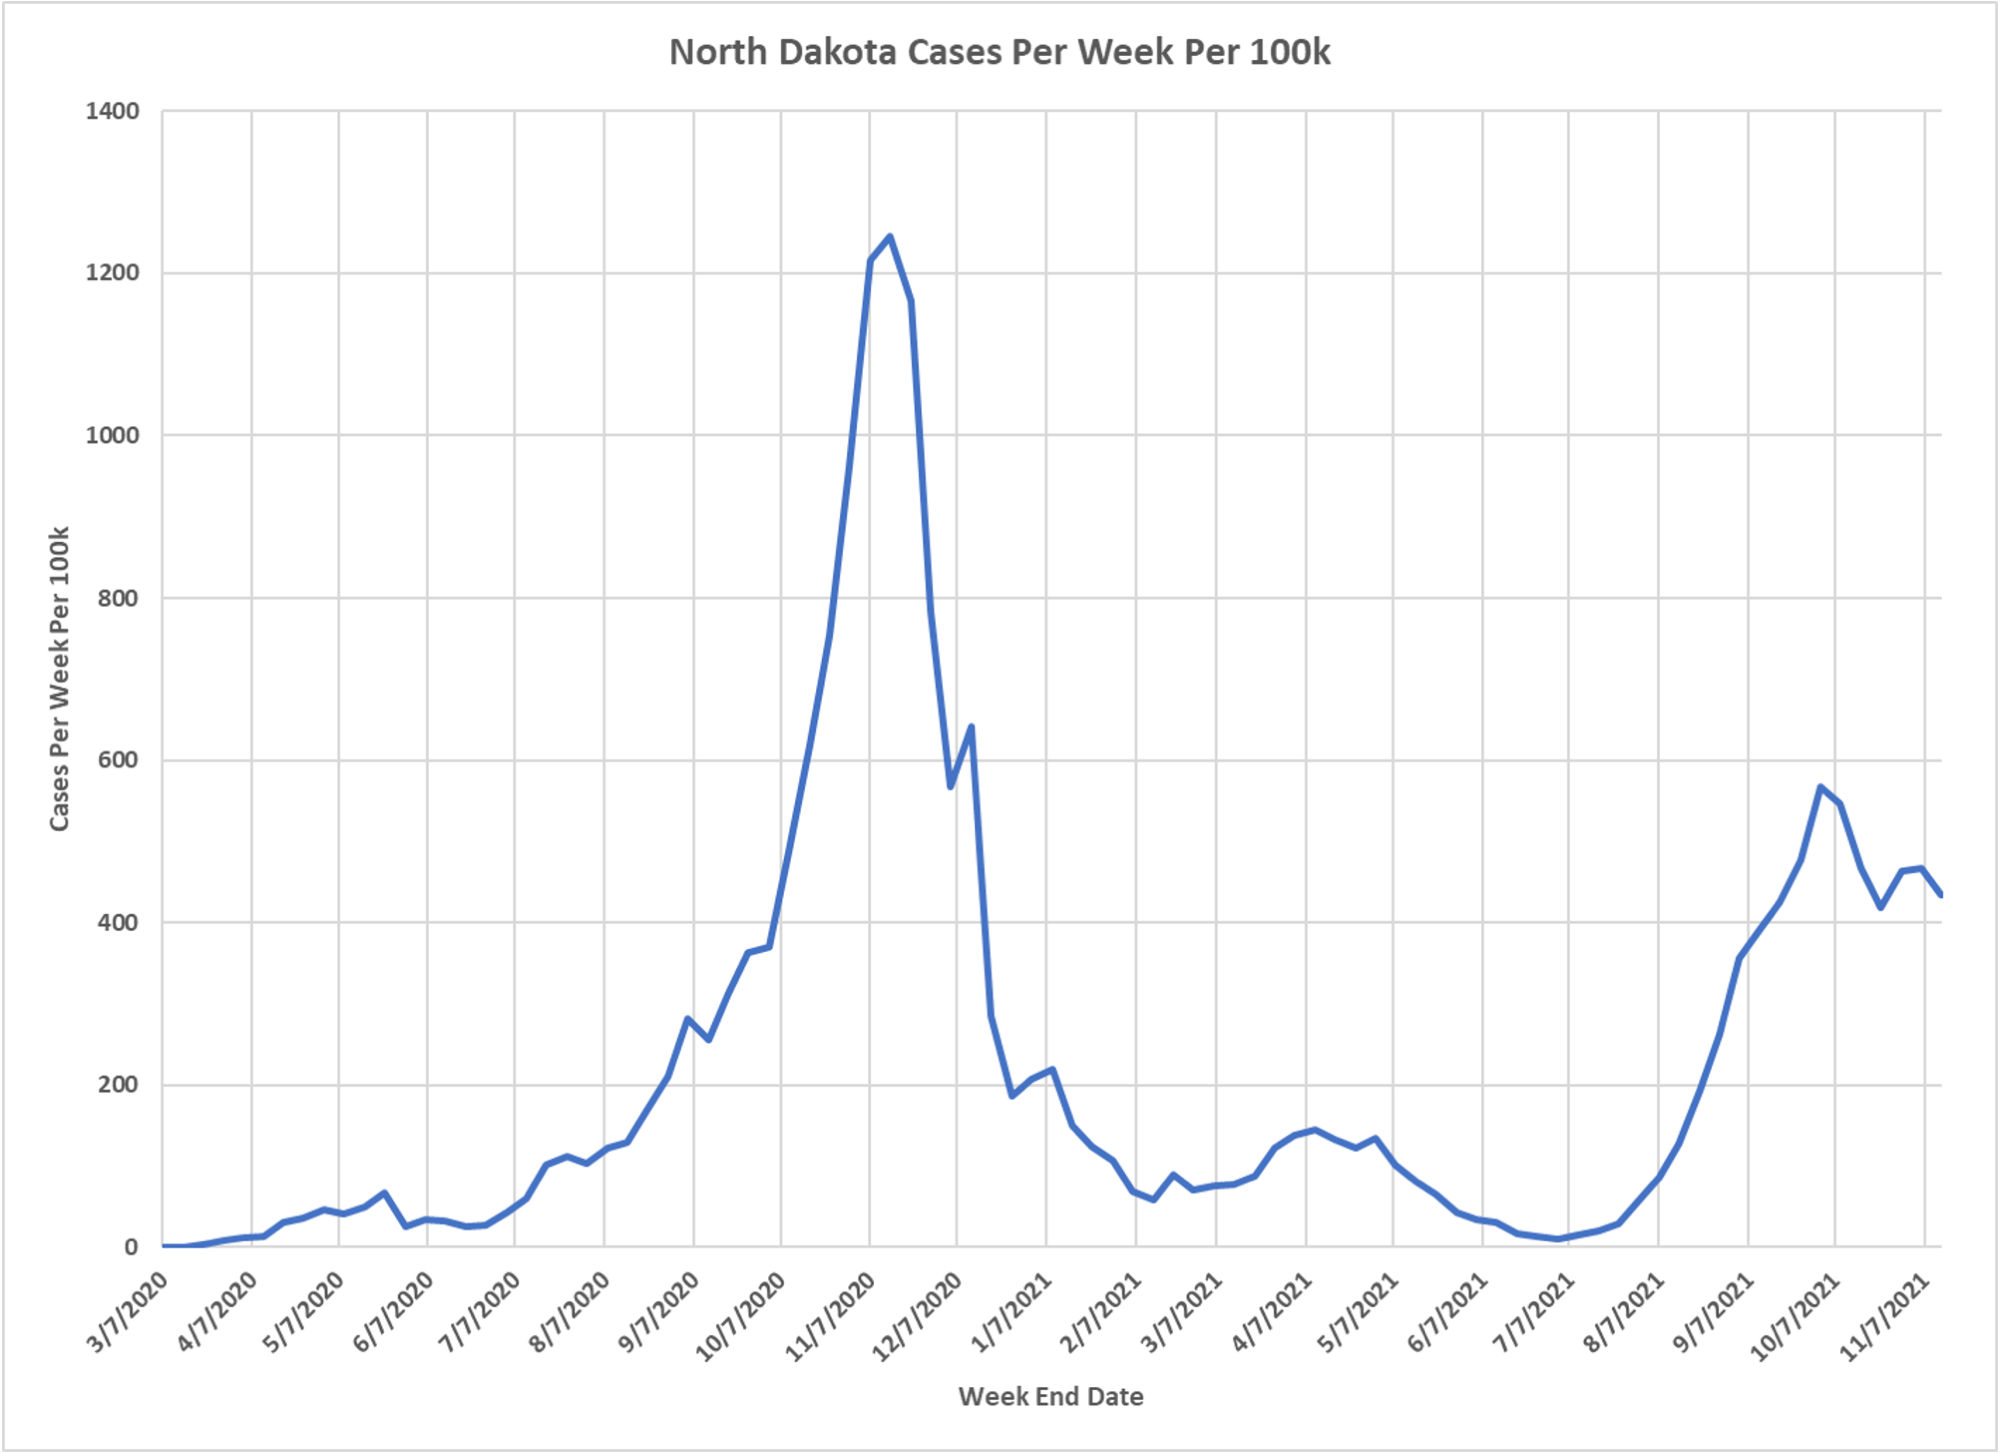
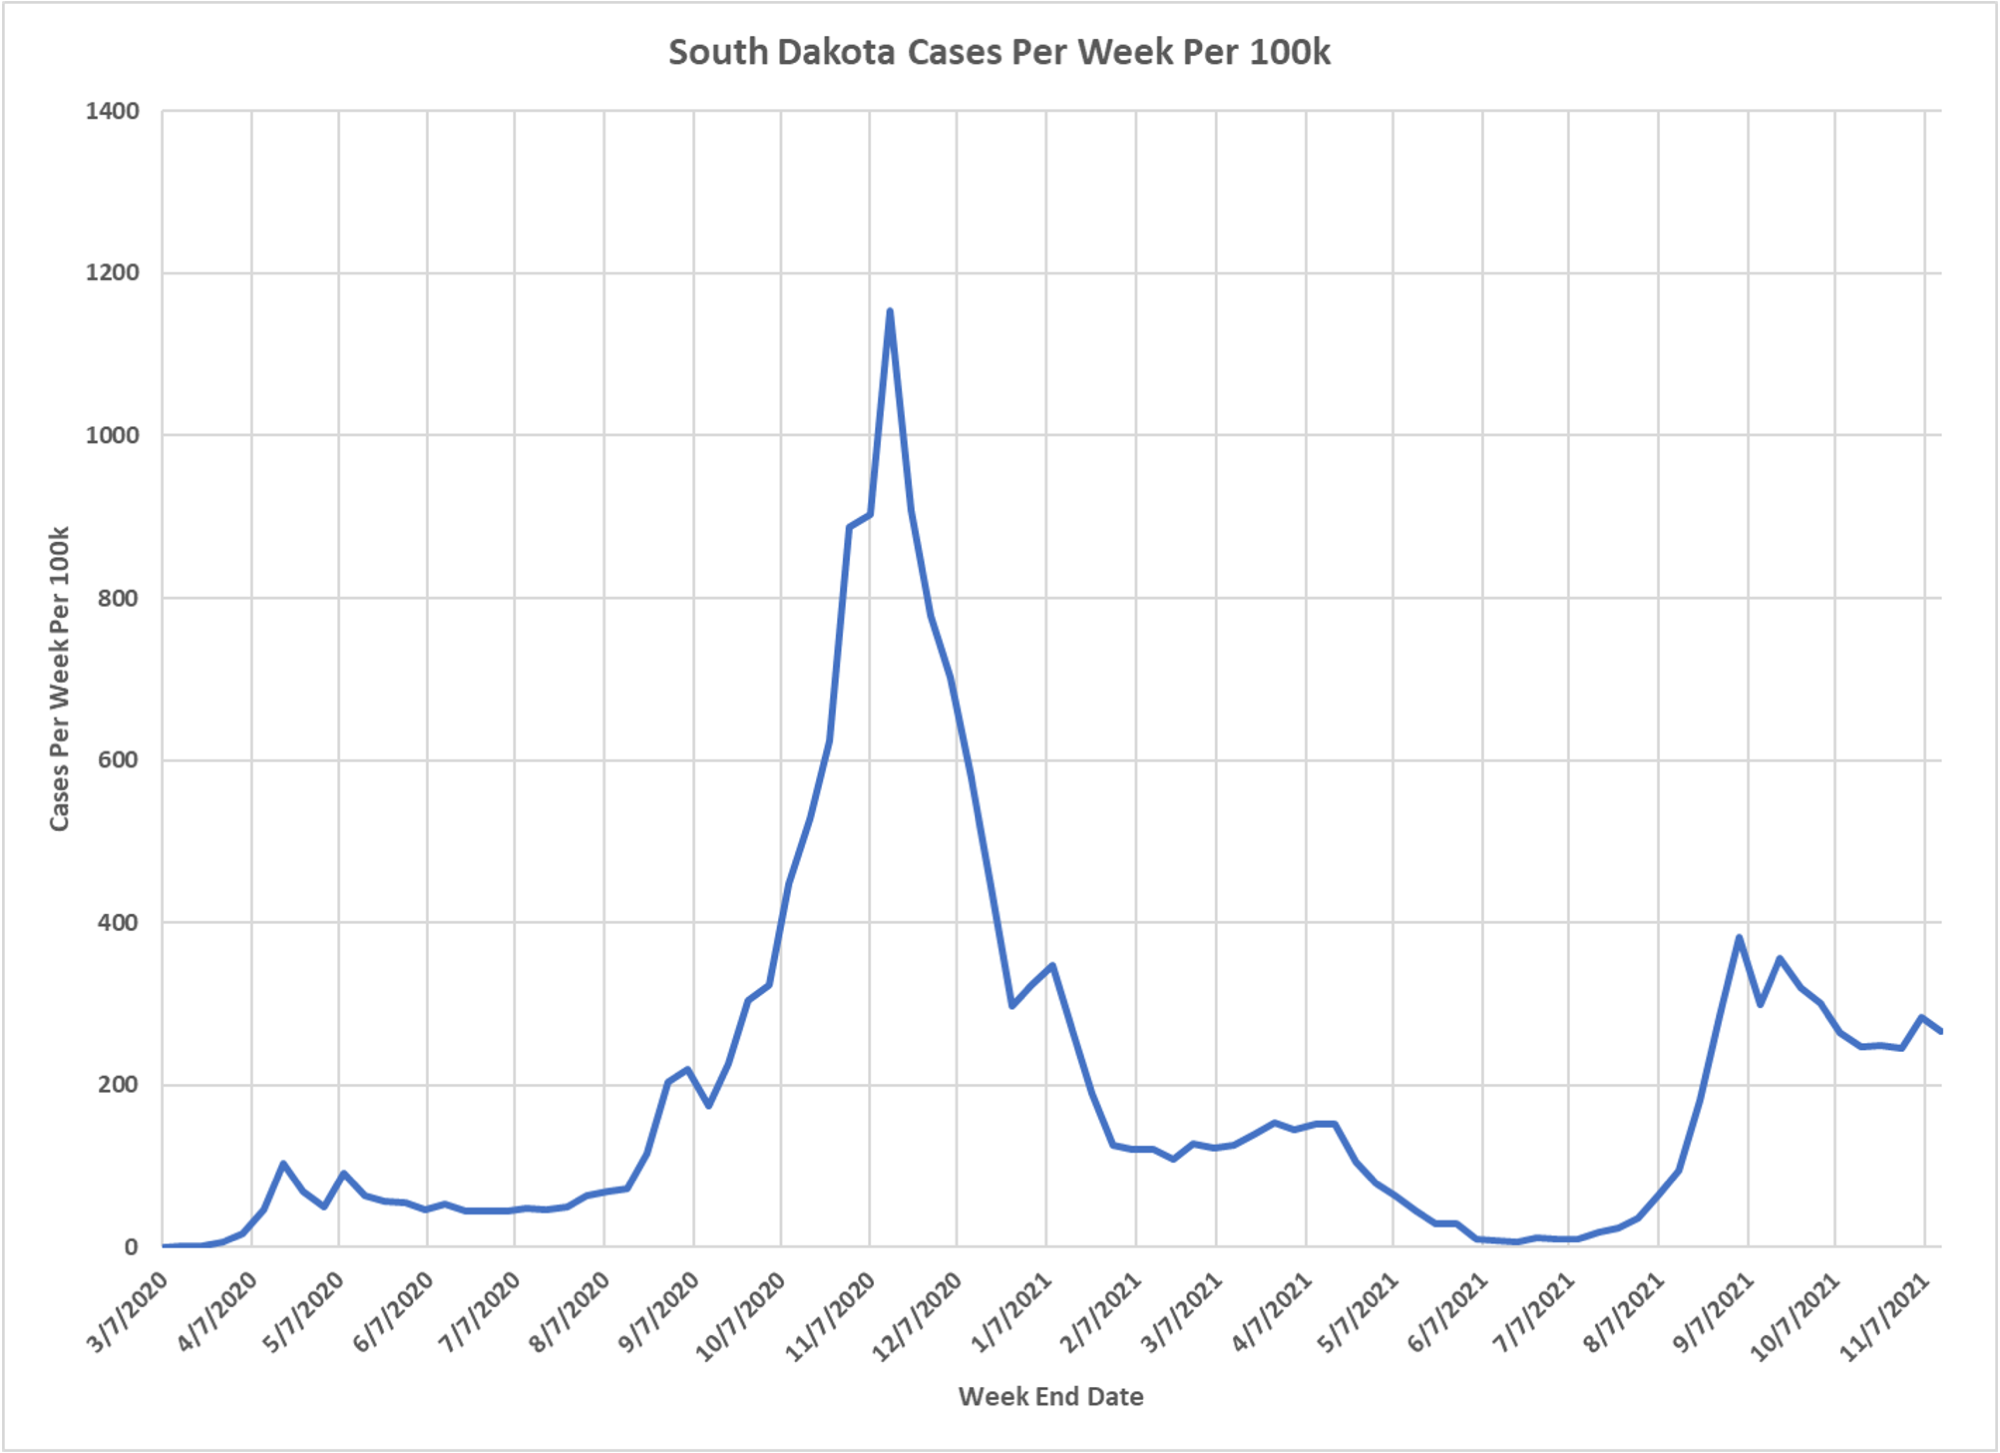
It isn’t just us, although there is some variation. And several other states show that earlier head fake down. But North Dakota and South Dakota, which have very high percents of population infected and/or vaxed, aren’t participating as much. Thanks to Dave Dixon. Dave’s notes:
1. The case data is taken from a CDC data base here: https://data.cdc.gov/Case-Surveillance/United-States-COVID-19-Cases-and-Deaths-by-State-o/9mfq-cb36
2. On the web page for this data base there are several disclaimers regarding accuracy and completeness of the data. Given these concerns it might be best to consider these charts as indicative of the overall trends in each state, rather than as a definitive accounting of cases over time.
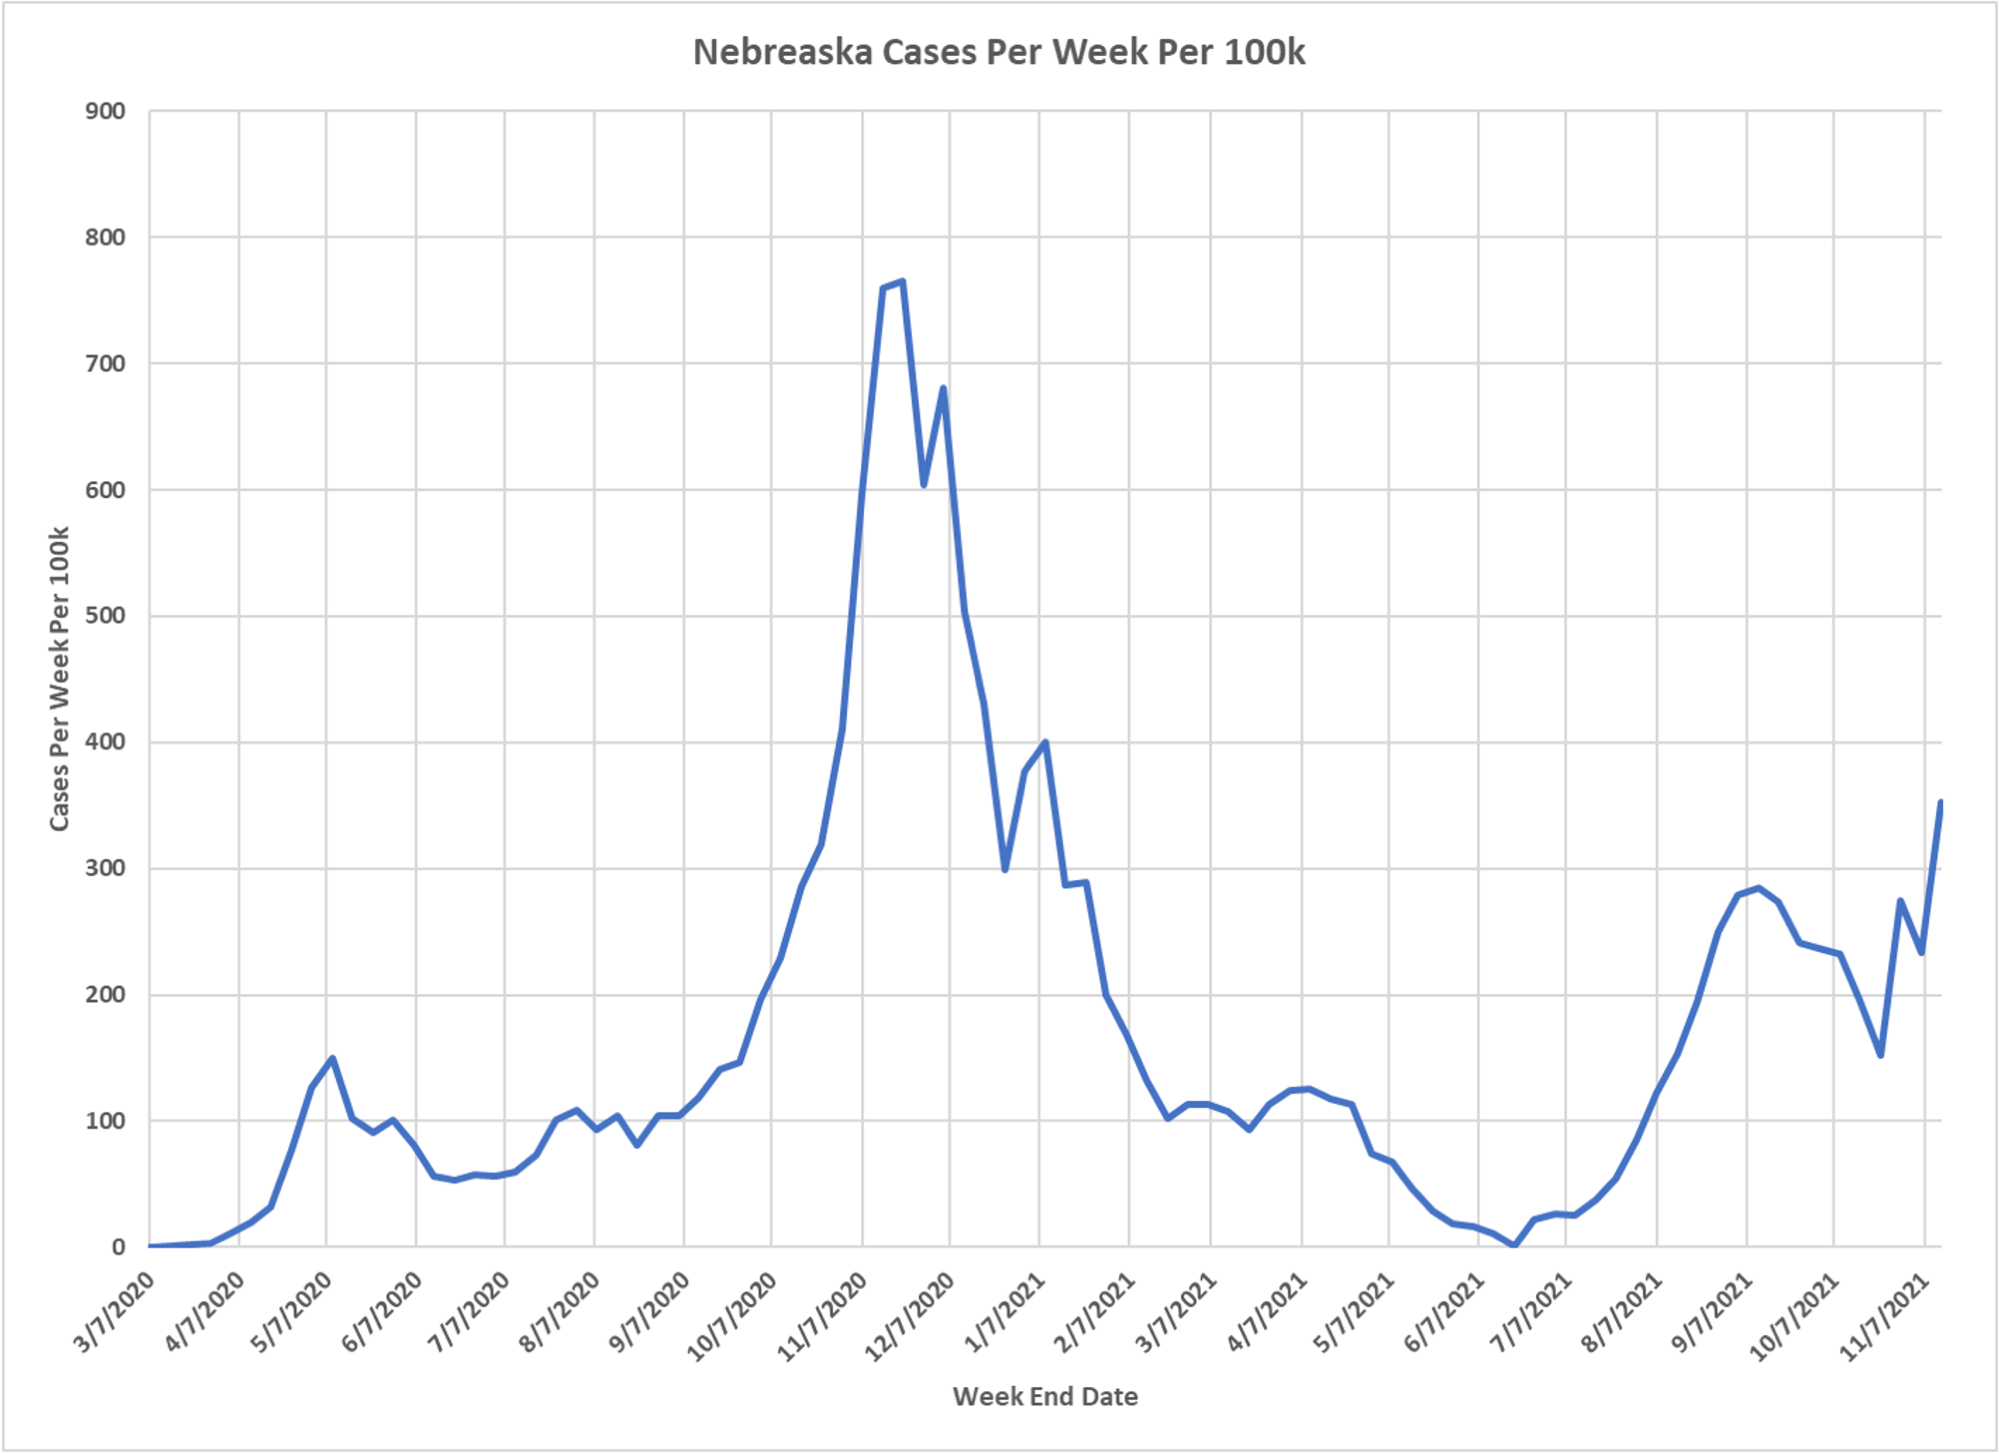
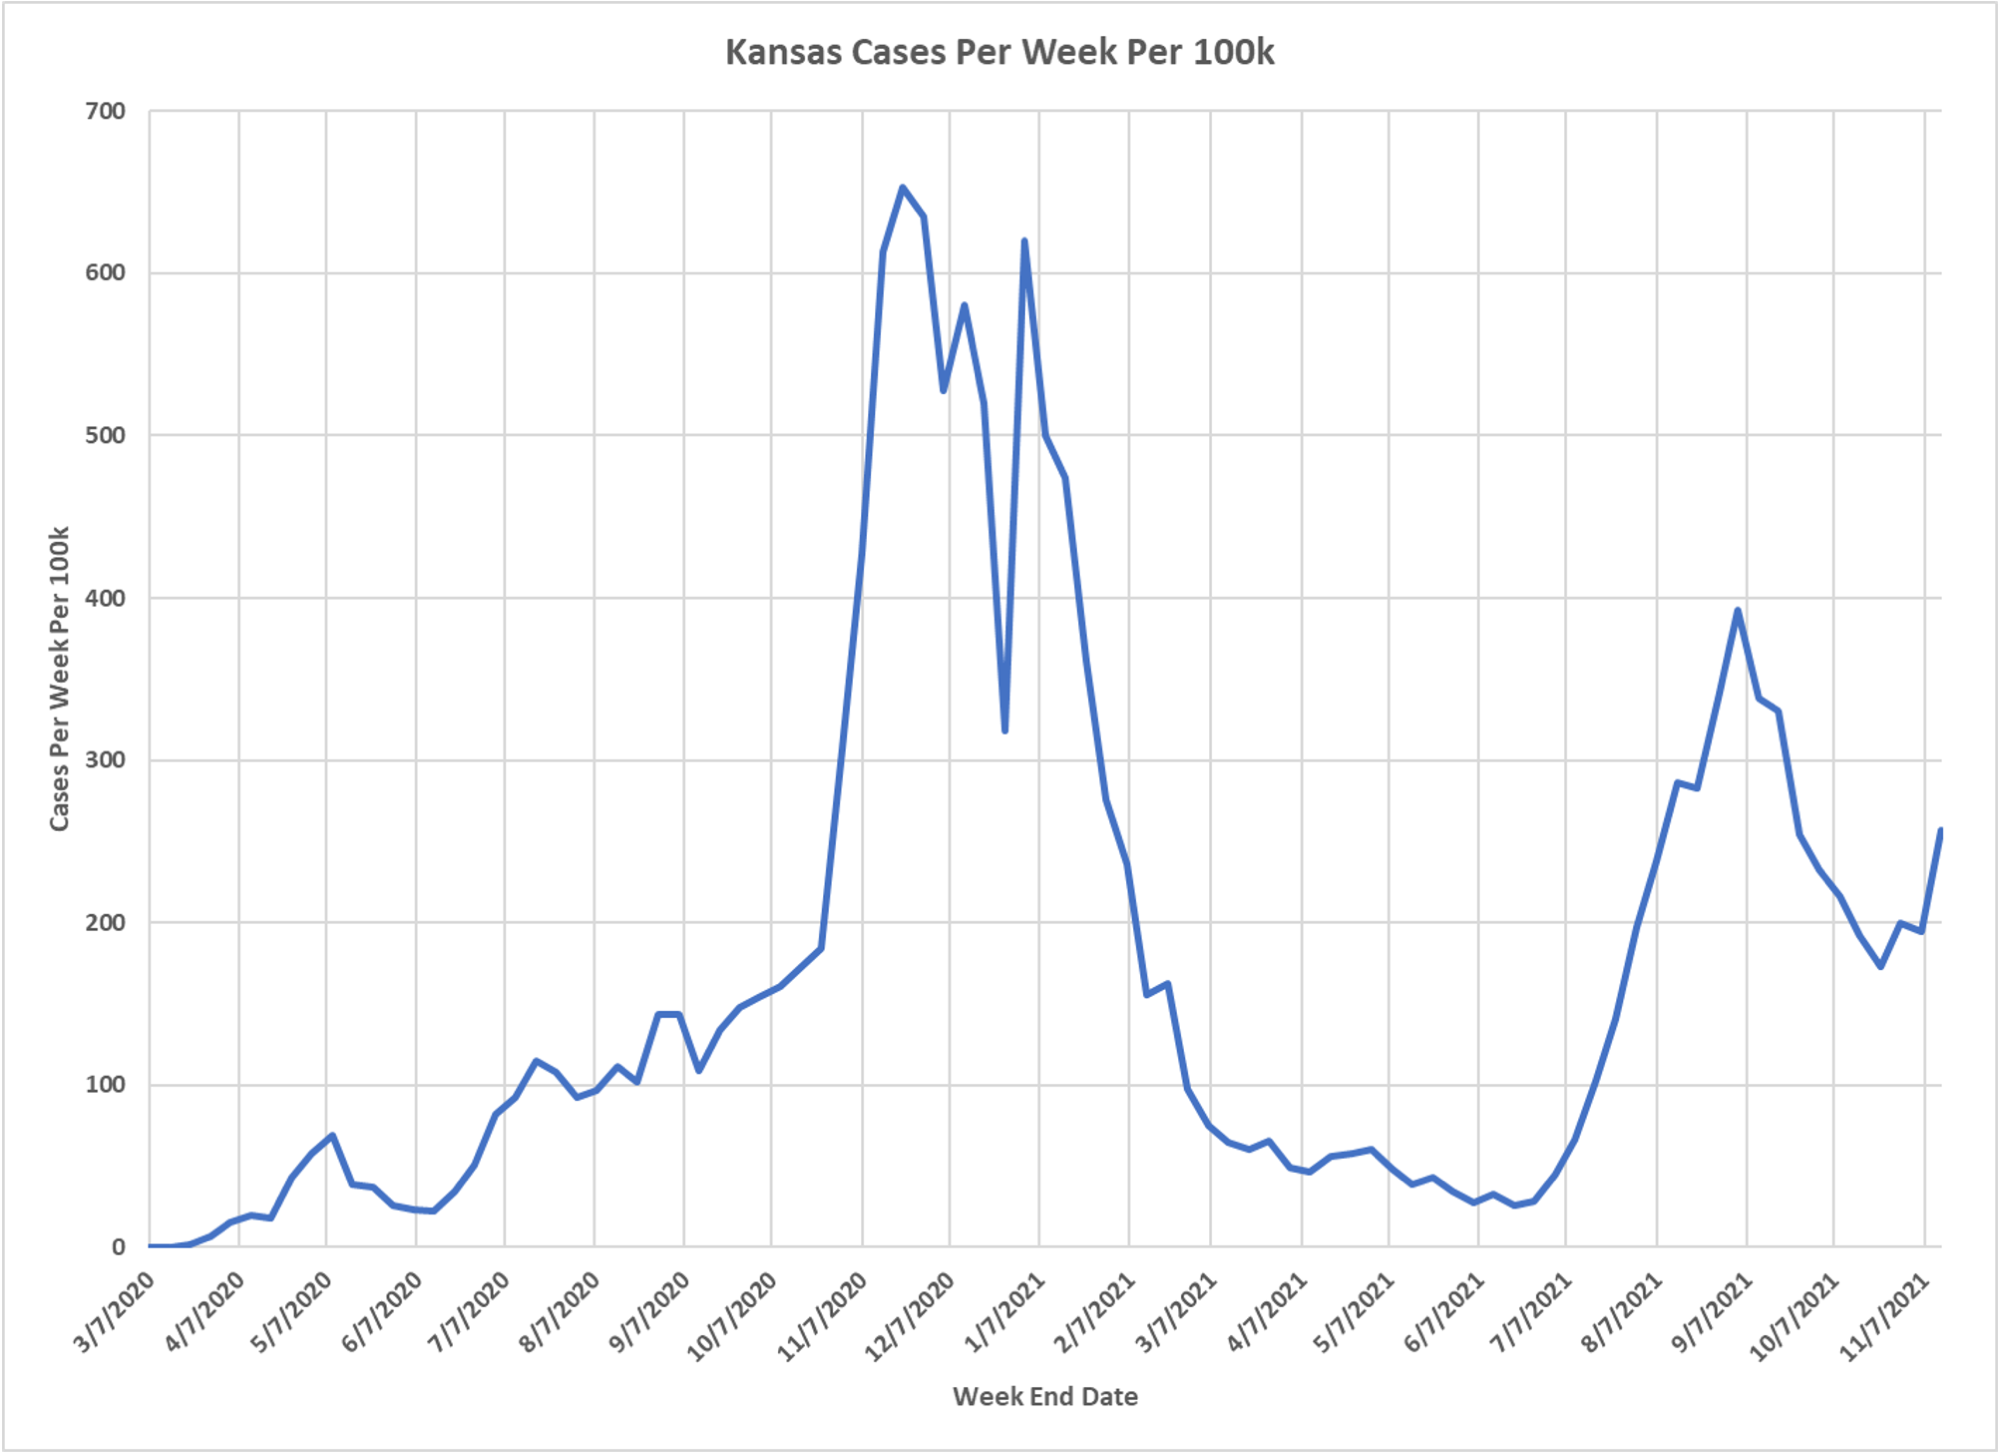
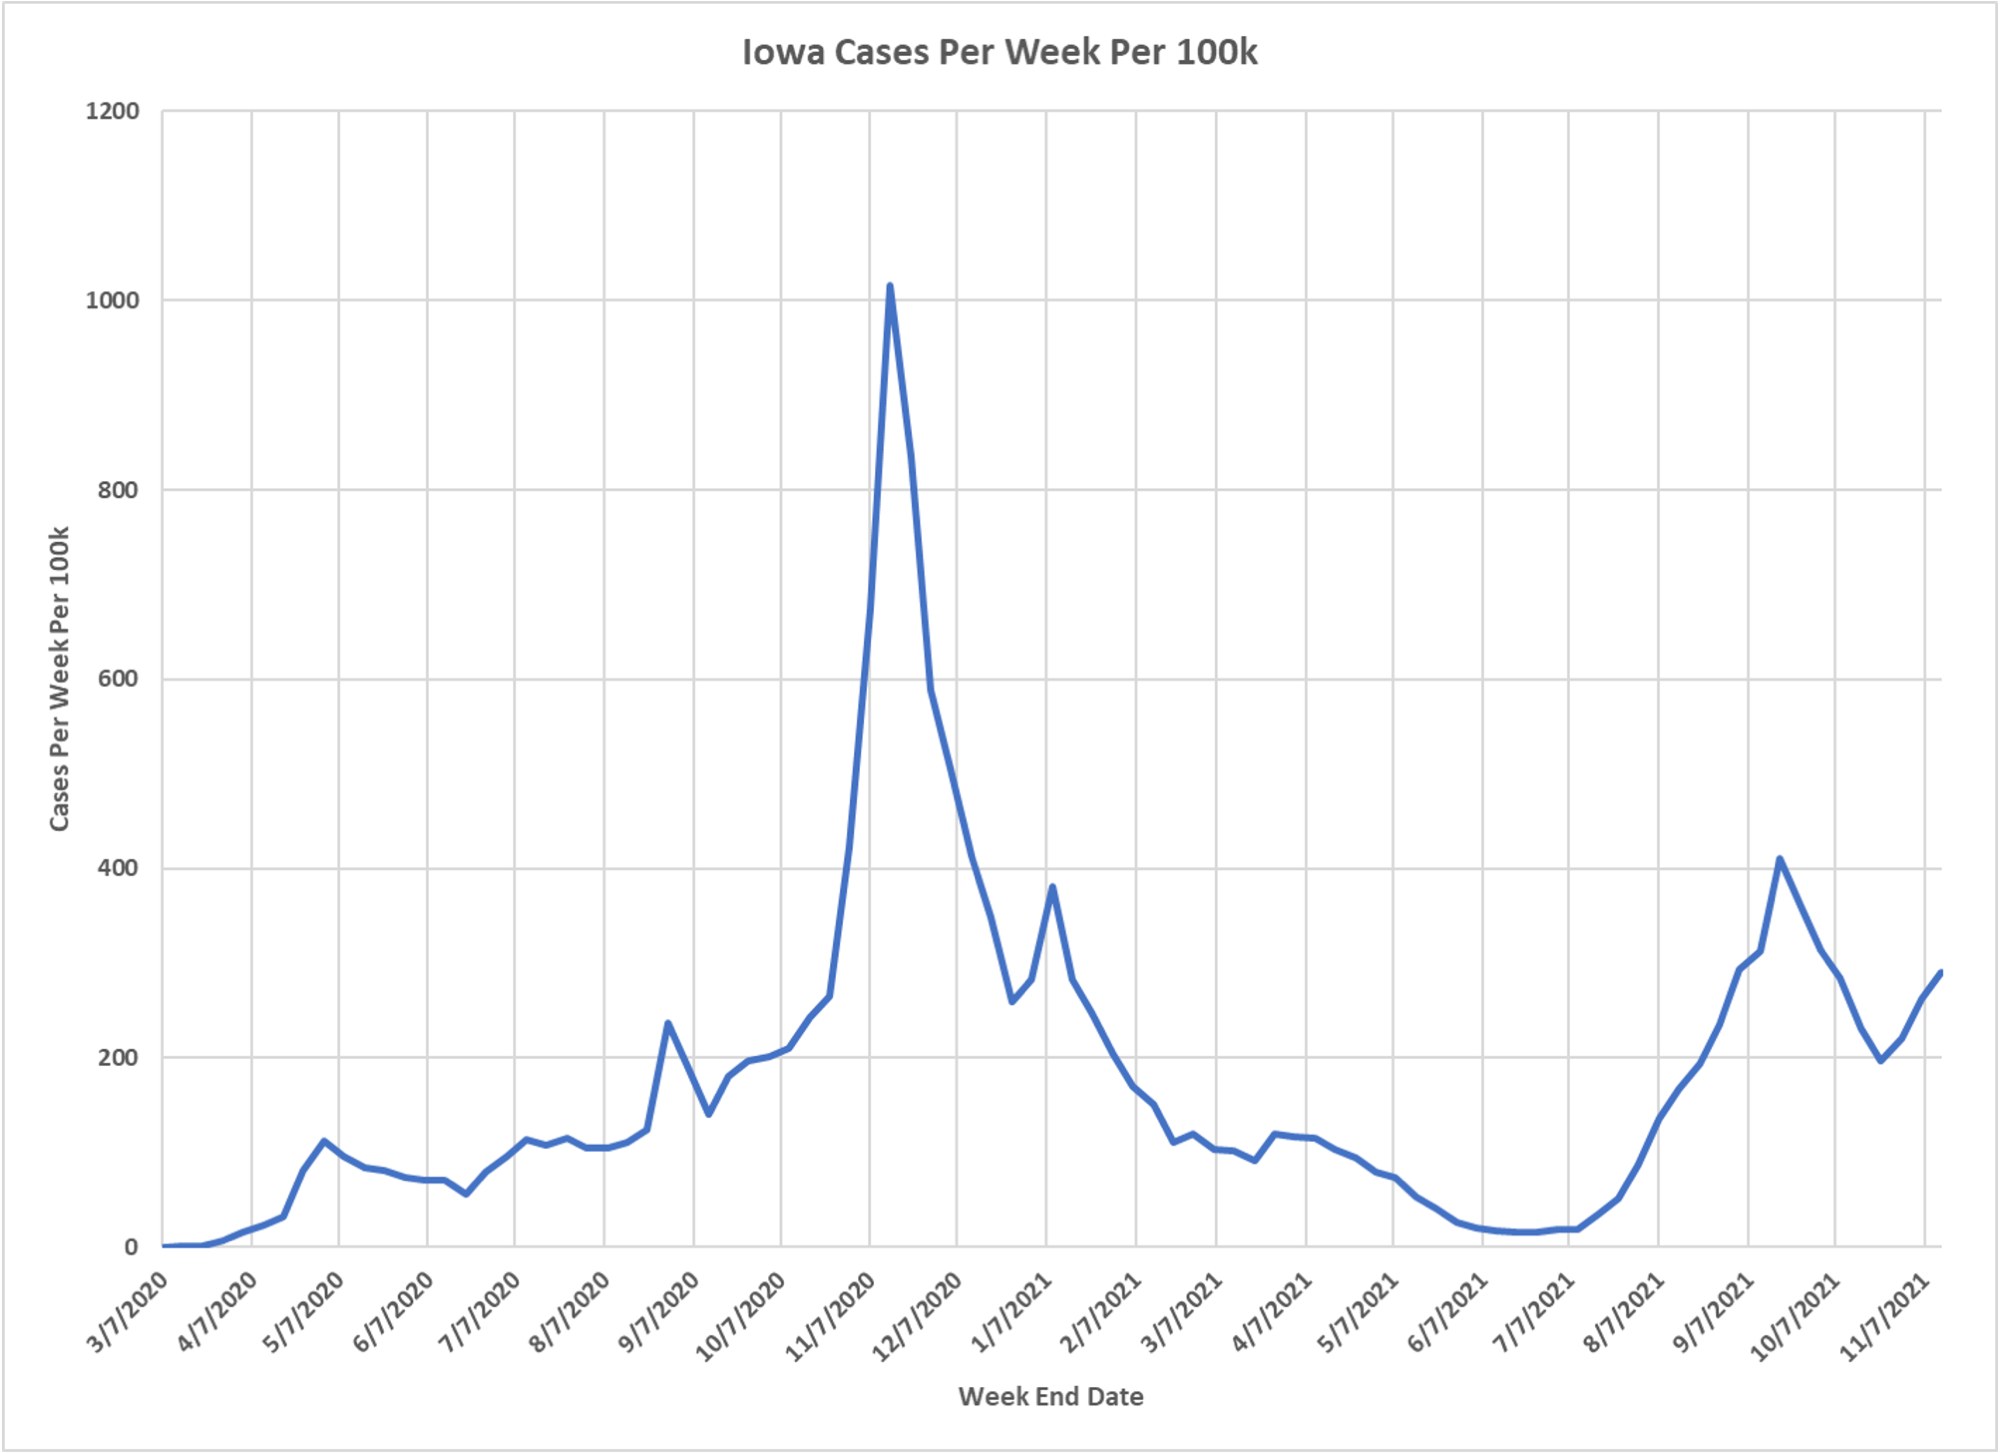
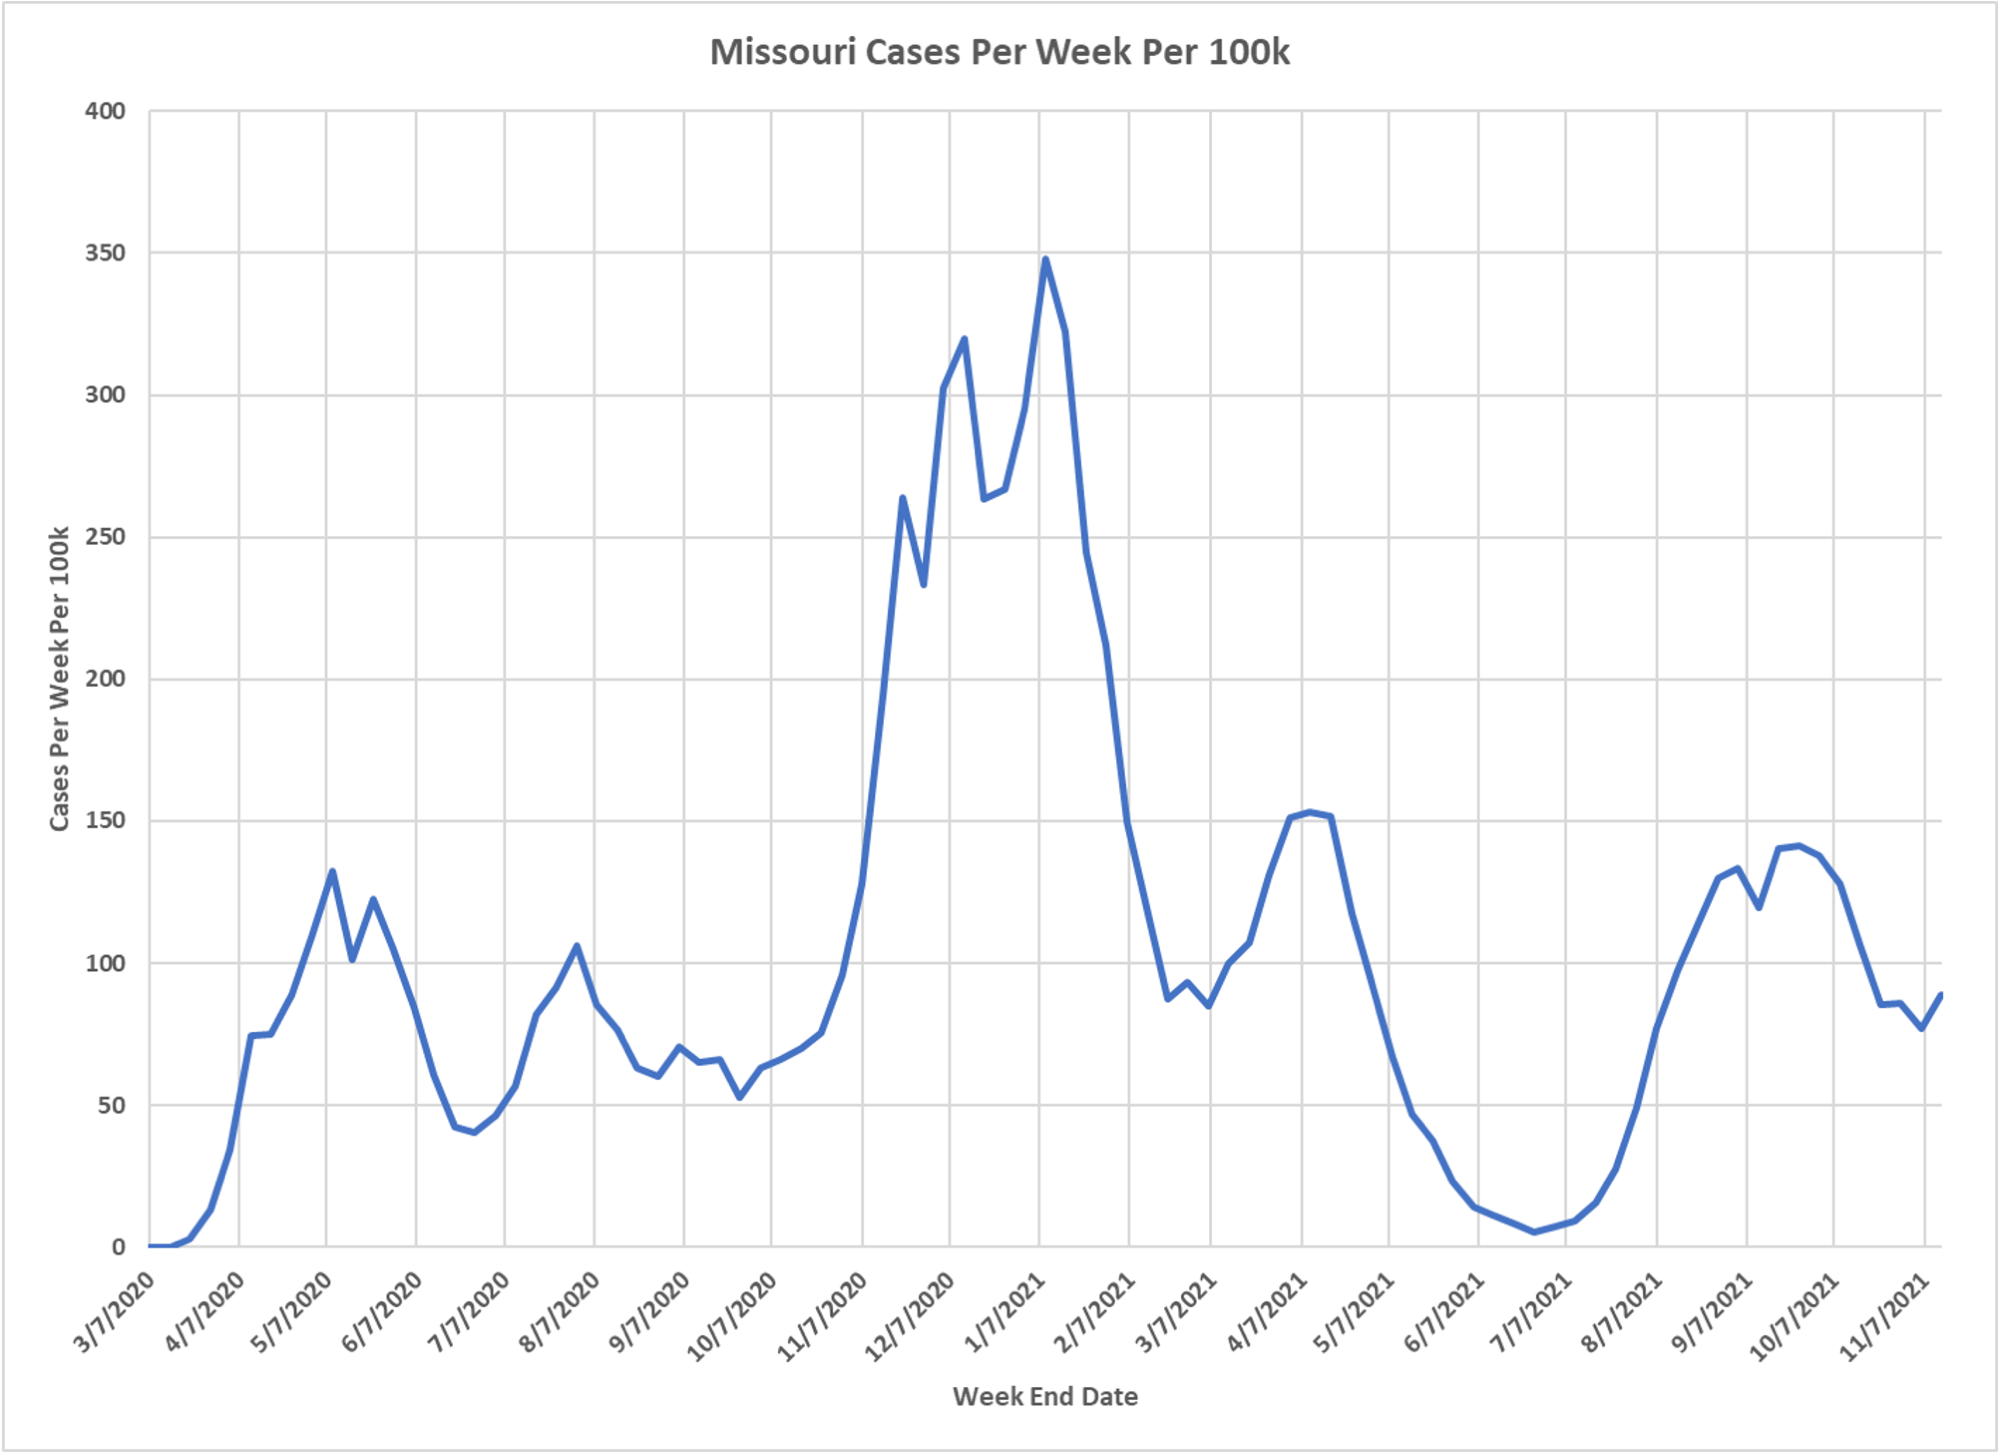
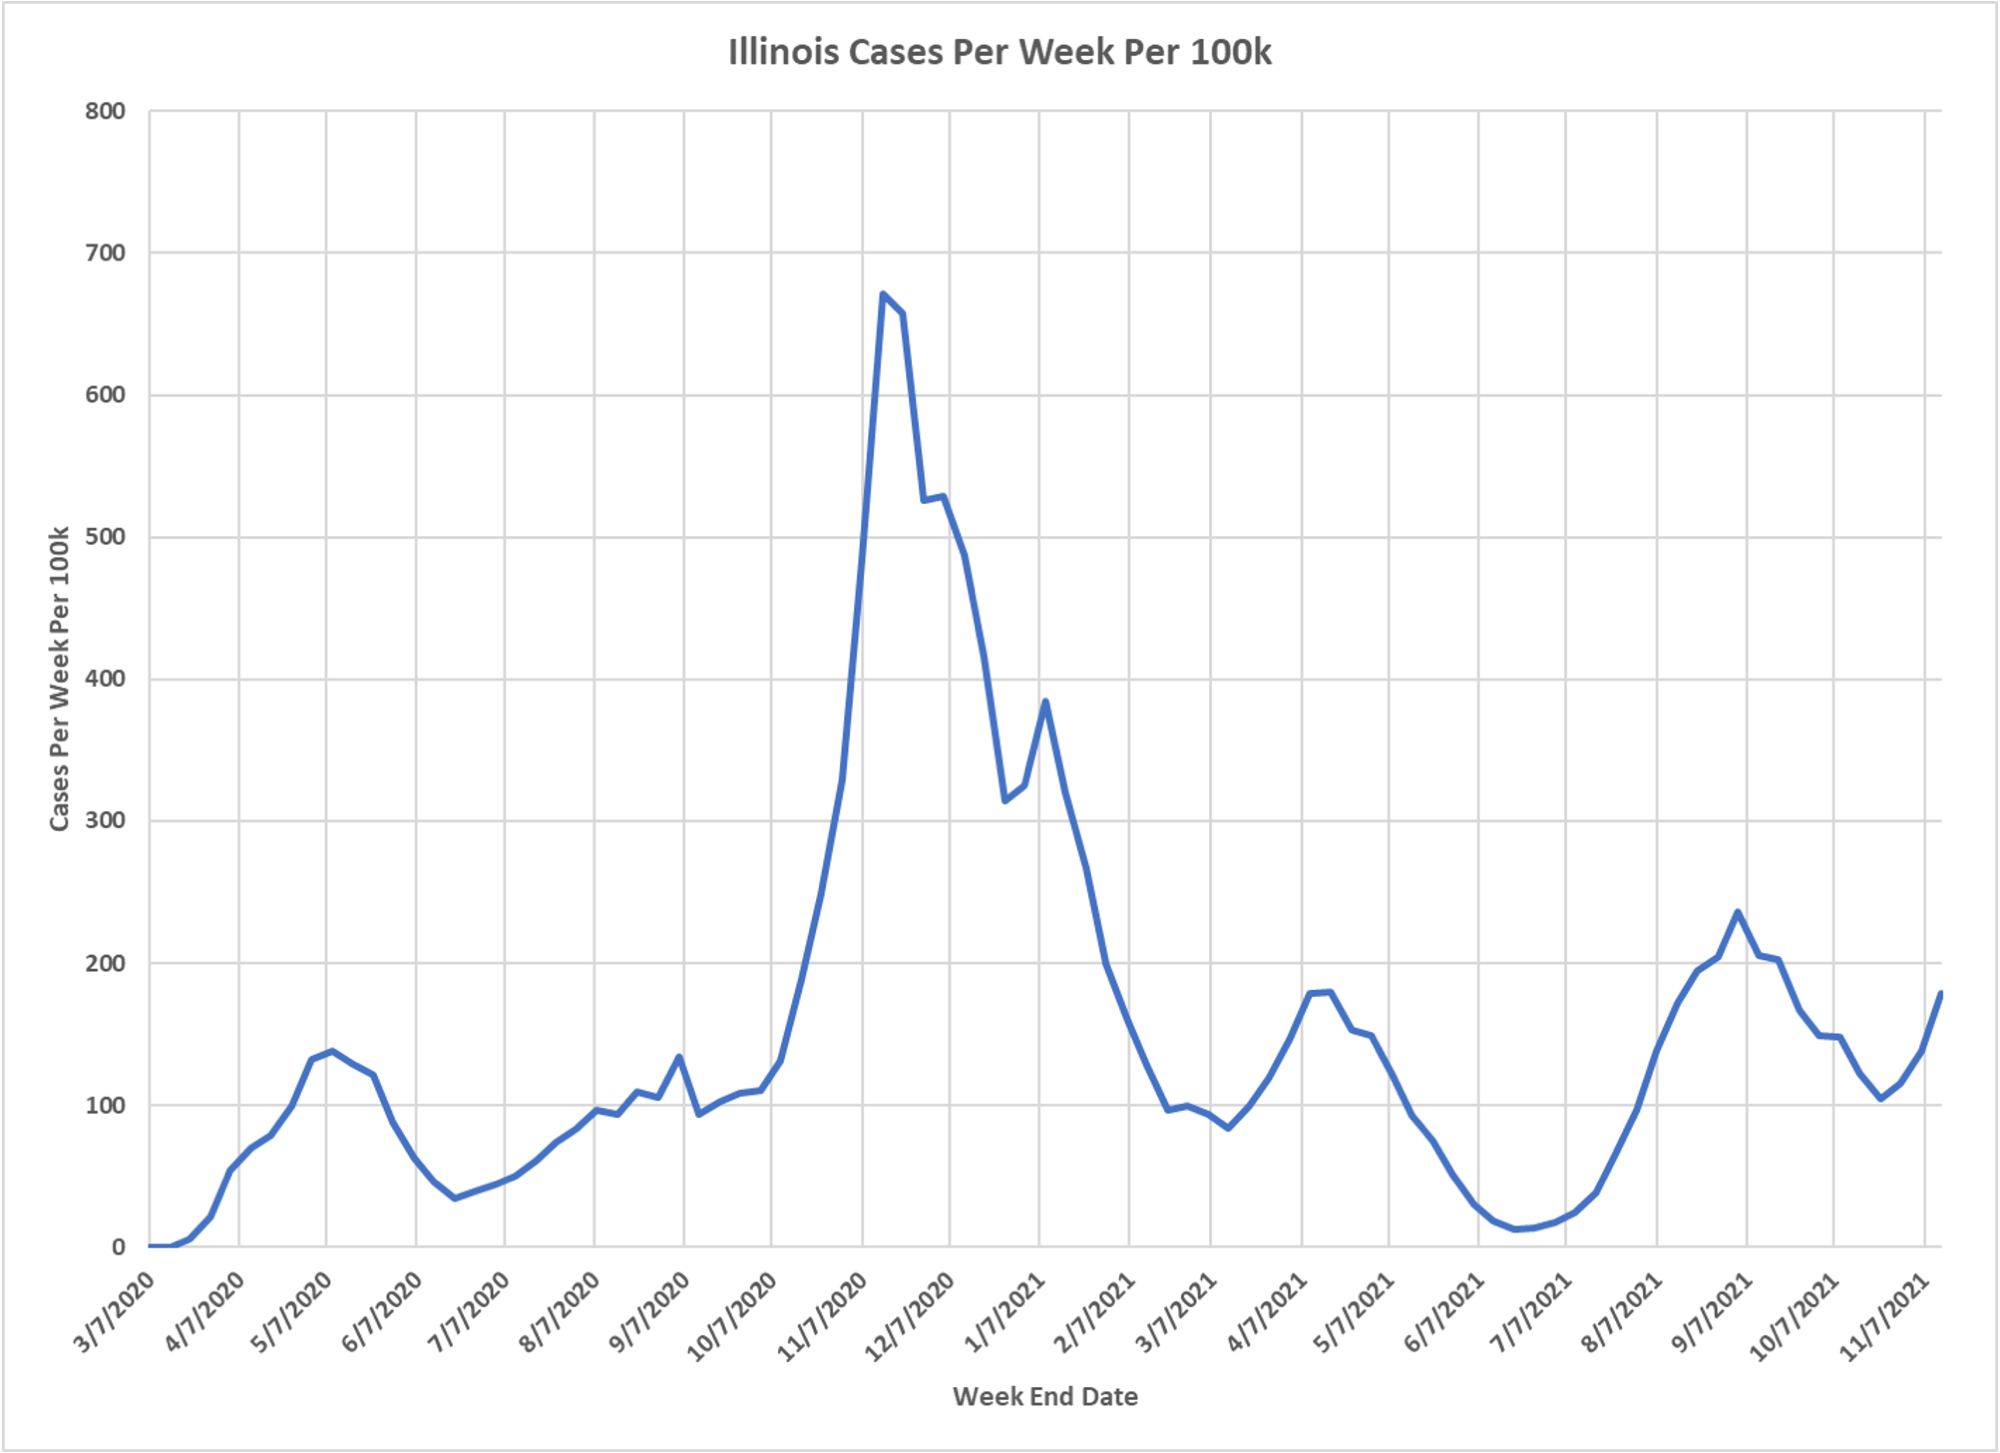
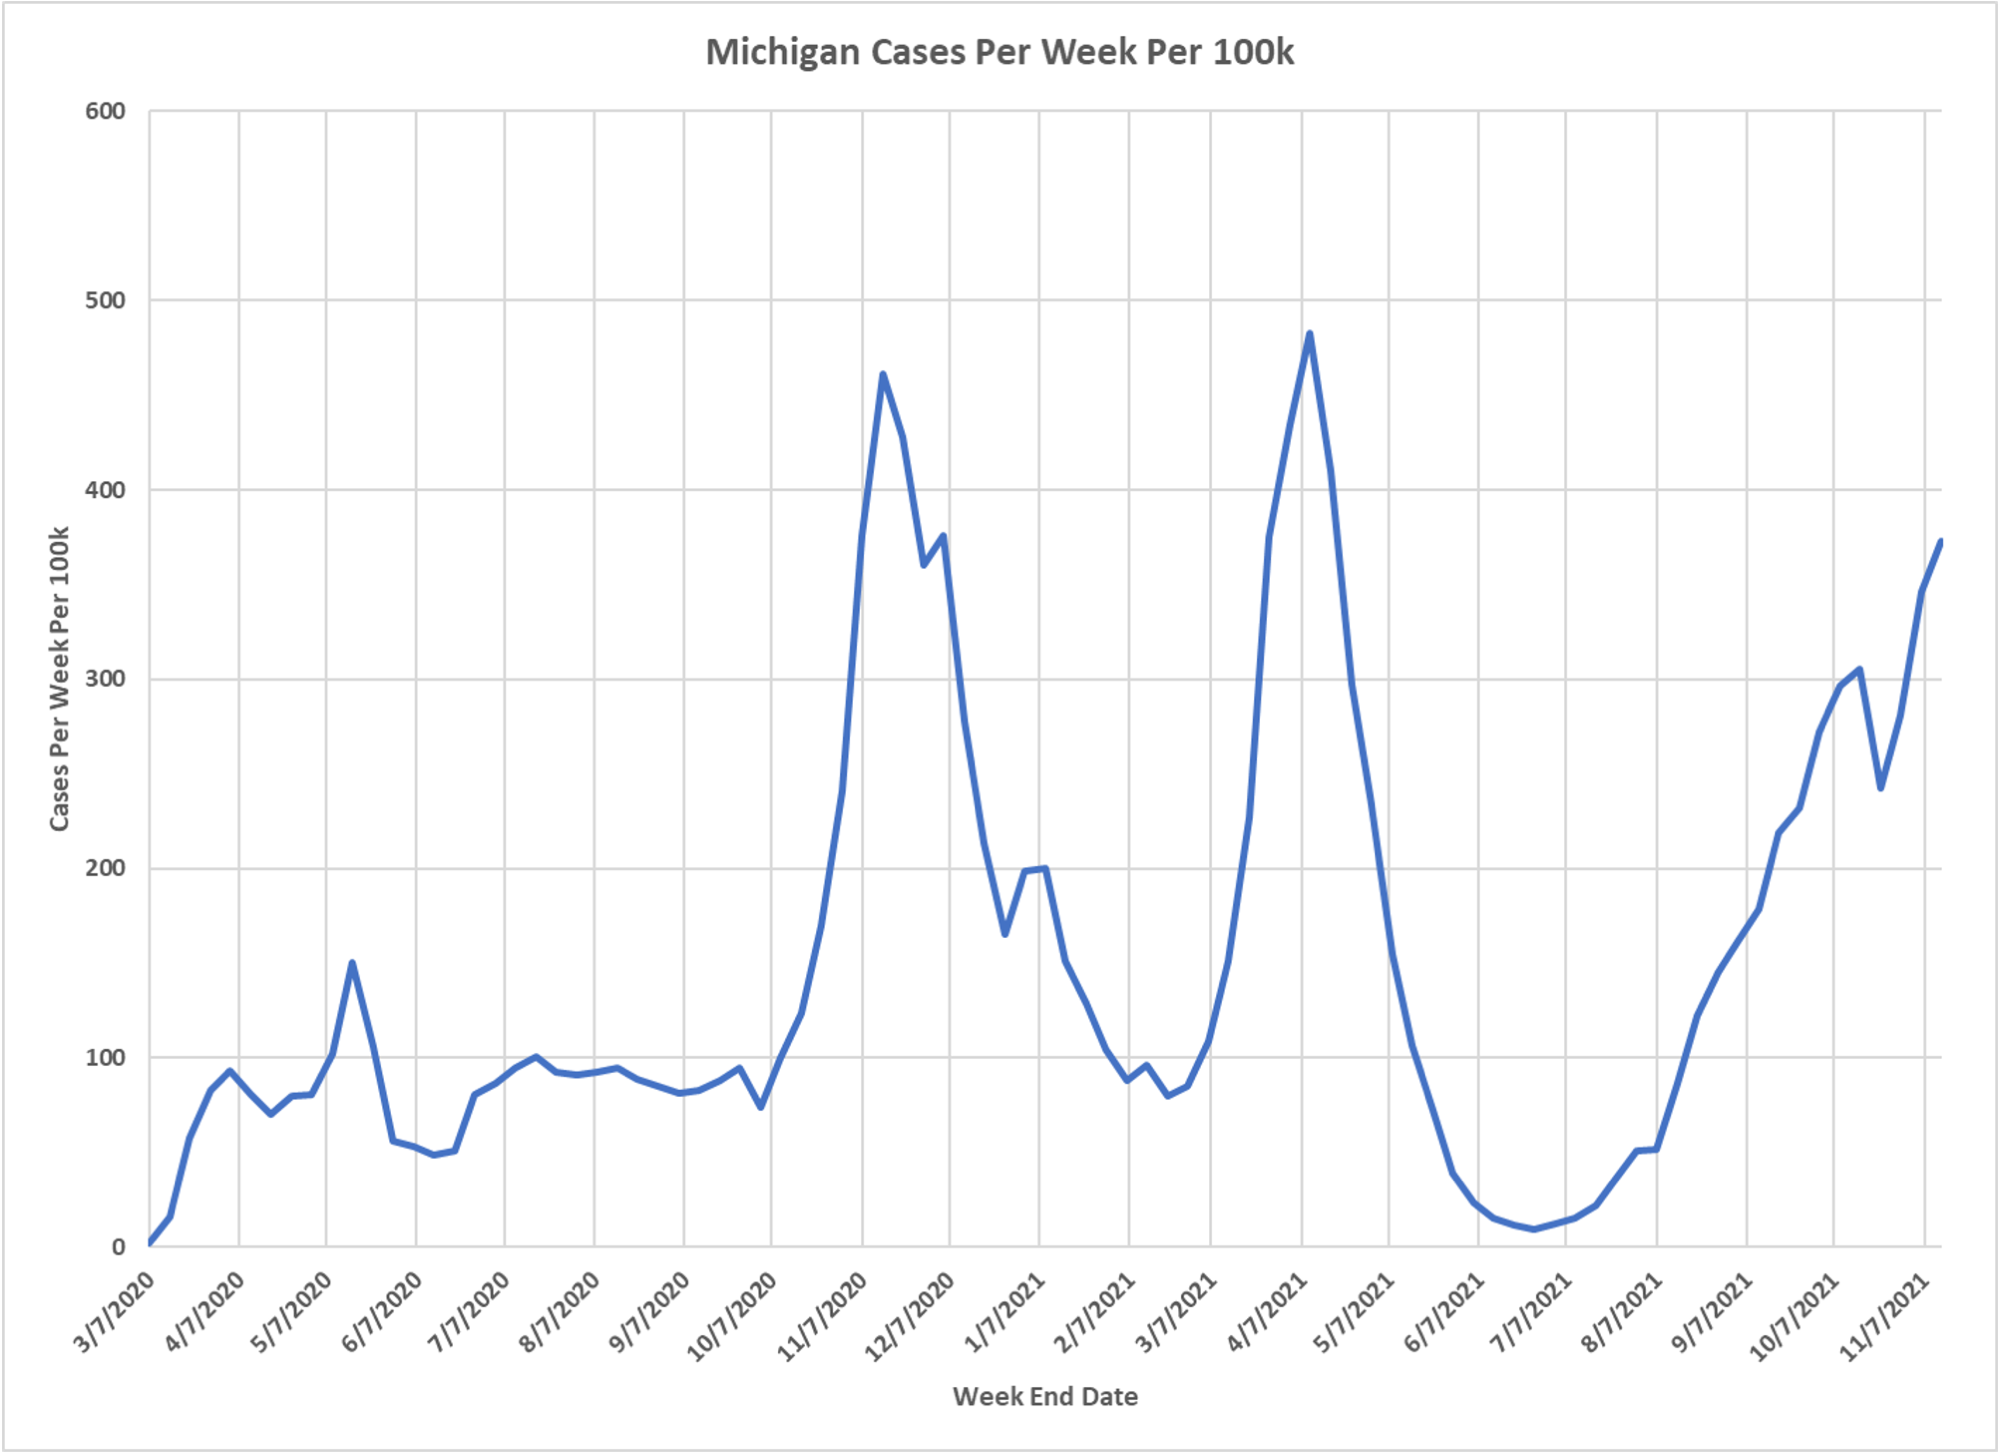
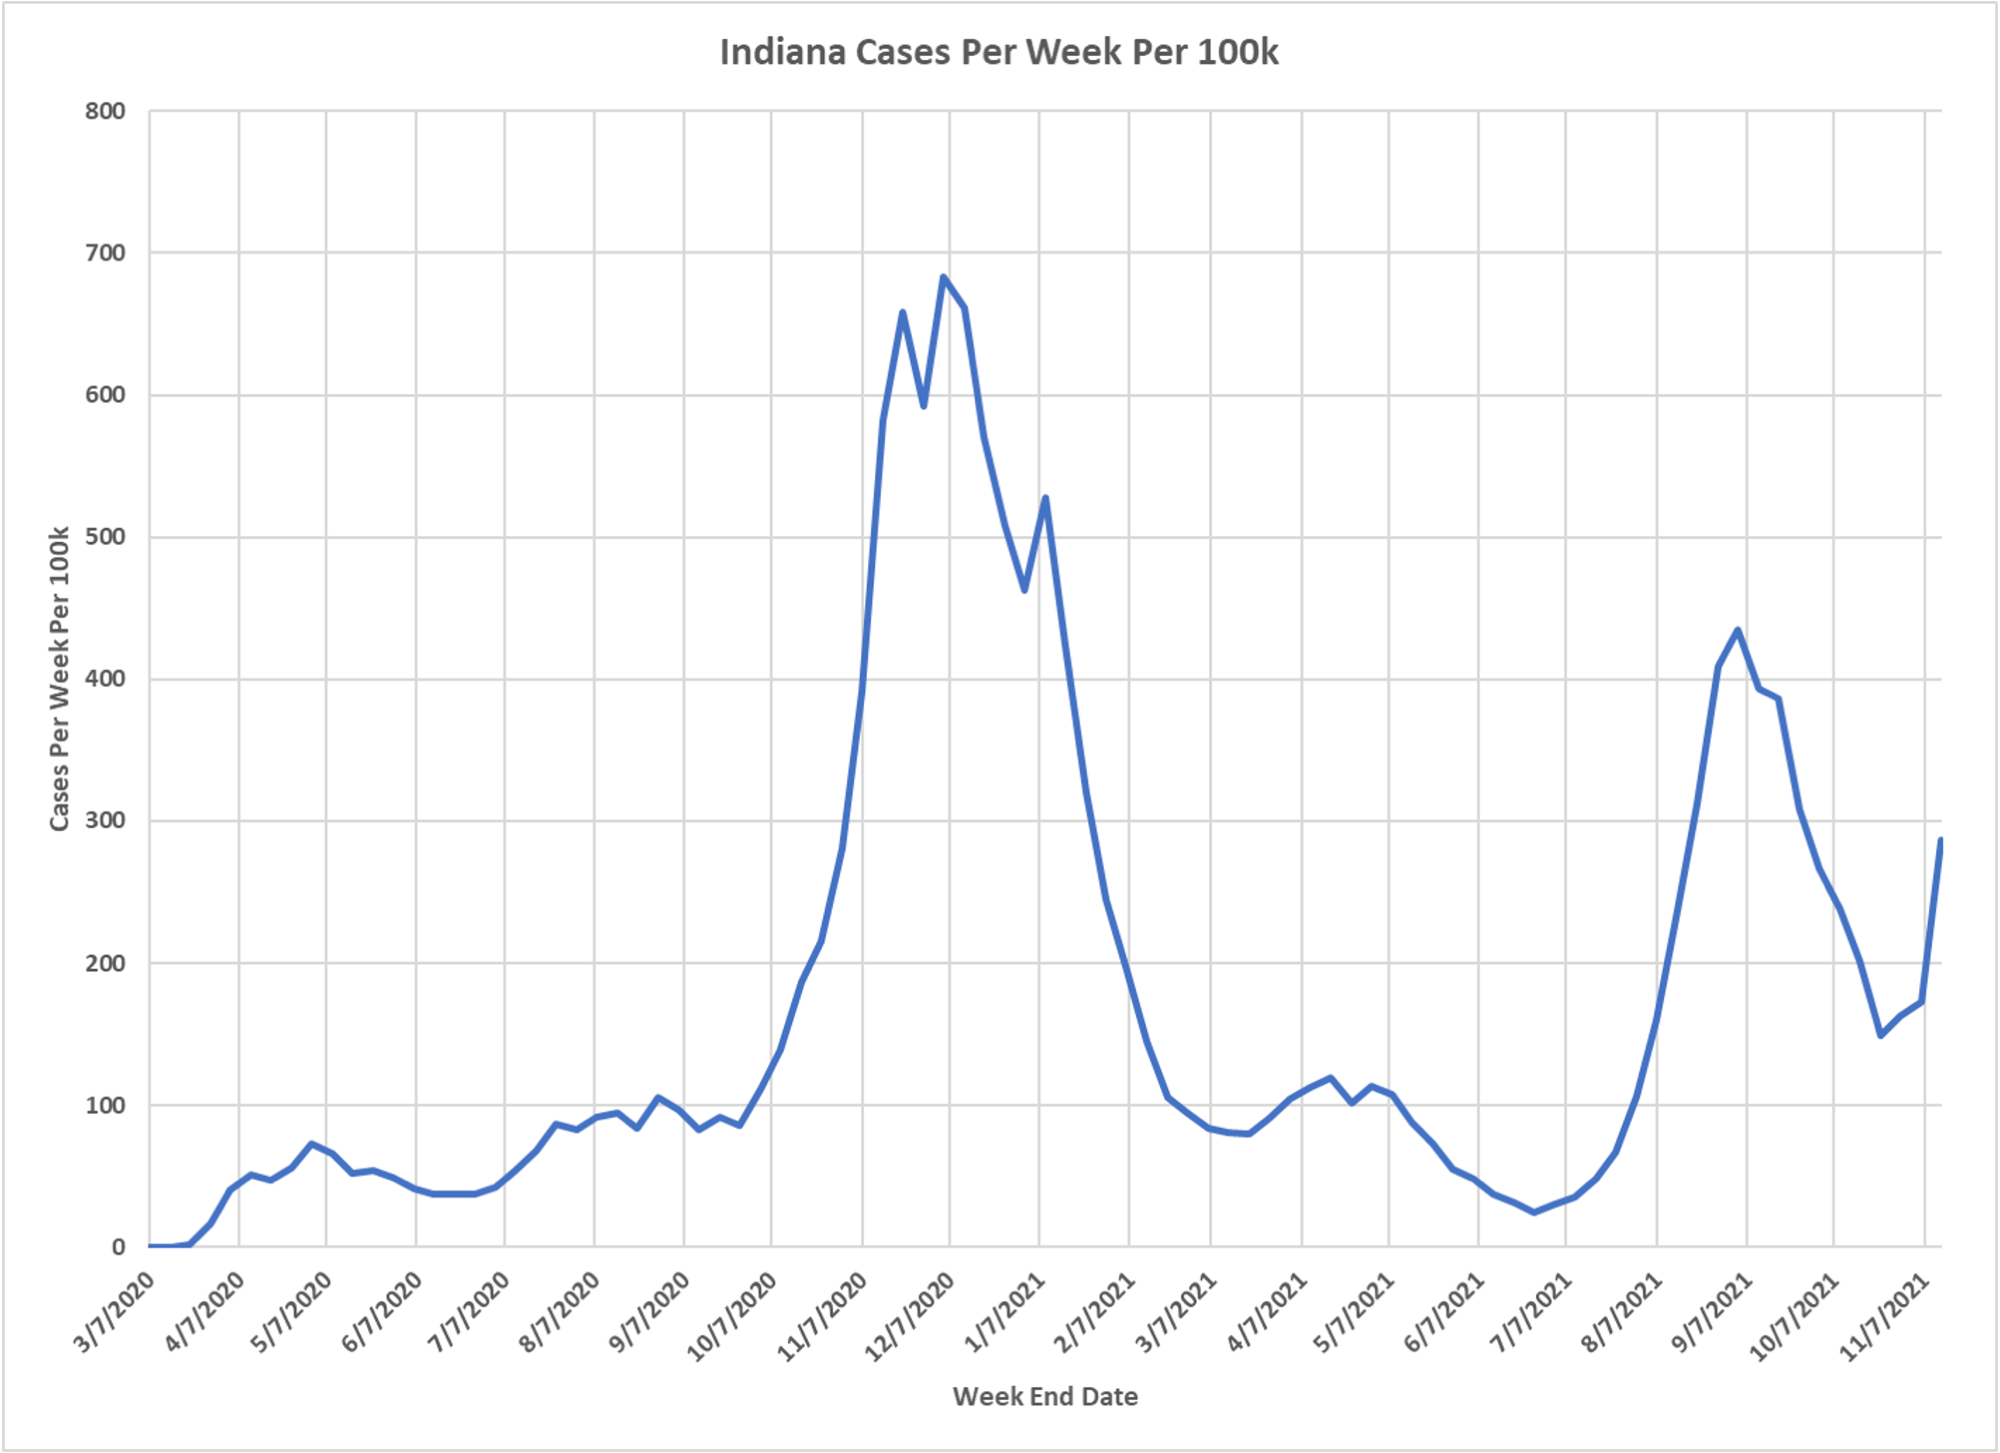
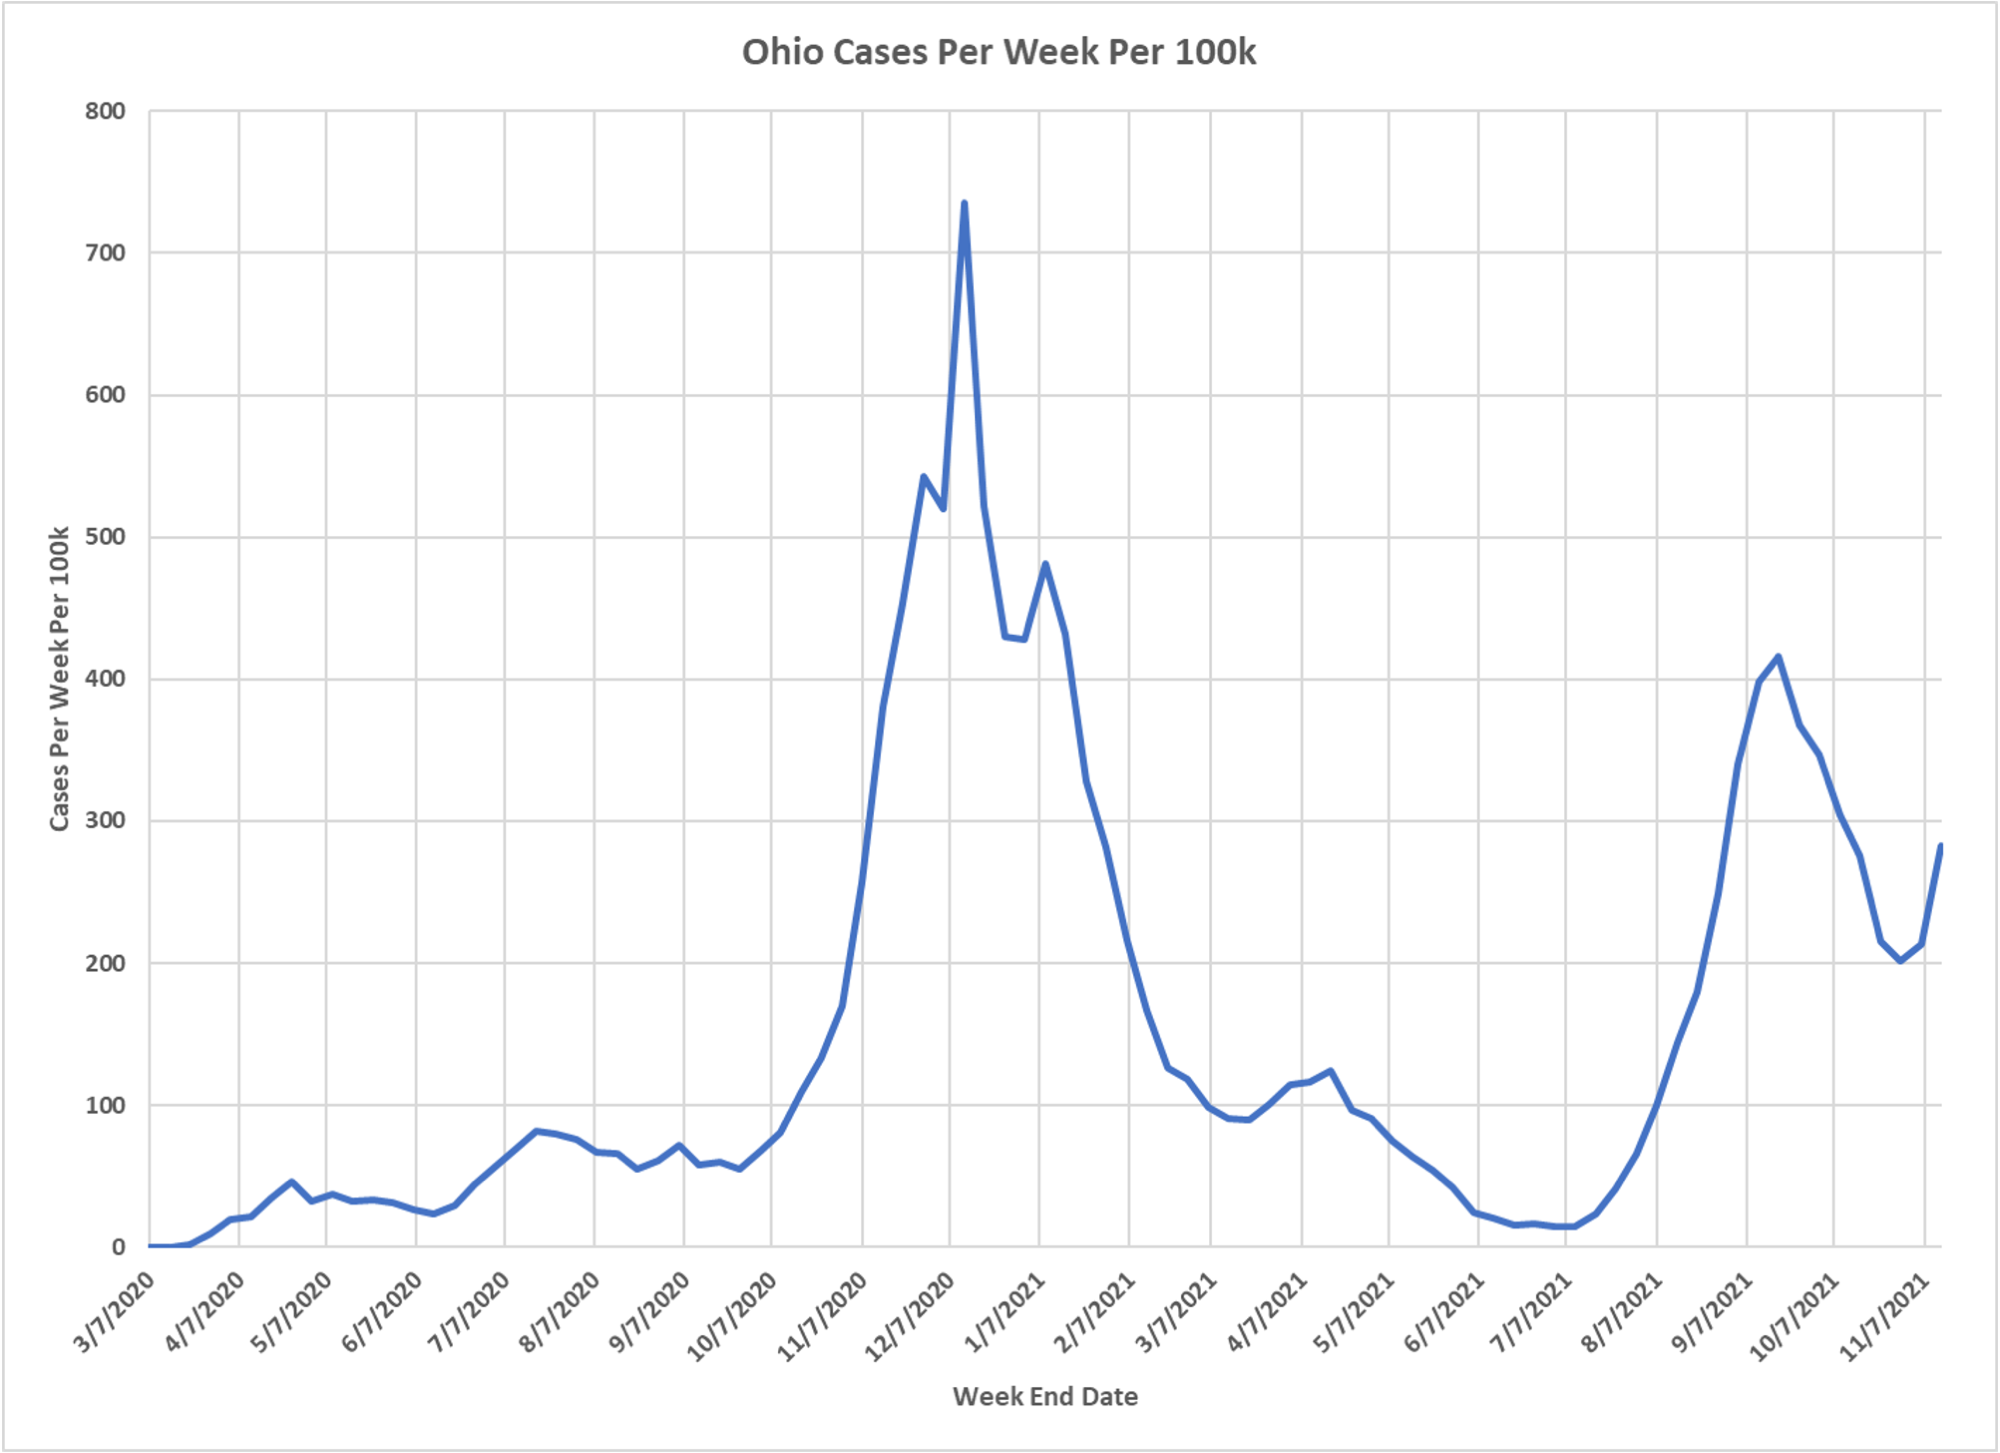
3. The data base contains cumulative cases by state by week. I am taking differences between cumulative totals to get cases per week, and then dividing by total state population and multiplying by 100,000 to get cases per week per 100k.
4. State populations are taken from the US Census Bureau for July 1, 2019 here: https://www2.census.gov/programs-surveys/popest/tables/2010-2019/state/totals/nst-est2019-01.xlsx
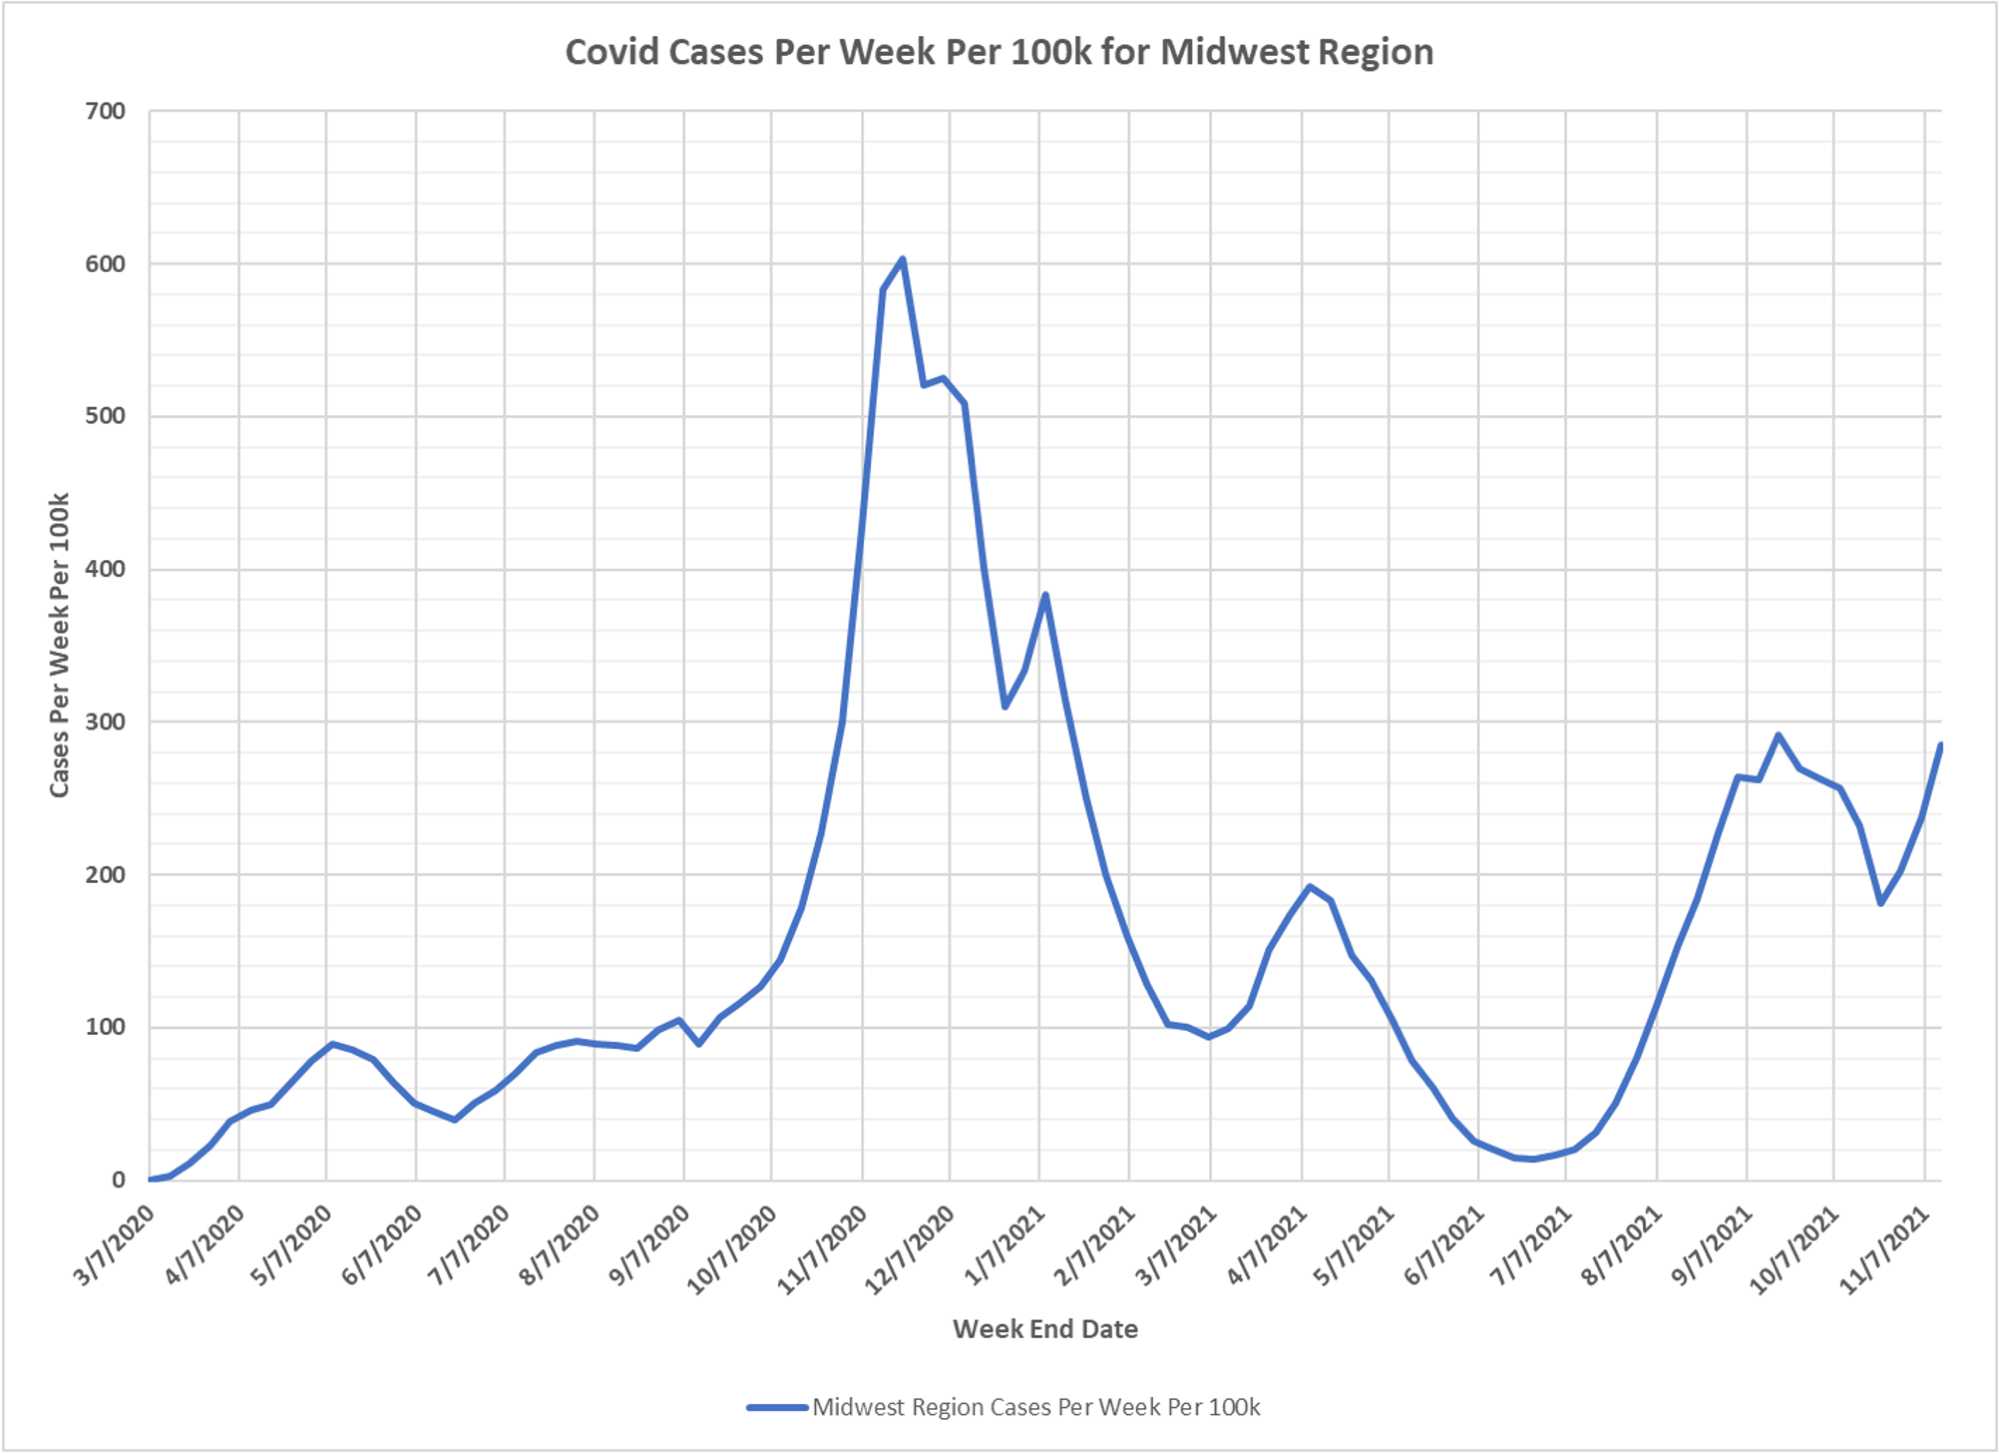
5. Note that each chart has a different vertical axis scale.
6. Overall, it is quite striking how many of the Midwest states have a similar pattern of a Fall peak in cases, followed by a drop in cases, and then another rise in cases.
7. It would be of interest to see the other US regions. I have found a significant and obvious discrepancy in the case data for California which creates peculiar spikes in the West region chart. For this reason I have chosen to limit this chart set to the Midwest only. I have queried the CDC about the discrepancy and have received no response.
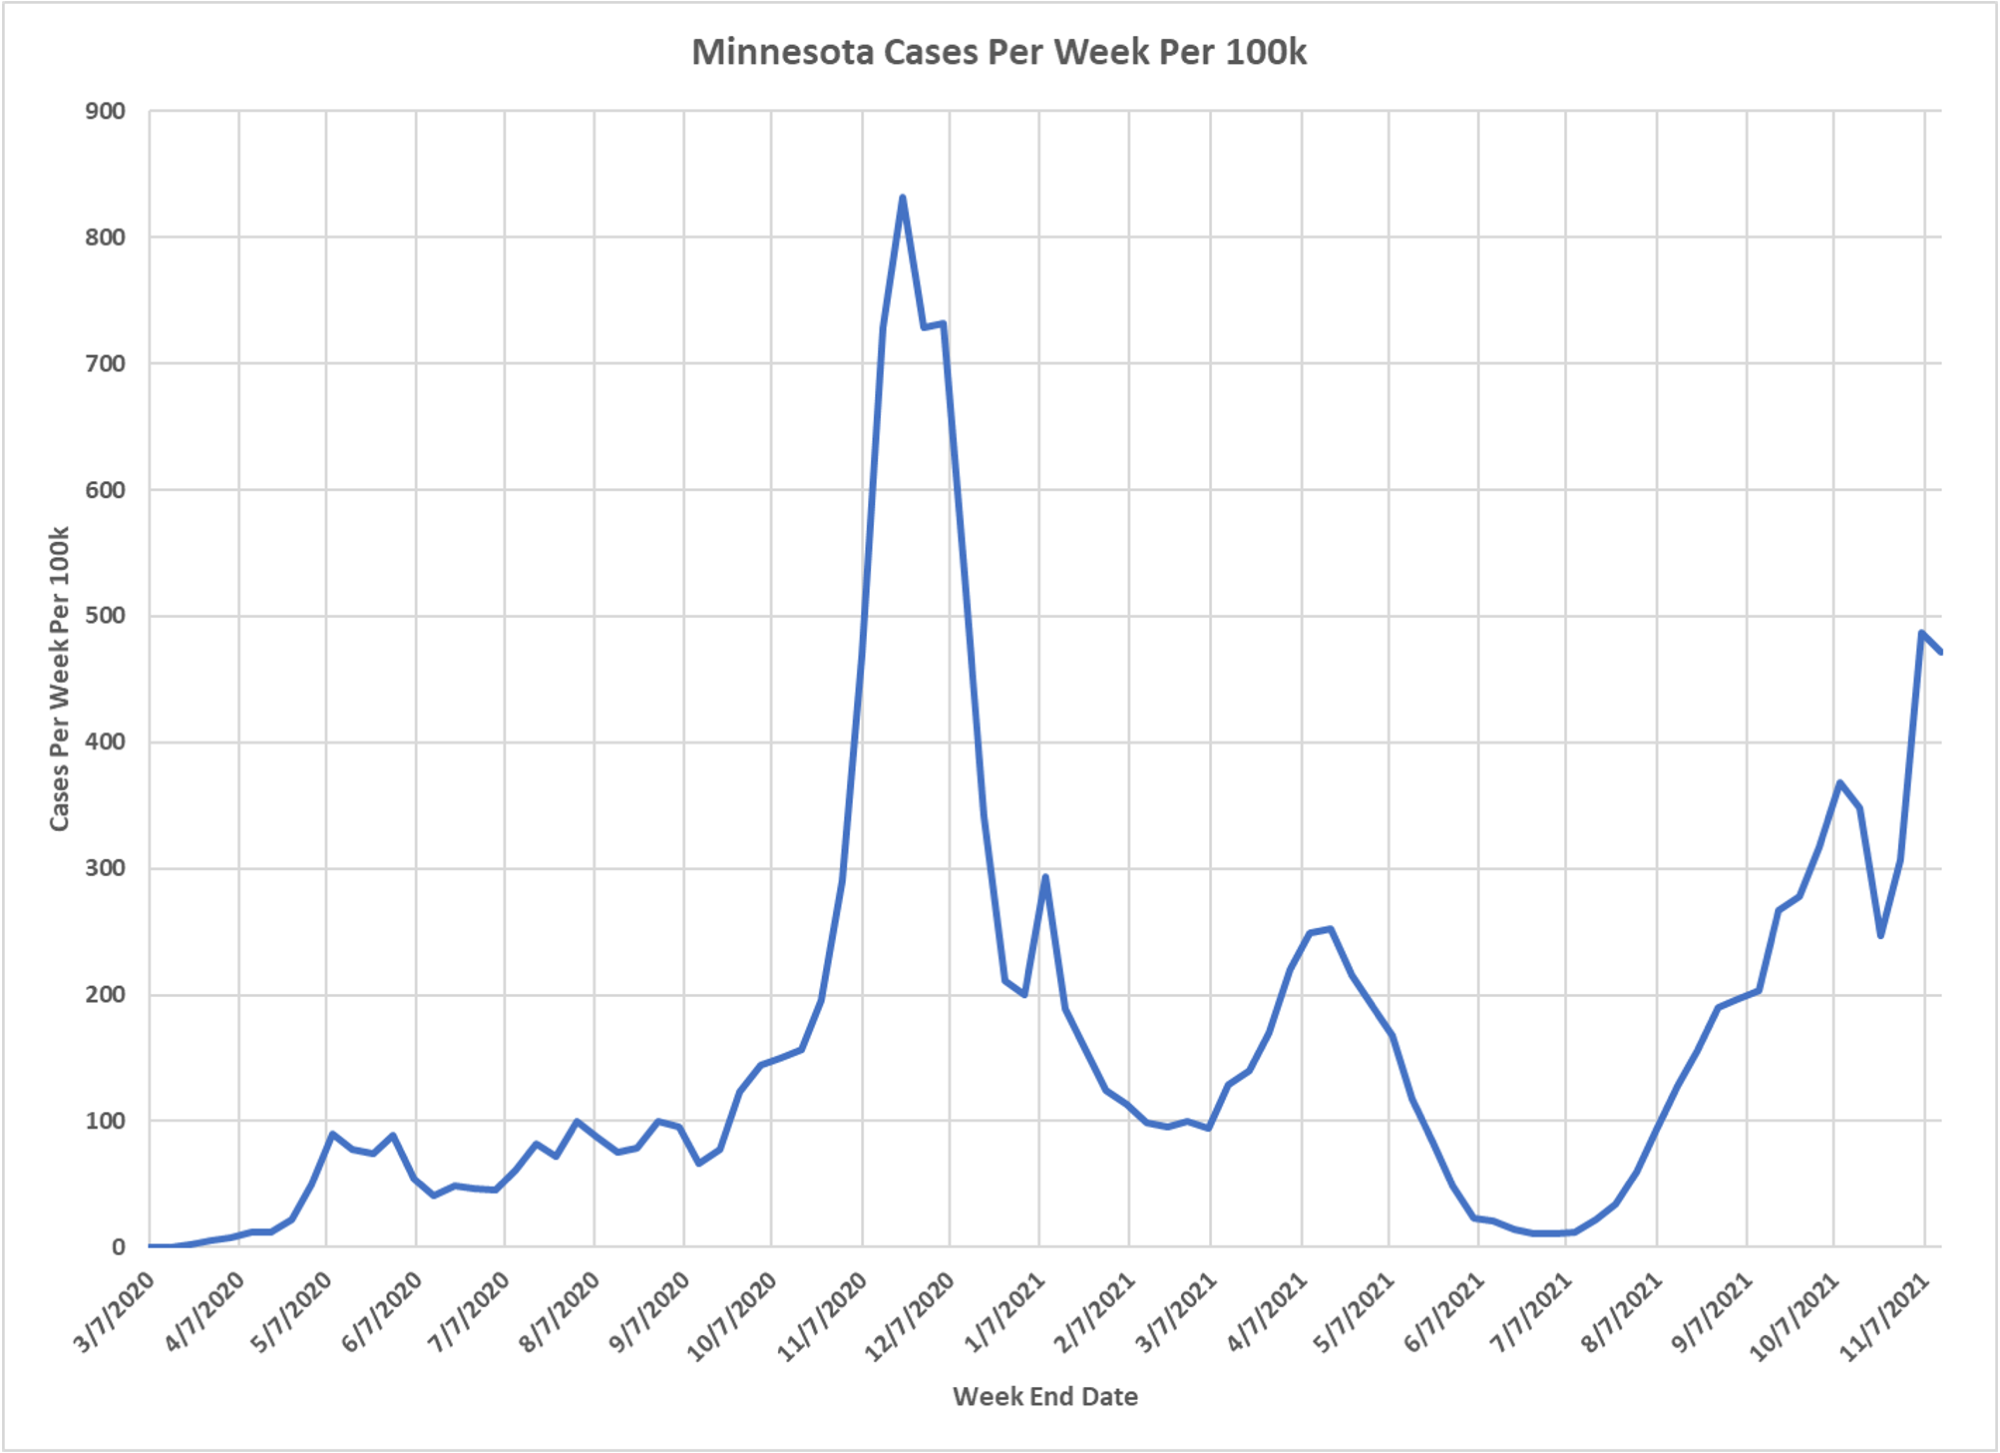


Could California be different due to wide range of latitude in the state? And MN covers a wider range of latitudes than other Midwest states. Also always wonder if all the water areas in MI contribute in anyway for their rises. Just interesting.
for large states, probably need to consider potential differences in meteorological effects by region