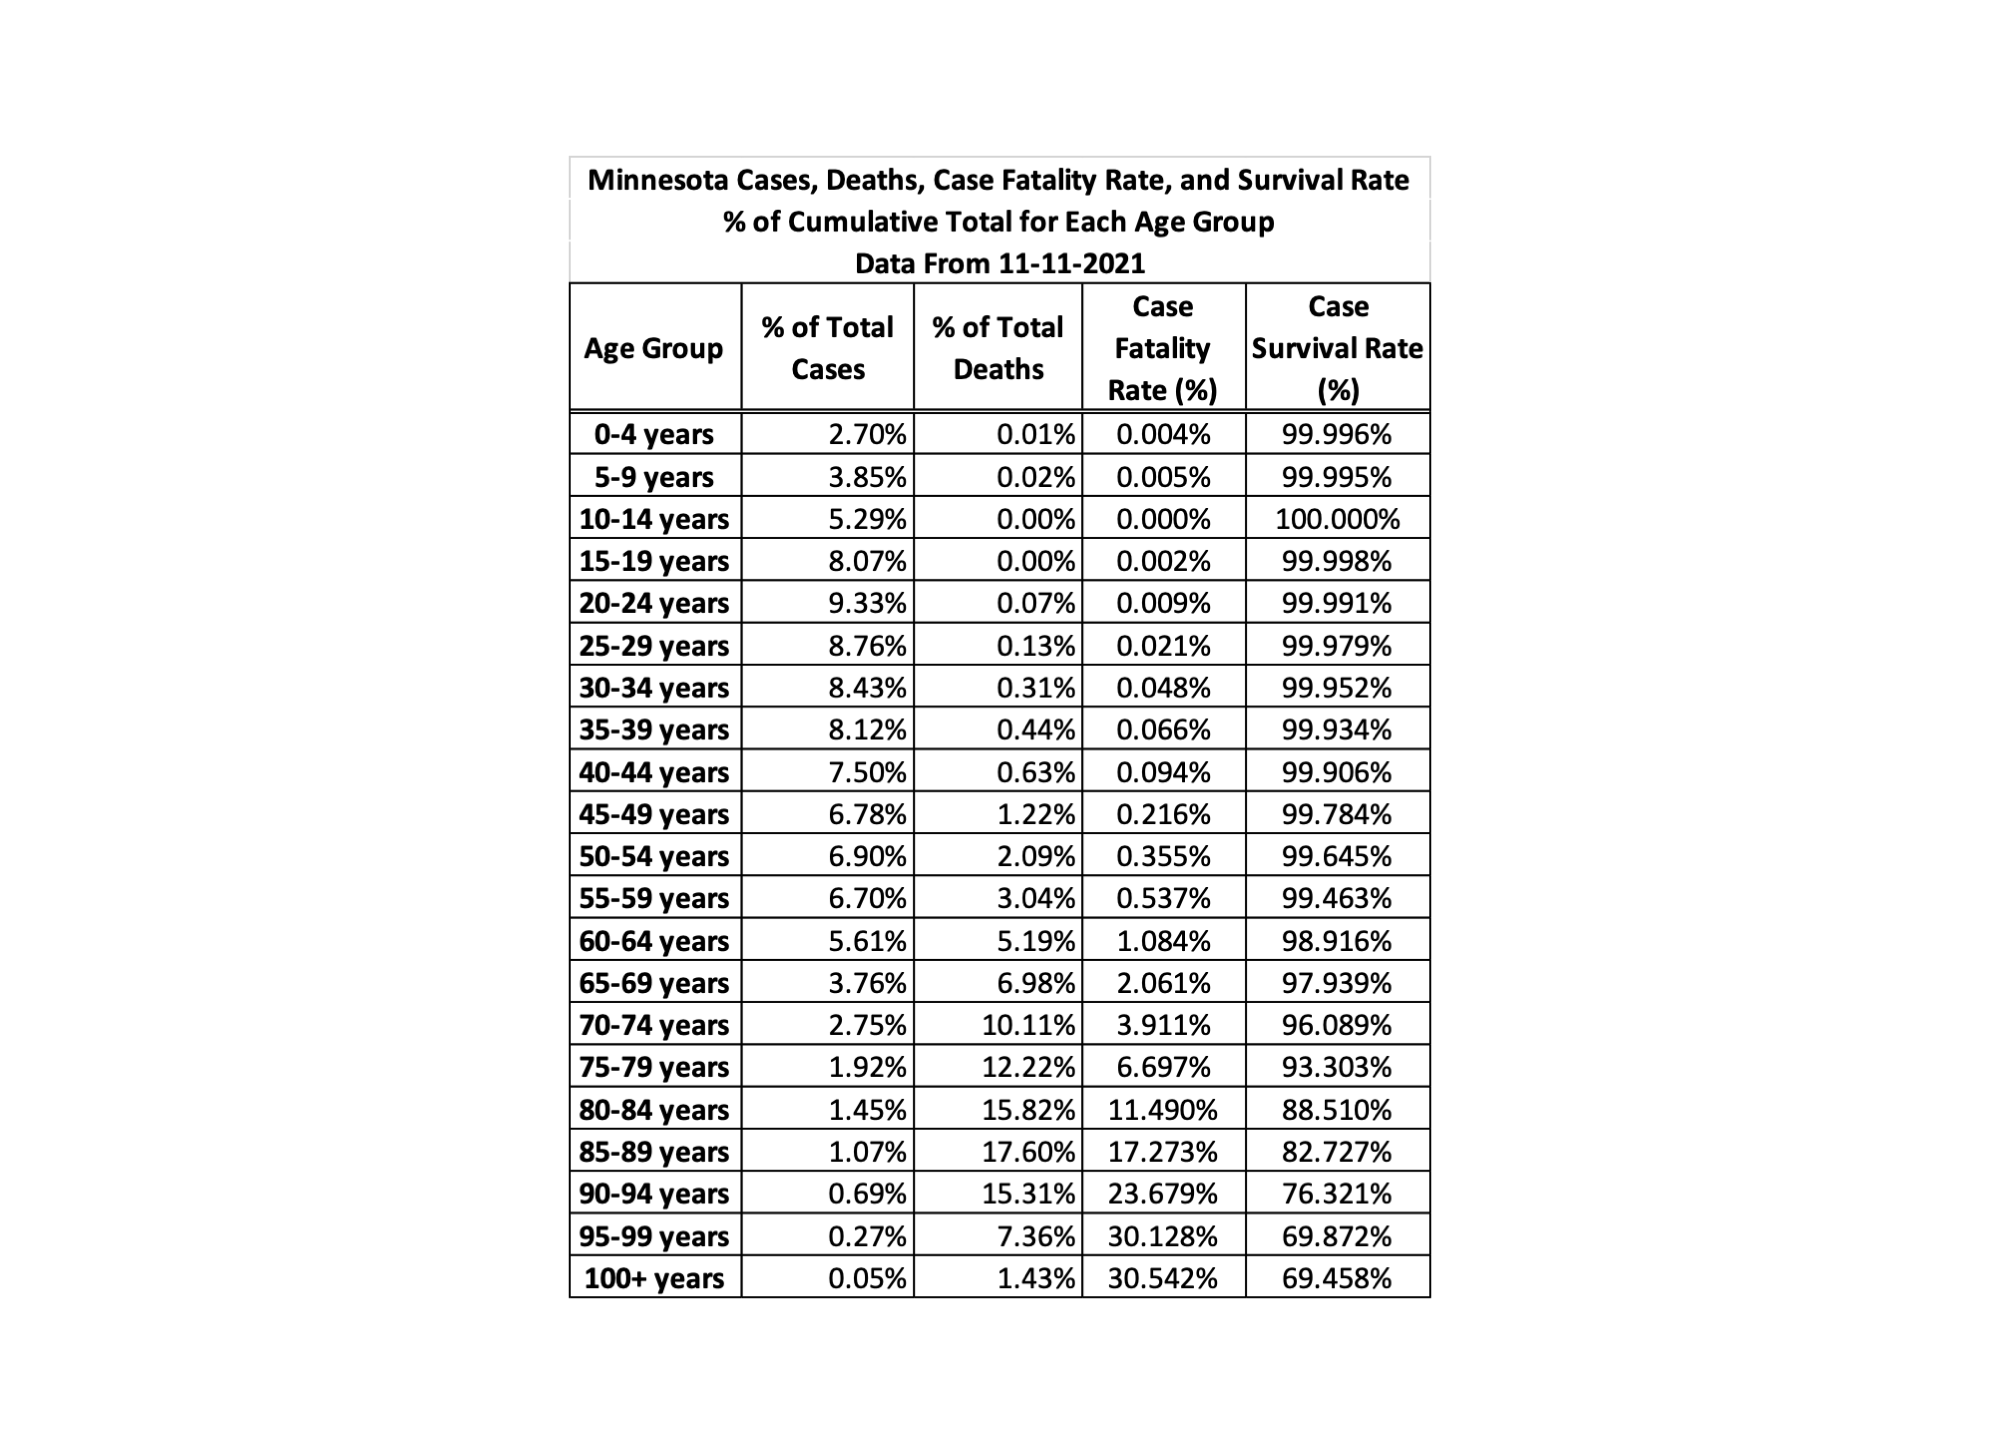
Dave thought that at a time when we are pounding the table for a shift in public policy to declare the epidemic over, despite rising cases, might be good to remind everyone of how non-lethal this pathogen is for the vast, vast majority of the population. The table below calculates the fatality, and inversely the survival, rates by age group in Minnesota. Pretty much says it all. You don’t really drop below a 99% survival rate until age 65 or older, and that is assuming the crazy death attribution method CDC and DOH use is accurate. It isn’t.
Dave’s notes:
- The underlying data is taken from Page 22 of the Minnesota Weekly Report published on 11-11-2021 here: https://www.health.state.mn.
us/diseases/coronavirus/stats/ index.html - The percent of total cases in each age group are simply the cumulative cases in each age group divided by the cumulative total cases for all age groups. The percentage of deaths in each age group is calculated in the same manner.
- The case fatality rate is the cumulative deaths in each age group divided by the cumulative cases in each age group.
- The survival rate is calculated as the (cumulative cases minus cumulative deaths) divided by the cumulative cases in each age group. The survival rate is also equal to the 1 minus the case fatality rate.


Maybe out of scope for Dave, but given various comparison claims to the flu, it would be interesting to see a flu survival chart by age group alongside this. Do you have access to this level of data from years past?
@Al Gardiner – The MN DOH has a portion of their site dedicated to flu stats. However, the data organization and presentation for their flu stats is not quite the same as their CV stats, and I suppose other factors may be present that prevent one from making a true apples-to-apples comparison.
Summary of Previous Influenza Seasons: Influenza & Respiratory Activity Reports
https://www.health.state.mn.us/diseases/flu/stats/summary.html
Here is an example of one of their flu season summary reports, which also includes summary data from previous flu seasons.
Summary of the 2018-19 Influenza Season
https://www.health.state.mn.us/diseases/flu/stats/2018summary.pdf
Some key metrics look similar.
Median Age of Hospitalization
CV: 63
2018-19 flu season: 62
Median Age of Death
CV: 81
Flu season
2013-14: 63
2014-15: 85
2015-16: 68
2016-17: 86
2017-18: 85
2018-19: 75
2019-20: 74
The total pediatric deaths also look similar.
CV (0-19 years old): 5
Flu season (<18 years) deaths:
2014-15: 10
2015-16: 3
2016-17: 2
2017-18: 6
2018-19: 1
2019-20: 3
@guest… Thanks for that info.
Is there any information on PCR test results for Flu viruses?