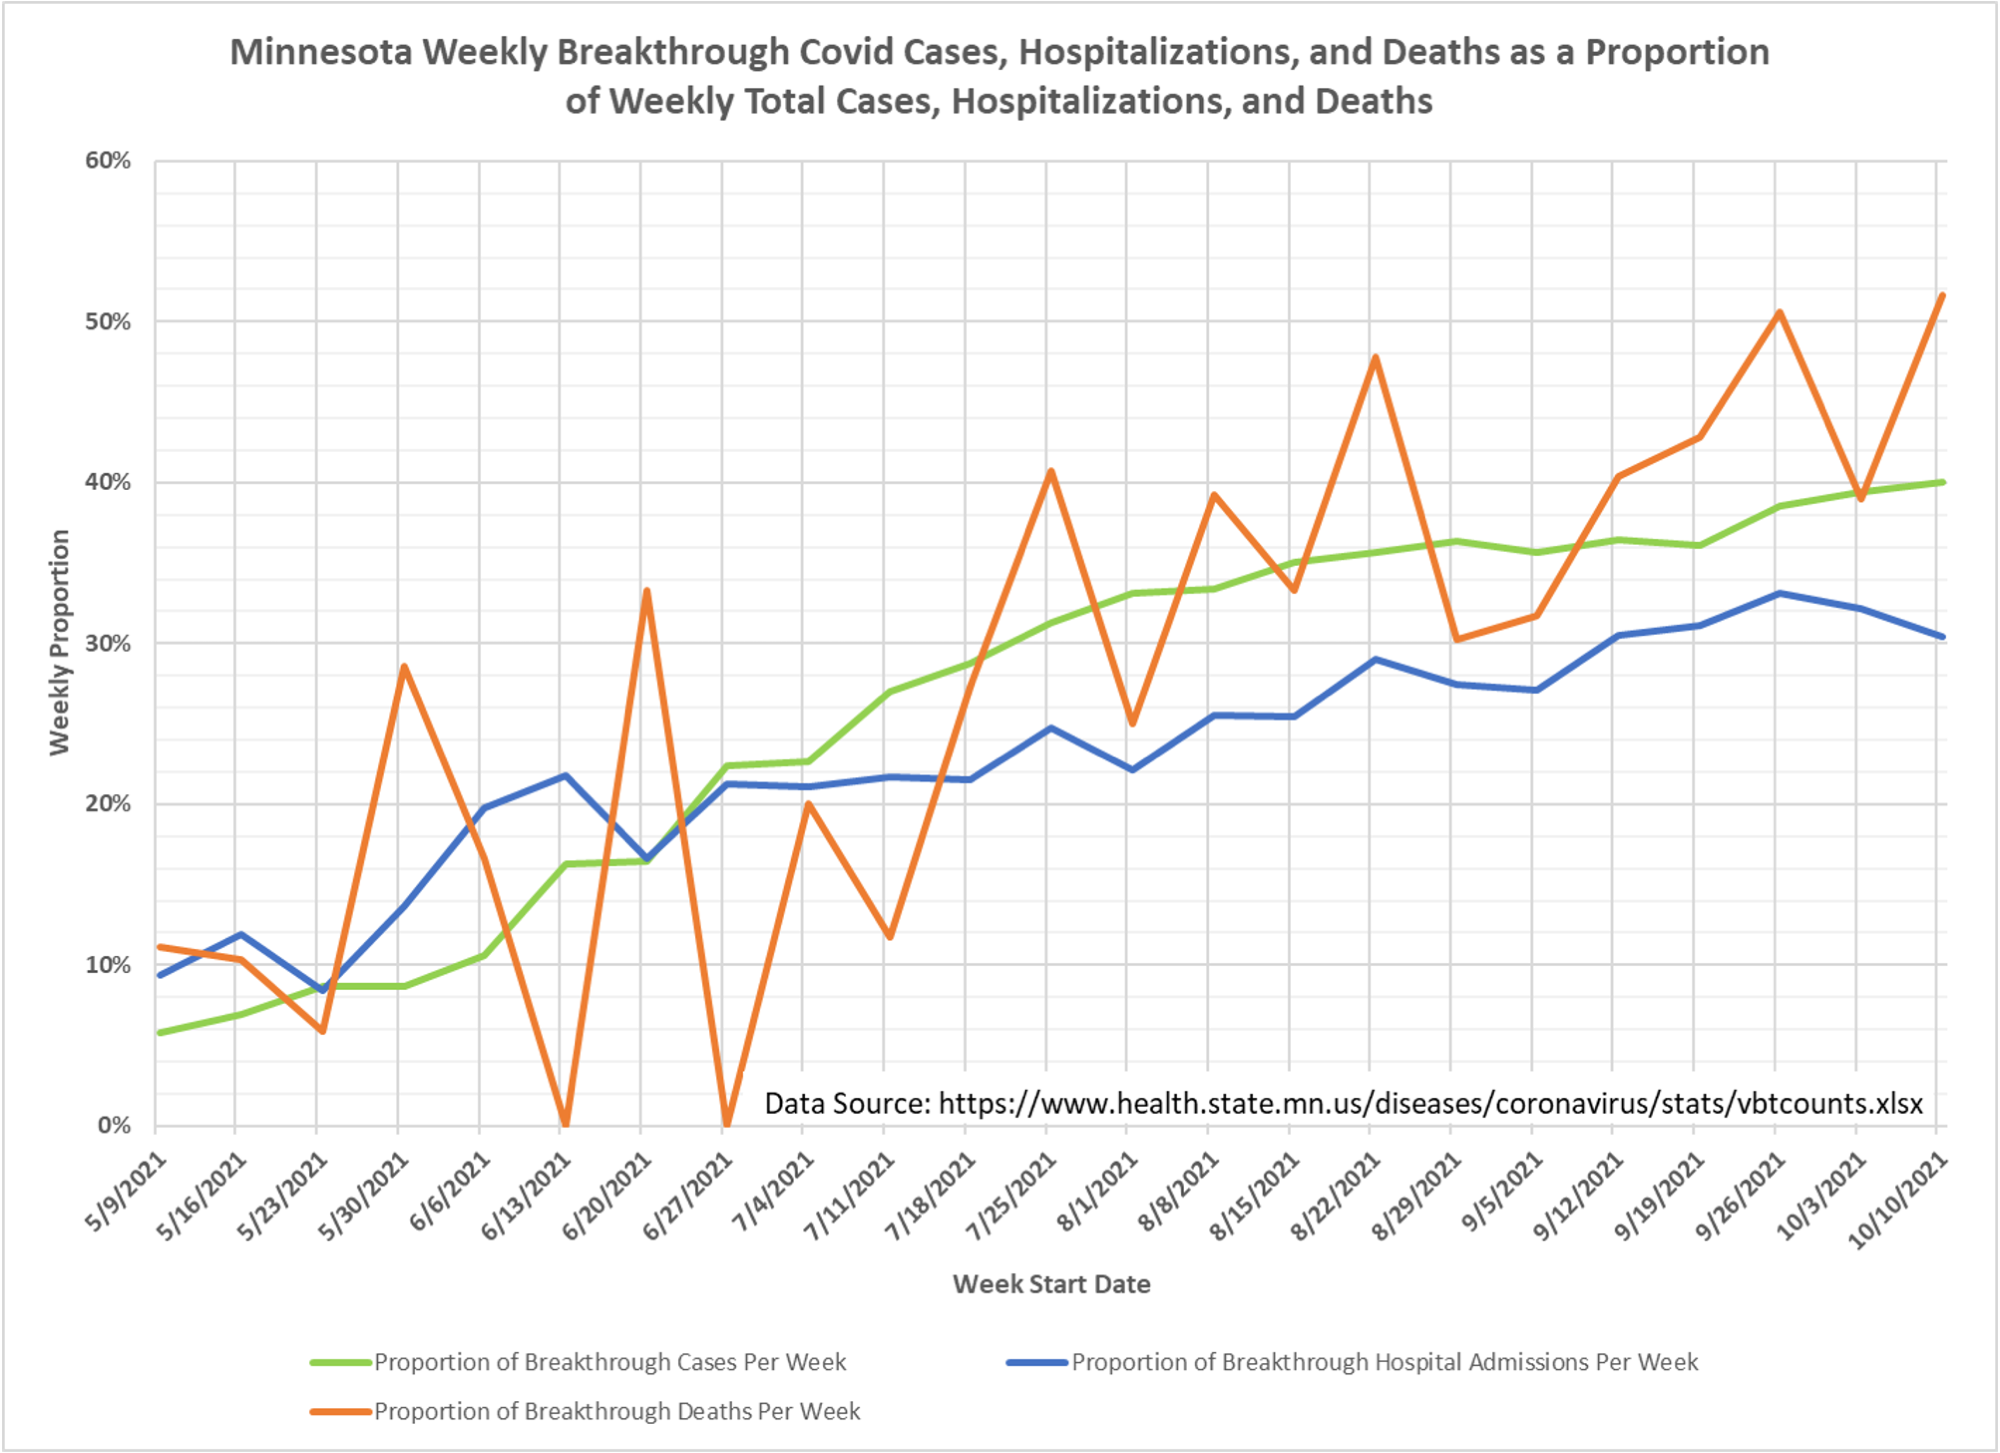
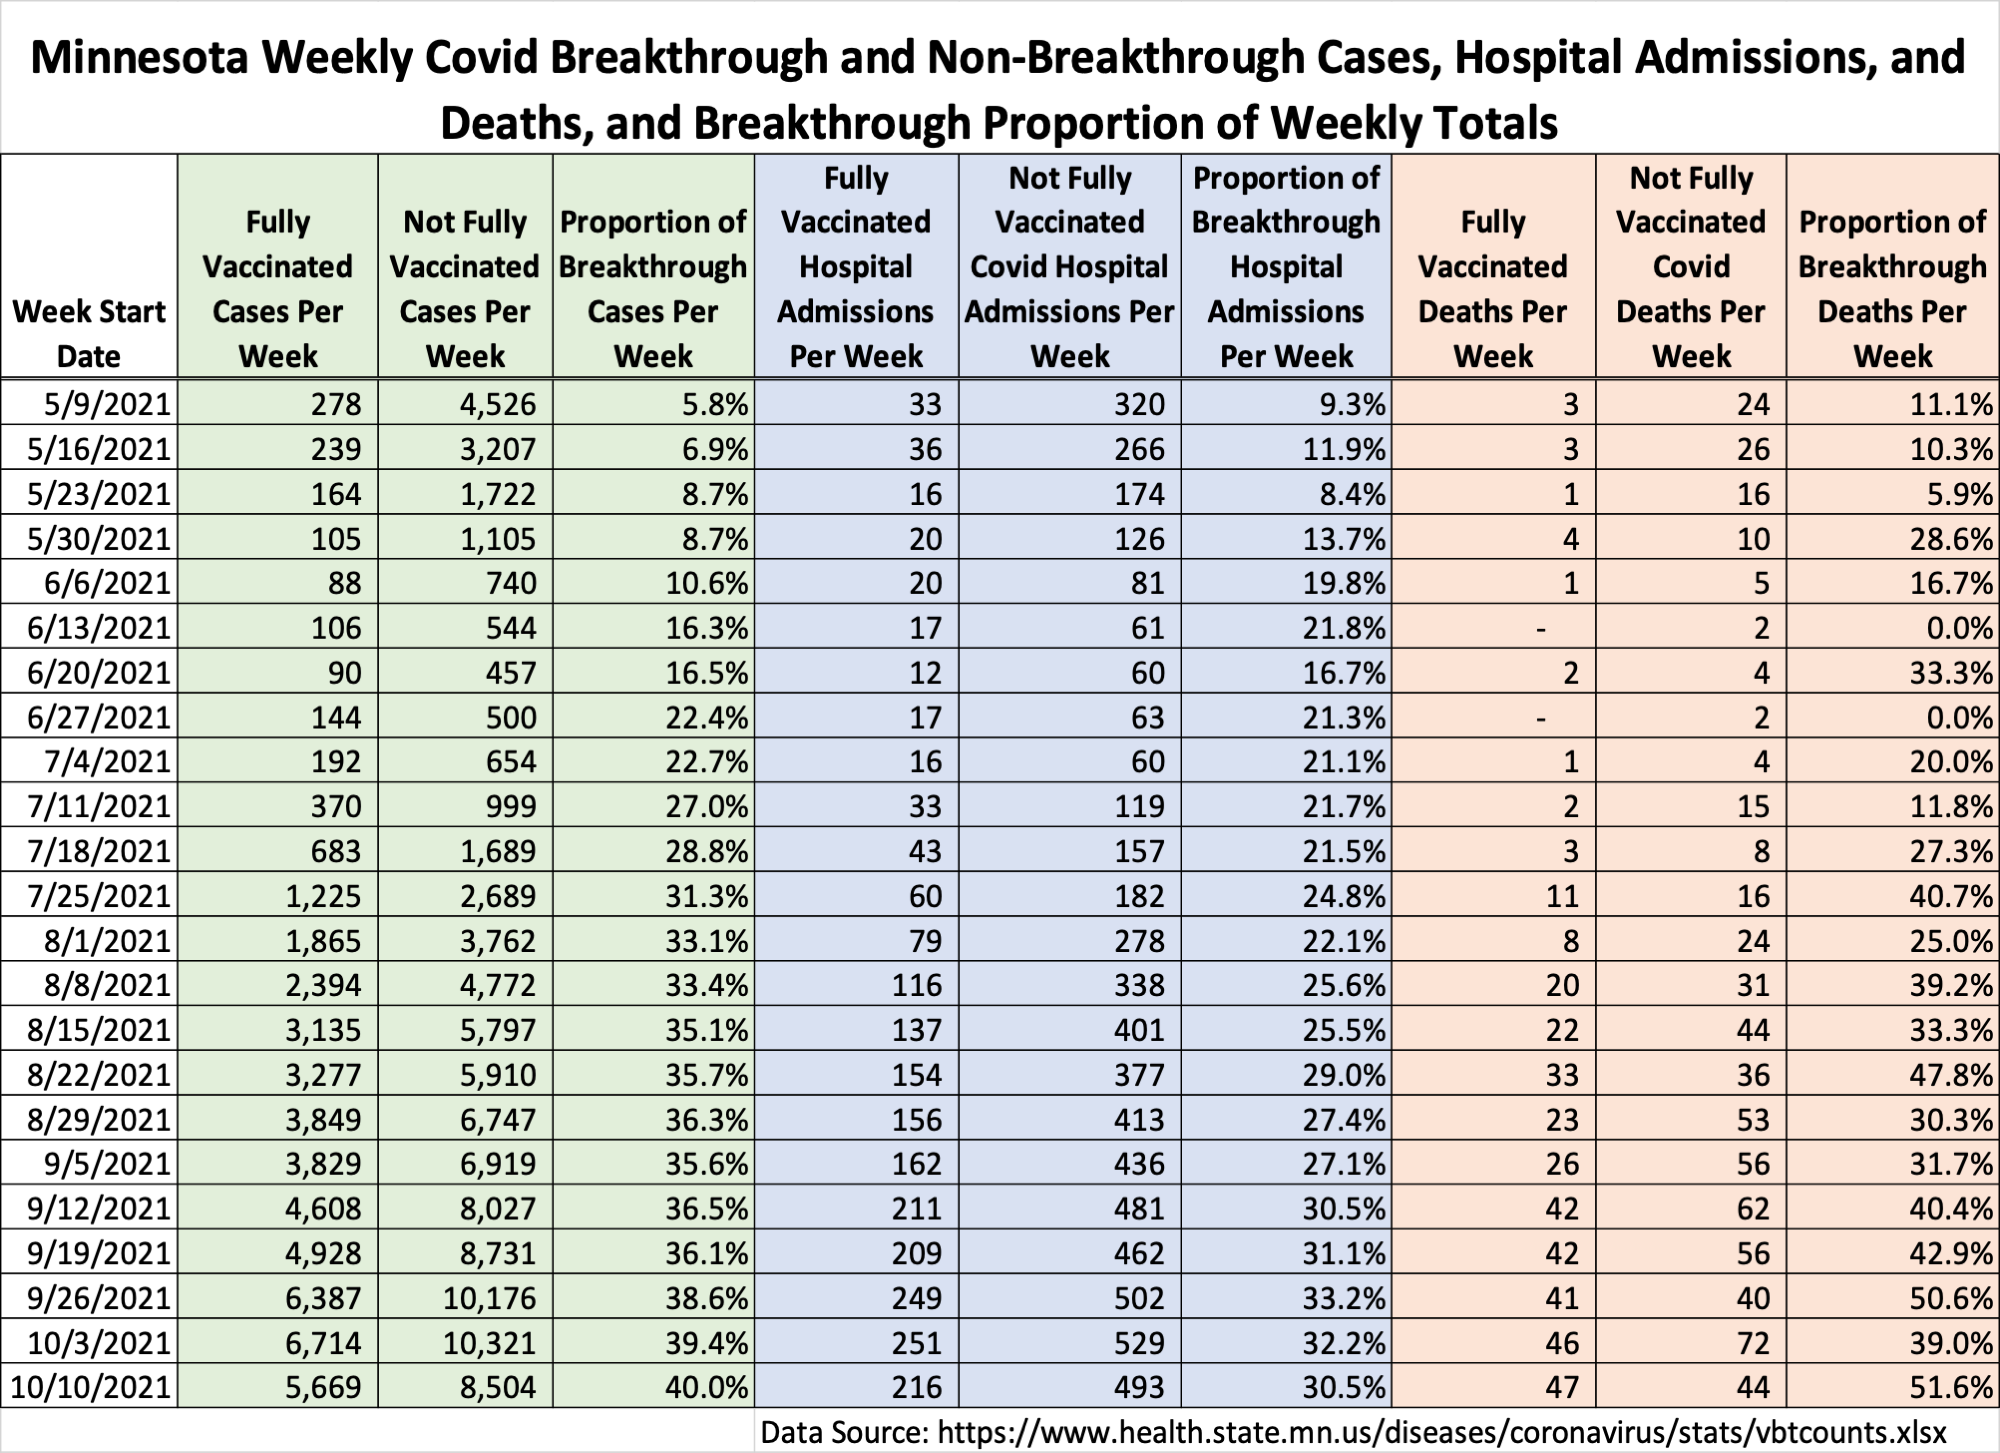
With all the activity last week, and getting new files, Monday, which is breakthrough data release day, crept up on us. Here is the updated table, after the one we published on Monday. This one is based on the updated file and is, as we noted this morning, based completely on Minnesota data as is. A quick reminder again, this is not a good statement about vaccine effectiveness, it is a statement about which patients are contribution to hospital resource use, and it is a statement about a level of events that even if everyone is vaxed, will feed the epidemic terrorists.
And recall what I pointed out in the post about Minnesota data last night. The identification of breakthrough events doesn’t like a steady state process, but one that proceeds by fits and starts. I suspect some weeks they get through a lot of matching and other weeks not much. So the data will move around. What you see in this update is a continuation of the general trend up in proportions. The DOH data lags by a month, and I suspect early weeks are still being filled out, so it seems reasonable to conclude that the percents are even higher by now.
And here is Dave’s quick reminder on methods:
Notes, Sources, and Methods:
1. The table and chart are updated for new data released by MDH on 11-15-2021, for the week starting 10/10/2021.
2. Compared to the prior version we published early on 11/15/2021, I have changed to table to show Fully Vaccinated and Not Fully Vaccinated Events, rather than Fully Vaccinated and Total Events as before.
3. The source is the data file https://www.health.state.mn.us/diseases/coronavirus/stats/vbtcounts.xlsx found on MDH web page https://www.health.state.mn.us/diseases/coronavirus/stats/vbt.html.
The data provided in the data file vbtcounts.xlsx is used without modification, other than to sum the weekly events and compute the breakthrough proportion.
4. MDH defines a breakthrough event as a Covid case, hospital admission, or death that occurs 14 or more days after completing the vaccination shots (not including boosters).


The very troubling aspect of the above chart is that the breakthrough deaths (from the eye) look to trend in a similar pattern to the breakthrough cases. From the UK data, we see that the vaccine effectiveness against cases seems to go to zero (or negative) over time. Will deaths follow? I suspect the fact that hospitalizations don’t follow same pattern is likely an artifact of different testing incentives (https://inumero.substack.com/p/incentives-for-testing-the-vaccinated?r=tv61s&utm_campaign=post&utm_medium=web&utm_source=)