I want to again stress that this is based on the latest file provided to us by the state. I fully expect the state’s data is not complete or completely accurate, and there will be additional revisions. But based on what we have, here are the case rates for hospitalizations and deaths, by age group, and cumulatively. These rates show basic vaccine effectiveness by age group, since age is probably the single most important variable to take into account. Unlike the proportions table and chart, here we do have to do a little analysis to match up data.
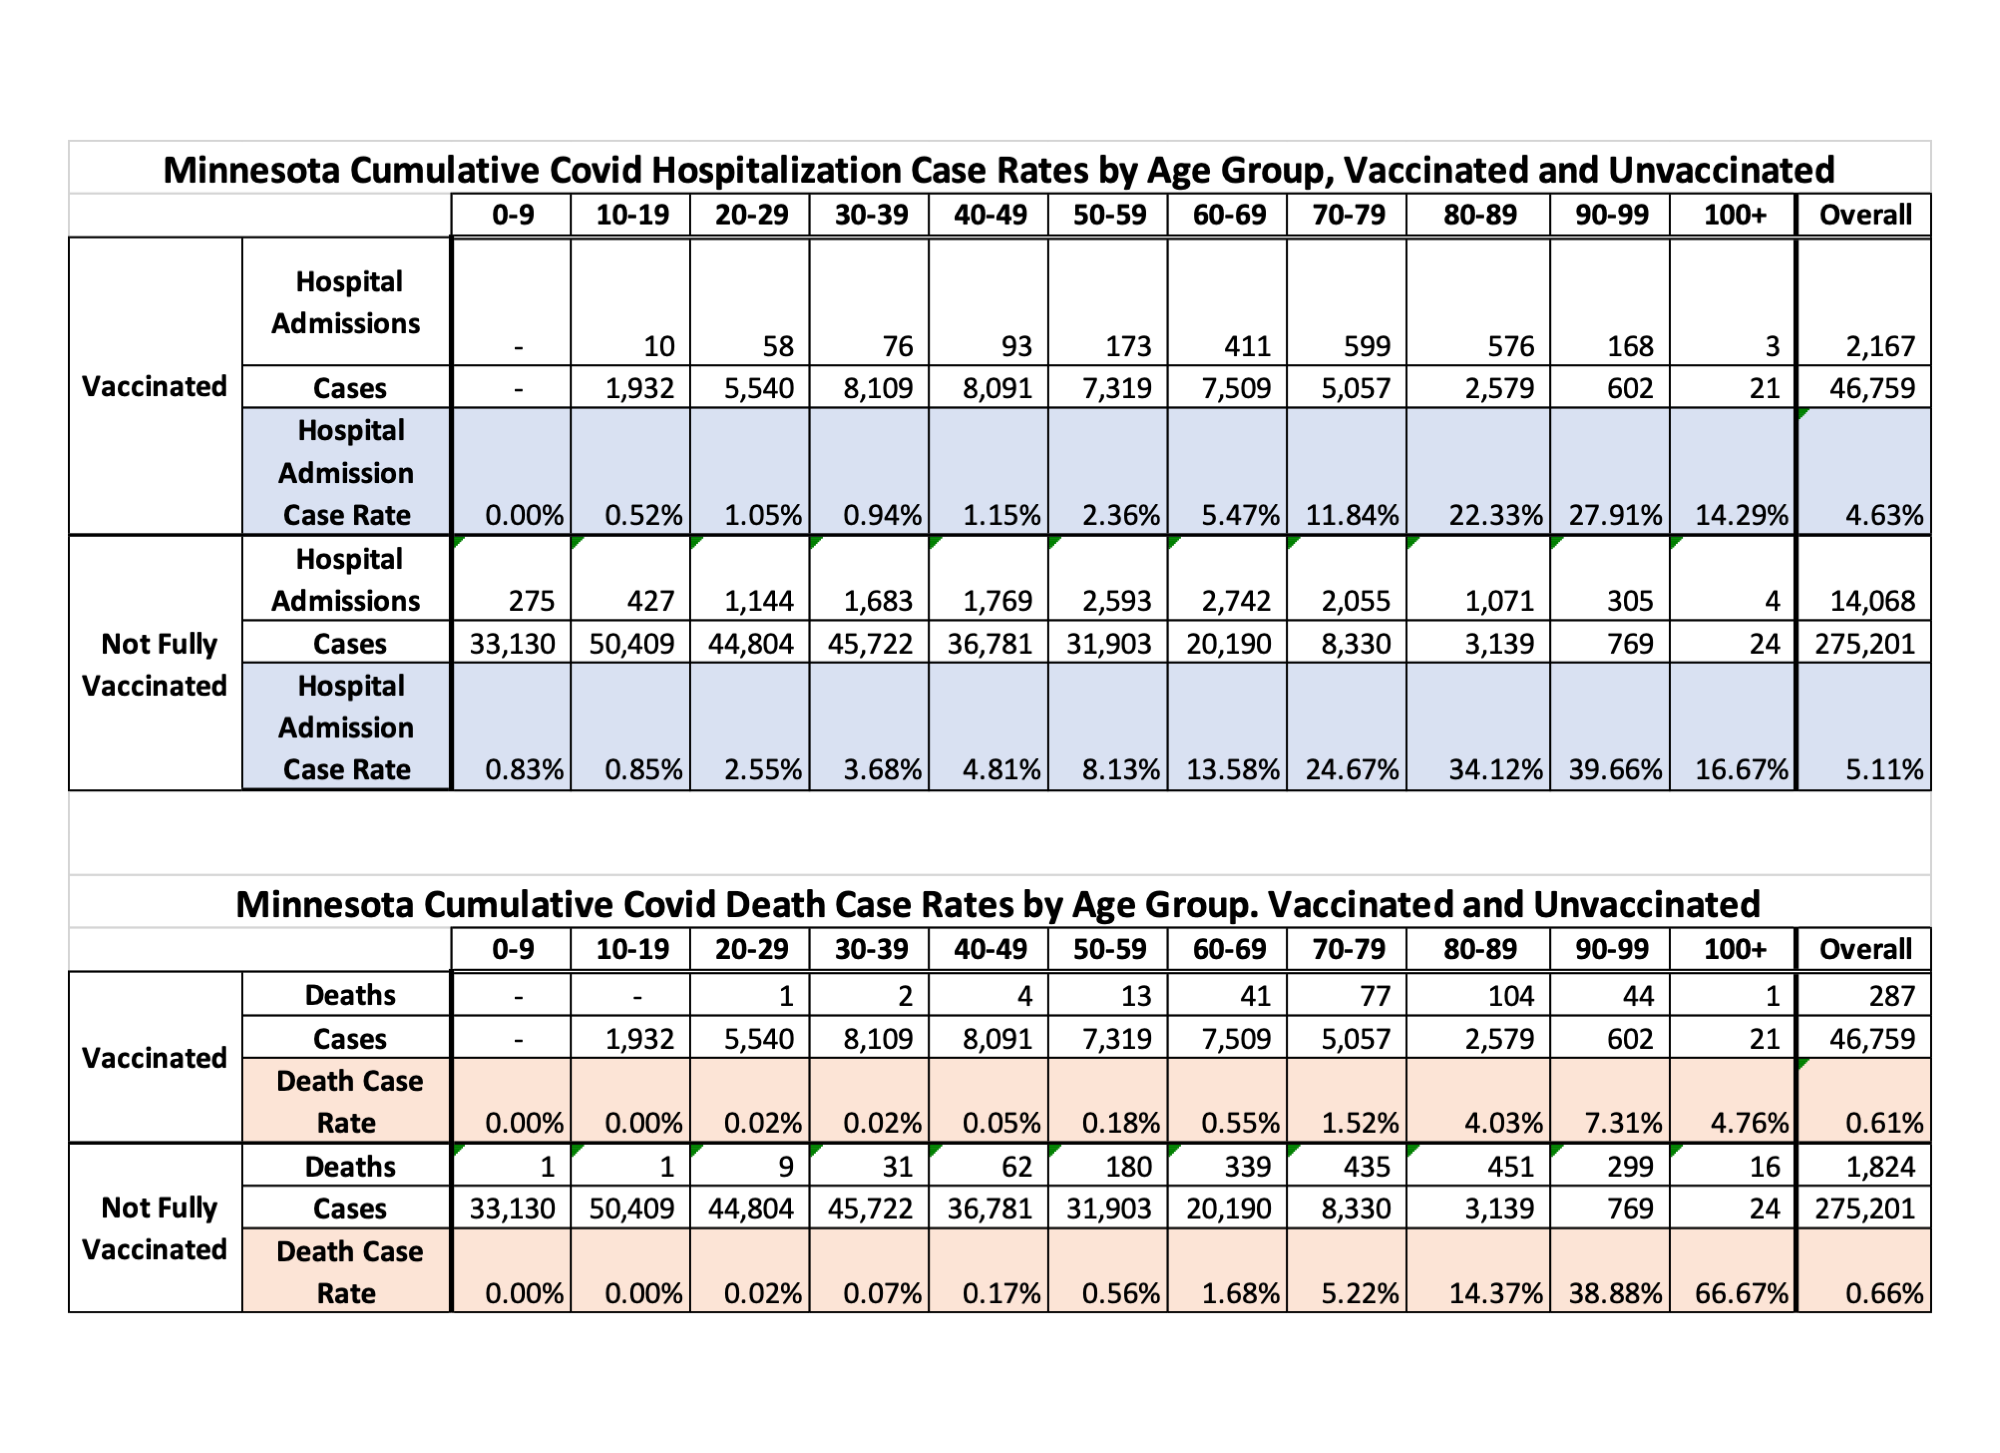
And here is the headline interpretation. While the cumulative case rates of hospitalization and deaths don’t look very different, in older age groups the protective effect of vaccination is very clear and strong. The cumulative rates are unduly influenced by the very large number of cases and low number of hosps and deaths in younger age groups.
For age groups 50 and over, you are at least three times less likely to die if you get infected and you are vaxed than if you get infected and aren’t vaxed. While the hospitalization difference is not quite as great, it is still substantial.
Let me mention a few other matters, once more, that should be adjusted for, and the state could give us data to adjust for. The state is missing vaxed people, potentially a lot of vaxed people, people who were vaxed in the VA and other federal sites, people who were vaxed in other states like Florida and Arizona. I don’t know which way this cuts, but the state is not identifying people who were infected but are unvaxed or were infected before being vaxed. Depending on the relative proportion of those, in either case they are less likely to get infected and more likely to have detected infections. Depending on those relative proportions, you could understate or overstate the effectiveness of vaccines. And there can be an effect on exhaustion in the older age groups of the pool of people who are vulnerable. The pre-vaccine epidemic took out a lot of vulnerable elderly, so that may make vaccines look better than they are.
And as Dave notes, we don’t have actual dates yet from the state for hospitalizations and deaths, just that someone was hospitalized or died. So we are making assumptions, based on typical data lags calculated over a long period of time, about the average time between case and hospitalization or death. We can clean this up when we get the real dates.
Dave’s notes:
Comments, Sources, and Methods:
1. On 10/28/2021 we had requested that the Minnesota Department of Health (MDH) provide us, under the Minnesota Data Practices Act, information regarding Minnesota’s breakthrough Covid cases (breakthrough cases being defined as someone who tests positive for Covid 14 or more days after completing their vaccination series). Specifically, for each breakthrough case, we asked for the date of specimen collection, date of hospital admission, and date of death, as well as the age of each individual. This Data Practices Act request (ID No. 21-211) was separate from a much more comprehensive request submitted some weeks ago, and we hoped that perhaps a simple, more focused request might be acted upon. On Wednesday, Nov. 10, 2021 MDH provided an Excel spreadsheet containing information about 57,023 breakthroughs cases. The data provided was the date of specimen collection, the age of the individual, and Yes/No flags for whether the case was hospitalized or had died. We were not given the date of hospitalization or death, and we followed up with a request for these dates as well.
2. As of Monday, 11/02/2021, MDH’s Vaccine Breakthrough Report web page https://www.health.state.mn.us/diseases/coronavirus/stats/vbt.html reports a total of 57,023 cumulative breakthrough cases, exactly matching the total cases in the data they provided (Note that it is necessary to use the Internet Archive https://archive.org/web/web.php to look at past data on the Vaccine Breakthrough web page). We will make the reasonable assumption that we were provided complete data as of 11/02/2021, the week prior to when we received the data. In addition, the MDH data identified 2609 breakthrough hospital admissions and 372 breakthrough deaths, exactly matching the cumulative totals reported on 11/02/2021 on the Vaccine Breakthrough Report web page.
3. In the breakthrough data provided by MDH, the earliest breakthrough case is 3/08/2021, and the most recent is 10/23/2021.
4. We know that there are likely to be breakthrough cases that have not been identified by MDH, because the vaccination occurred out of state, by the VA, or by a Native American medical facility. In response to a query to MDH on 9/23/2021 we were informed that MDH has access to vaccination records of Minnesotans vaccinated in Iowa, Wisconsin, and North Dakota if they gave the provided a Minnesota address. MDH does not have access to vaccination records in any other state. MDH does not have access to Veterans Administration vaccination records, and only partial or limited access to Tribal health organizations vaccination records.
5. We are unsure how complete the data matching process is for MDH even for the vaccination records in their possession. We suspect, for example, that on 11/08/2021 that MDH reported additional breakthrough cases as early as 5/02/2021, by examination of the breakthrough case, hospital admission, and death rates associated with the charts and tables on the Vaccine Breakthrough Report web page https://www.health.state.mn.us/diseases/coronavirus/situation.html#vbt2 . It is reasonable to assume that in the future additional older breakthrough cases will be identified and published.
6. It is likely that there are people who may have contracted a mild enough Covid infection that they did not seek medical attention or get tested, causing an undercount of the true number of breakthrough infections.
7. The data file provided by MDH did not include the actual dates of hospital admission and deaths. We assumed that there was an average lag of 3 days from specimen collection date to hospital admissions, and 14 days from specimen collection and death.
8. The Vaccinated Hospital Admission Case Rate is calculated as the number of breakthrough hospital admissions per age group divided by the number of breakthrough cases by age group. The result is the percentage of breakthrough cases which were hospitalized by age group. Breakthrough hospital admissions and breakthrough cases are taken from the new Data Practices data file described in Number 1 above, assuming a 3 day average lag from specimen collection date to hospital admission.
9. The Not Fully Vaccinated Hospital Admission Case Rate is calculated as the number of non-breakthrough hospital admissions divided by the number of non-breakthrough cases, resulting in the percentage of non-breakthrough cases that are hospitalized. Non-breakthrough hospital admissions are found by taking the total hospital admissions (computed by taking differences between successive cumulative totals from the Minnesota Weekly Report https://www.health.state.mn.us/diseases/coronavirus/stats/index.html ) minus the breakthrough hospital admissions computed in Number 8 above. We have determined in other analysis that there is an average lag of 1 week between hospitalization and reporting in the MDH data files and reports. Non-breakthrough cases are found by computing the total cases by age group from the data file wagscd.csv published on https://www.health.state.mn.us/diseases/coronavirus/stats/index.html#wagscd1 and subtracting the breakthrough cases described above.
10. The death case rates are found by a similar process to that used to find the hospital case rates.
11. Some comments about the table itself:
By comparing the Vaccinated and Not Fully Vaccinated Case Rates for each age group we can judge the relative risk between vaccinated and unvaccinated people in each age group, and the relative risks between age groups.
We can see, not surprisingly, that the older age groups are at greater risk of hospitalization and death, whether vaccinated or not, and the non-vaccinated are at higher risk of hospitalization and death than the vaccinated, once testing positive for Covid.
The difference in overall population case rates for vaccinated people (4.63% hospitalization case rate and 0.61% death case rate) are not very different from the unvaccinated rates (5.11% hospitalization case rate and 0.66% death case rate). We believe that the large numbers of cases in the younger unvaccinated age groups offsets the higher case rates in the older unvaccinated age groups, being the overall unvaccinated rates down.

Are not the unvaccinated rates lower since the state includes people who were jabbed but don’t meet the CDC’s definition of being vaxxed? I wonder – of those hospitalizations and deaths in the “not fully vaxxed” category – how many of those cases are people who were jabbed and may have had an adverse reaction and/or Covid. Of the never-vaccinated crowd that enter the hospital and die, what percentage have co-morbidities.
An important strength of this analysis is stratification by age; it’s a nice Simpson’s paradox like finding. However, note that this analysis ignores the effect of the vaccine on the likelihood of getting COVID. Instead, it reports the likelihood of being hospitalized or dying if you get COVID. Since you can’t become fully vaccinated after you get COVID it is of academic, but not practical interest. What matters most is the overall likelihood of being hospitalized or dying if you are or are not vaccinated. To generate those statistics, you would need to divide by the total number of people in Minnesota who are or are not vaccinated. That can also be estimated by multiplying your estimates by the relative risk of getting COVID. Other groups have found that this is typically in the 0.2 range, meaning that you would find that vaccination effectiveness in the 90% range. This would be an important result for Minnesotan’s to know. It’s a shame that the state isn’t doing work like this.
we are working very hard on getting good denominators. As others who work on the Minnesota data know, it is garbage when it comes to figuring out the vaxed versus unvaxed population at any point of time. You can become vaxed after infection, and it is important to break that group out for analysis as well to see the relative protective effect of that combination. i don’t think vaccine effectiveness against infection is anything like 90%, even shortly after full vax, and by 6 months drops pretty radically. Be interesting to see if boosters really have any effect either.
The state publishes the number of people with at least one dose and the number of “fully vaccinated” on a routine basis. The age breakdown is pretty coarse (5-11, 12-15, 16-17, 18-49, 50-64, 65+) but combined with census data gives a pretty good denominator for fully, partially, and unvaccinated individuals. I agree that no vaccine is 90% effective against delta infection, but your data suggest that effectiveness against hospitalization and death may be around there. For example, census data indicate that there are 859K people 65+ in MN and MN data indicate that 796K are fully vaccinated, leaving 63K not fully vaccinated. Your data for 70+ hospitalizations indicate that there were >1346 hospitalizations among vaccinated people in the 65+ group, or >0.169% and >3435 in the non-vaccinated, or >5.48%. That means that the vaccine effectiveness is going to come out around 1-0.169/5.48, or ~95% against hospitalization. Now, I suspect that it will come down some when you run actual numbers, especially in the delta era. But that is an example of how you could combine the data that you do have with publicly available data to get a reasonable estimate of vaccine effectiveness. If you can get ahold of MN vaccination rates by age over time, then you could do an even better job of it.
Yes, that is one way to do it, just hard to match up events by age, especially in the unvaxed, but we are working on it. Be nice to know how many out of state and federal vaxes there were, so we identified the real number of fully vaxed. And be very important to identify the sub-group of previously infected and vaxed versus only vaxed, as research suggests the former has stronger protection. So if you want to identify the vax protection alone, you need to subset those who also were infected before vax.
other issue is ongoing lag in state fully identifying breakthroughs, it can take a while to match events from a specific week with the fully vaxed for that week. So right now the lag is at least four weeks, and really probably a little longer to get full data.