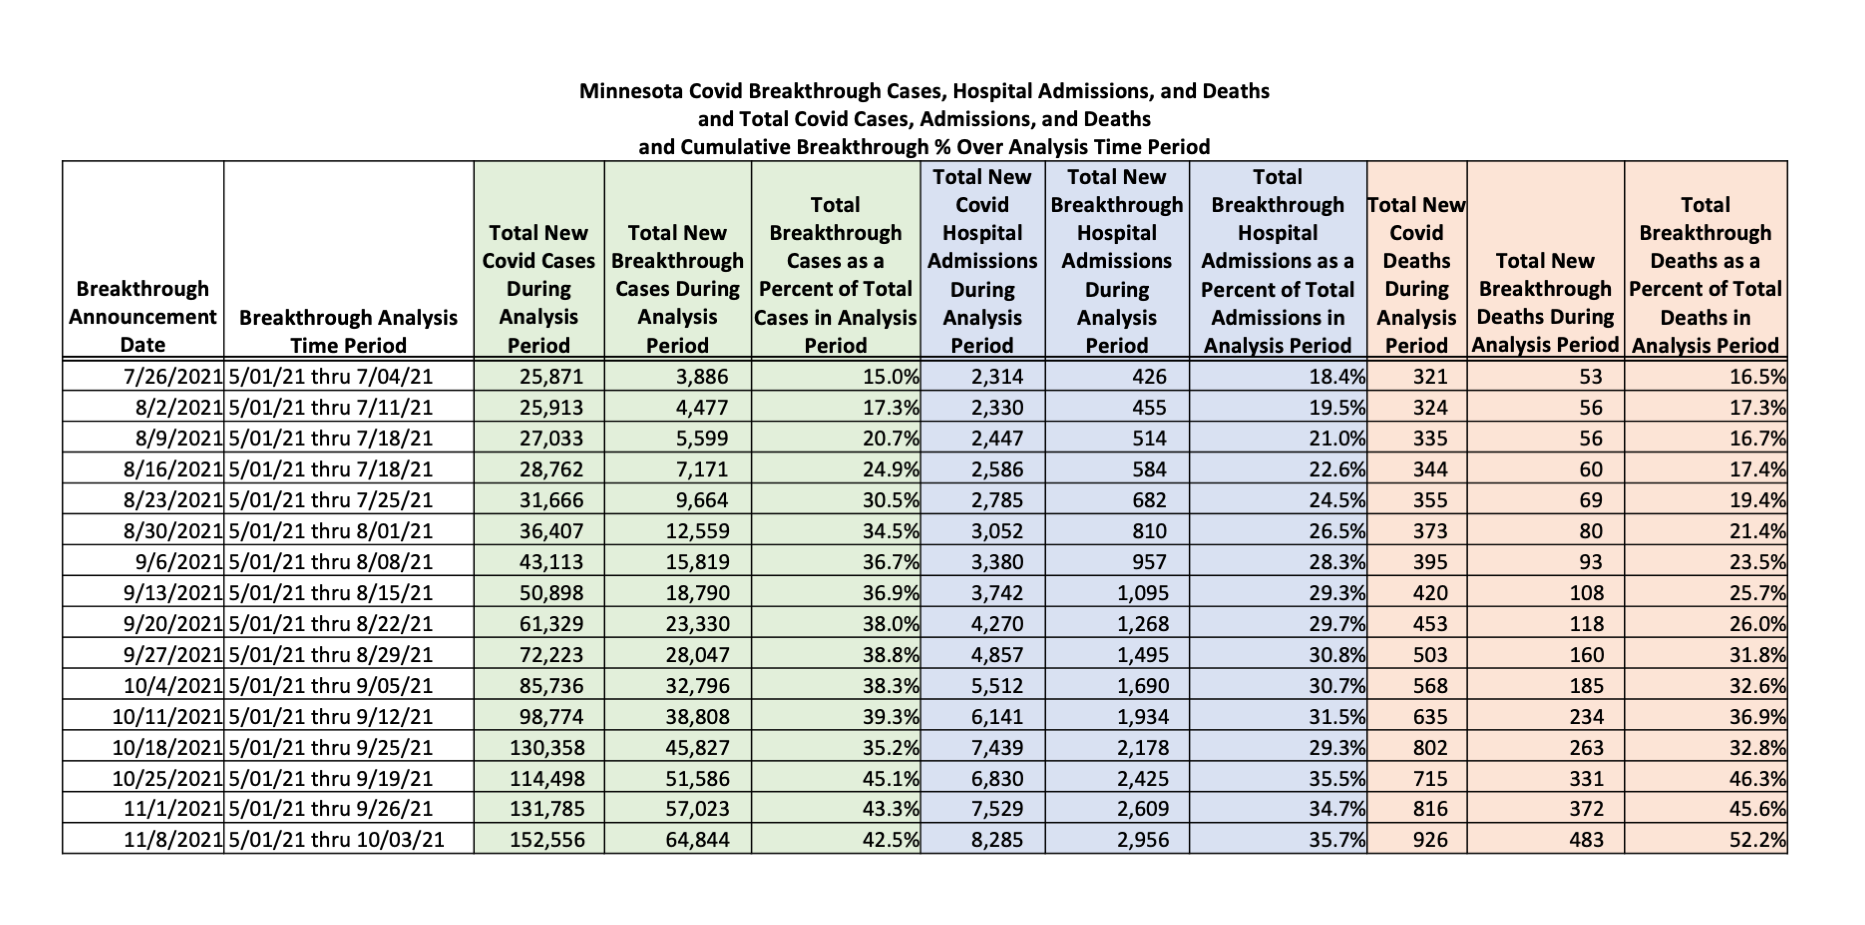
More outstanding work from Dave Dixon. Once DOH told us that we should basically be comparing breakthrough events reporting with a four week lag, we were able to calculate percents of total events in a period. This will be refined further with the new file Dave got, but I am guessing it will be pretty close to this table. The table is self-explanatory but Dave’s notes are below. Hospitalization percents have somewhat stabilized but case percents and death percents are rising. You will note that over half of deaths in the most recent analysis period were breakthroughs.
Dave’s notes:
- In personal communication with DOH they have stressed that the new breakthrough cases, hospital admissions, and deaths that are added to the cumulative totals each Monday in the Vaccine Breakthrough Report might have occurred any time during the analysis time period. The analysis time period is defined as always starting May 1, 2021, and ending on the date given as the vaccinated population date along with the breakthrough data each Monday. This end date has been 5 weeks before the date of the Vaccine Breakthrough Report in recent weeks, but has varied in the past. For example, for the most recent Vaccine Breakthrough Report published on 11/08/2021 here https://www.health.state.mn.
us/diseases/coronavirus/stats/ vbt.html#vbto1 the date of the vaccinated population is given as 10/03/2021. Each week the end date of the analysis time period is expected to move later by 1 week. - Total cases, hospital admissions, and deaths that occurred during the analysis time period are taken from data tables published every week day on the Minnesota Update web page here https://www.health.state.mn.
us/diseases/coronavirus/ situation.html. These events are for all ages, even though currently all of the breakthrough events are ages 12 and over. Since we are now vaccinating the 5-11 year old age group they will soon be part of the population subject to breakthrough covid events. If only those 12 and older were included in the analysis the percentages of breakthrough cases and hospital admissions would be somewhat greater. - All of the breakthrough cases, hospital admissions, and deaths that are reported each week occurred during the analysis time period, per DOH communication. Therefore the breakthrough events are simply the cumulative totals published every Monday.
- I then simply calculated the cumulative breakthrough events as a percentage of the total cases, hospital admissions, and deaths that occurred during the analysis time period.
- You will see that the percent of breakthrough cases, hospital admissions, and deaths tends to increase each week. This does not necessarily mean that breakthroughs are occurring at a higher frequency in more recent weeks. It might be caused by DOH identifying more older covid breakthrough events as time goes on. All we can say is that over the entire analysis period the best estimate of the overall rate of breakthrough cases, admissions, and deaths is represented by the last entry in the table.

Excellent summary. Thank you!
Brilliant work by Dave. Thanks!