Dave Dixon has poured his heart and soul into getting better data out of the DOH and that has partly occurred witih release of a new file that includes dates of cases and some age data. Dave is pushing them to provide dates of hospitalizations and deaths and other data and we will keep insisting on getting this data updated every week. The chart below is Dave’s first effort based on the new file. You see some zigzagging that is likely an artefact of the process used to identify breakthrough cases and events, over time it should fill out more evenly. But you also see the trend, which isn’t surprising as the vaxed population is now much larger than the unvaxed one. You can’t call this an epidemic of the unvaxed. But do recall the comments I made again in the breakthrough table published earlier. Rates are the most important marker of effectiveness and the vaccinated have lower rates of hospitalizations and deaths, although that effect is lessened in the very old. The concern I have is that the absolute numbers in the fully vaxed are enought to sustain epidemic terrorism if we let it. We have to get past this.
Dave’s notes on how he generated the charts:
Comments, Sources, and Methods:
1. On 10/28/2021 we had requested that the Minnesota Department of Health (MDH) provide us, under the Minnesota Data Practices Act, information regarding Minnesota’s breakthrough Covid cases (breakthrough cases being defined as someone who tests positive for Covid 14 or more days after completing their vaccination series). Specifically, for each breakthrough case, we asked for the date of specimen collection, date of hospital admission, and date of death, as well as the age of each individual. This Data Practices Act request was separate from a much more comprehensive request submitted some weeks ago, and we hoped that perhaps a simple, more focused request might be acted upon. We were surprised when on Wednesday, Nov. 10, 2021 MDH provided an Excel spreadsheet containing information about 57,023 breakthroughs cases. The data provided was the date of specimen collection, the age of the individual, and Yes/No flags for whether the case was hospitalized or had died. We were not given the date of hospitalization or death, and we followed up with a request for these dates as well.
2. As of Monday, 11/02/2021, MDH’s Vaccine Breakthrough Report web page https://www.health.state.mn.us/diseases/coronavirus/stats/vbt.html reports a total of 57,023 cumulative breakthrough cases, exactly matching the total cases in the data they provided (Note that it is necessary to use the Internet Archive https://archive.org/web/web.php to look at past data on the Vaccine Breakthrough web page). We will make the reasonable assumption that we were provided complete data as of 11/02/2021, the week prior to when we received the data. In addition, the MDH data identified 2609 breakthrough hospital admissions and 372 breakthrough deaths, exactly matching the cumulative totals reported on 11/02/2021 on the Vaccine Breakthrough Report web page.
In the breakthrough data provided by MDH, the earliest breakthrough case is 3/08/2021, and the most recent is 10/23/2021.
3. There are several concerns we have about breakthrough data in general:
A. We know that there are likely to be breakthrough cases that have not been identified by MDH, because the vaccination occurred out of state, by the Veterans Administration, or by a Native American medical facility. In response to a query to MDH on 9/23/2021 we were informed that MDH has access to vaccination records of Minnesotans vaccinated in Iowa, Wisconsin, and North Dakota if they gave the provider a Minnesota address. MDH does not have access to vaccination records in any other state. MDH does not have access to Veterans Administration vaccination records either, and only partial or limited access to Tribal health organizations vaccination records.
B. We are unsure how complete the data matching process is for MDH even for the vaccination records in their possession. We suspect, for example, that on 11/08/2021 that MDH reported additional breakthrough cases as early as 5/02/2021, by examination of the breakthrough case, hospital admission, and death rates associated with the charts and tables on the Vaccine Breakthrough Report web page https://www.health.state.mn.us/diseases/coronavirus/situation.html#vbt2 . It is reasonable to assume that in the future additional older breakthrough cases will be identified and published.
C. It is likely that there are people who may have contracted a mild enough Covid infection that they did not seek medical attention or get tested, causing an undercount of the true number of breakthrough infections.
4. We proceeded with data analysis, performing the following calculations:
The 57,023 breakthrough cases were sorted by date and the number of cases per date was determined. A 7 day running average of cases per day was then calculated for each date.
Since we were not given the date of hospital admission, we used an assumed average lag of 3 days between date specimen collection and admission to a hospital. In reality the lag is likely to be highly variable, with lags of zero days for people admitted for non-Covid reasons and then testing positive, and longer lags for mild cases. The cases admitted to the hospital were then counted by date, using the 3 day lag from date of specimen collection. A 14 day running average of admissions per day was then calculated for each date.
Likewise, we used an assumed lag of 14 days from date of specimen collection to death. There is certainly a wide range of actual lags, but until we receive the actual data from MDH this will at least give us a rough idea of how the breakthrough deaths match up to total deaths. The Covid deaths were then counted by date. A 21 day running of deaths per day was calculated for each date.
Counts of total Covid cases by specimen collection date, by hospital admission date, and by date of death are found in the data tables on the Minnesota Situation Update page: https://www.health.state.mn.us/diseases/coronavirus/situation.html These data tables were downloaded, allowing us to calculate the average cases per day, hospital admissions per day, and deaths per day, using the same length running averages used for the breakthrough events.
The ratio of daily breakthrough cases, admissions, and deaths of the total daily cases, admissions, and deaths was then calculated from the running average daily events.
The need to use running averages longer than 7 days is an indicator that the lags from specimen collection to admissions and death may be quite variable.
Note that running averages are lagging indicators since the time period being averaged ends on the dates being plotted.
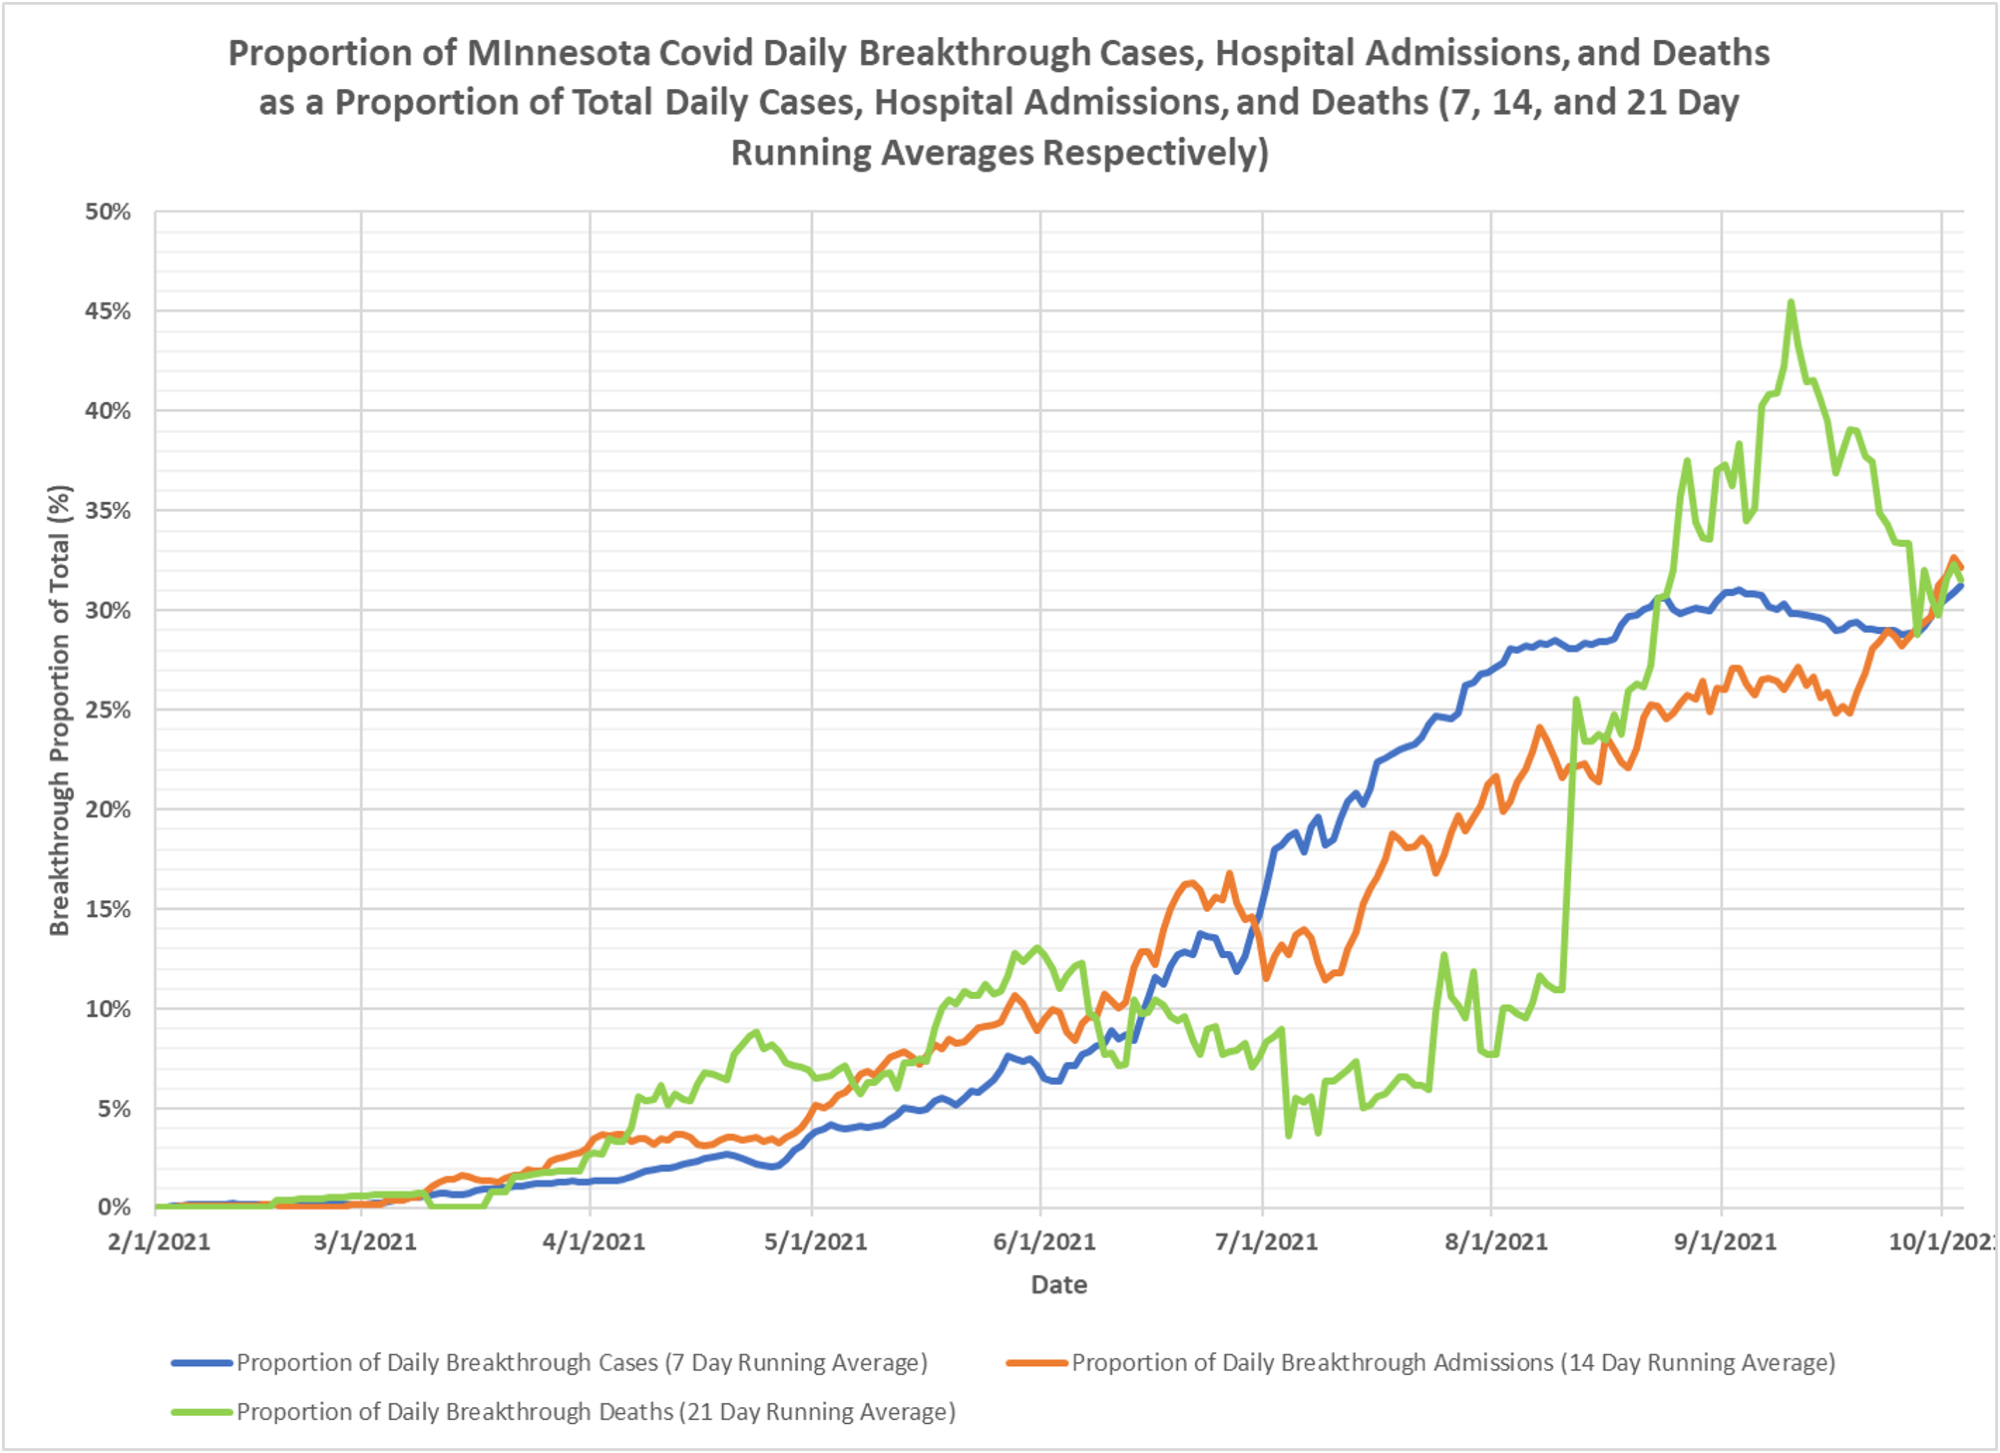
5. Some comments about the chart itself:
It is not surprising the proportion of breakthroughs is quite low in the Spring of 2021, as the number of people vaccinated was also low.
Breakthrough cases increase relatively smoothly to roughly 30% of daily cases late august 2021 and have fluctuated around 30% since then.
Breakthrough hospital admissions generally follows the breakthrough case curve, running within 5% to 8% of the breakthrough case proportion throughout 2021.
The proportion of daily breakthrough deaths is much more variable in relation to breakthrough cases. Breakthrough deaths were proportionally higher than breakthrough cases until June 2021, then much lower than the proportion of breakthrough cases throughout the Summer, and finally peaking at 45.5% of daily average deaths on 9/10/2021. The most recent data show breakthrough deaths at roughly 30%, similar to the breakthrough cases and breakthrough hospital admissions.
6. Next steps
Once the dates of hospital admissions and deaths are received, we will revise this chart.
Since we have been given the ages of the breakthrough cases, we can make a version of this chart broken down by age group. Charts using 10-year age groups as well vaccination age groups would be of interest.
It would be interesting to compare the proportion of breakthrough cases, hospitalizations, and deaths to the length of time since the individual was vaccinated. We will submit a data practices request to attempt to get this information.

Using simple technical analysis with your well improved data , we should watch : 1 / The slope of each moving avg and 2/ if when the shorter m.a’s cross above / below the longer m.a. Simple but valuable , with pure data (probably only 70-90% accurate in stock market since so much trading is polluted in so many ways) .