Another of Dave’s regular charts, which we use to see if there are some differential trends among age groups. Cases appear to be ticking up disproportionately in the younger age groups, but could be testing related. Don’t buy the Governor’s BS about child hospitalizations, you can see absolutely nothing going on there. That is just the scare campaign used by the Governor to stampede parents into getting their children vaccinated. But hosps and deaths are up in the very old, which are heavily vaxed. Great, great work by Dave in putting these charts together.
Dave’s notes, for you doubters of the data’s veracity:
Notes:
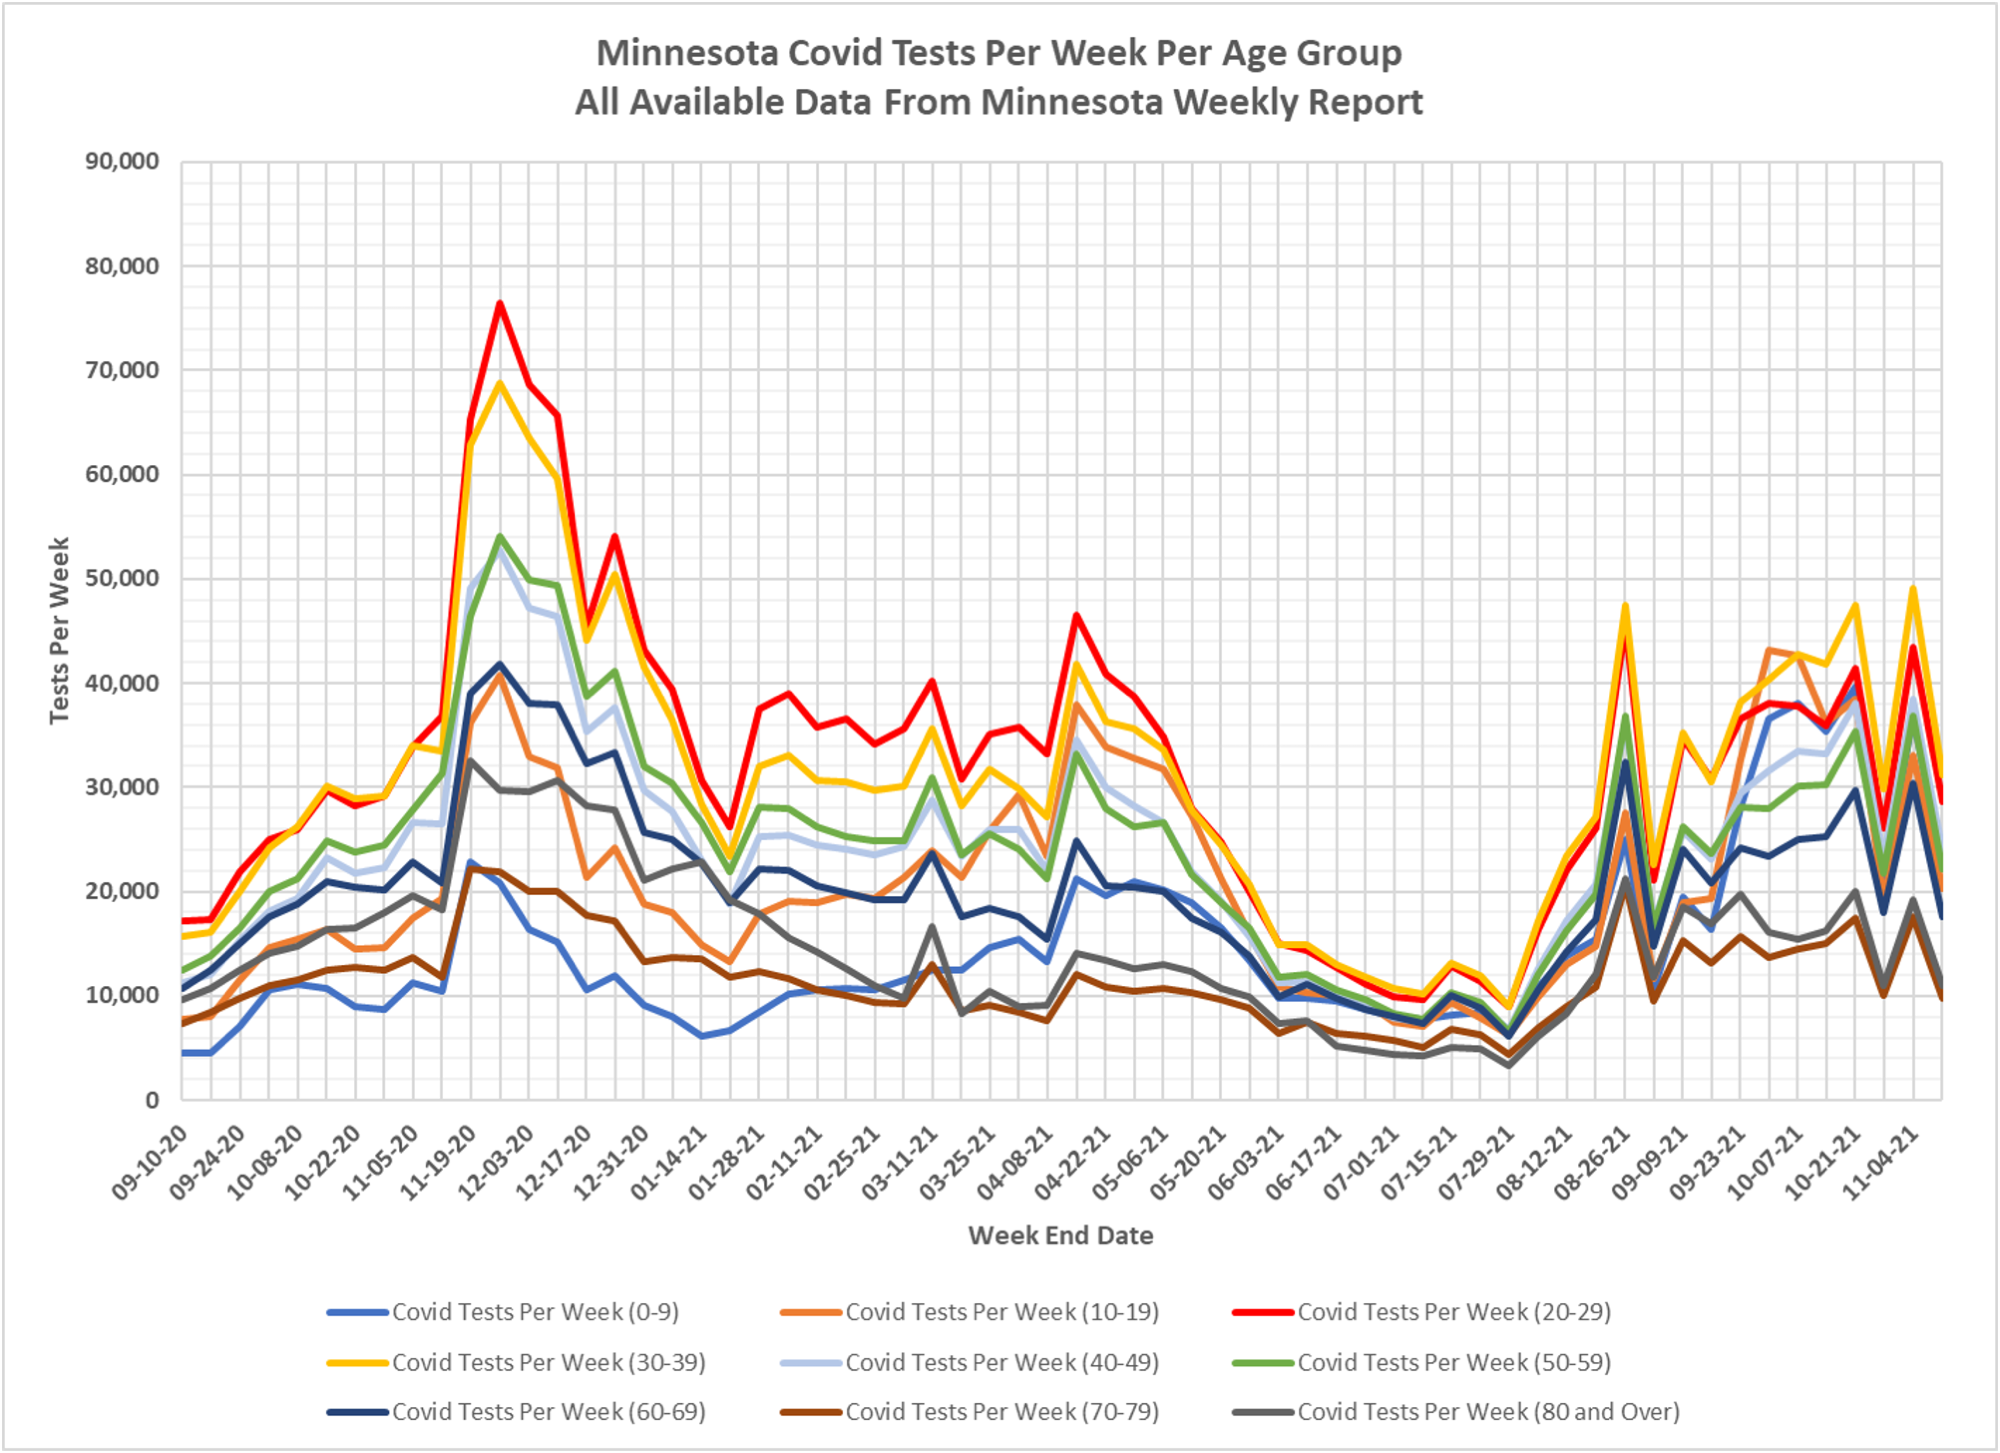
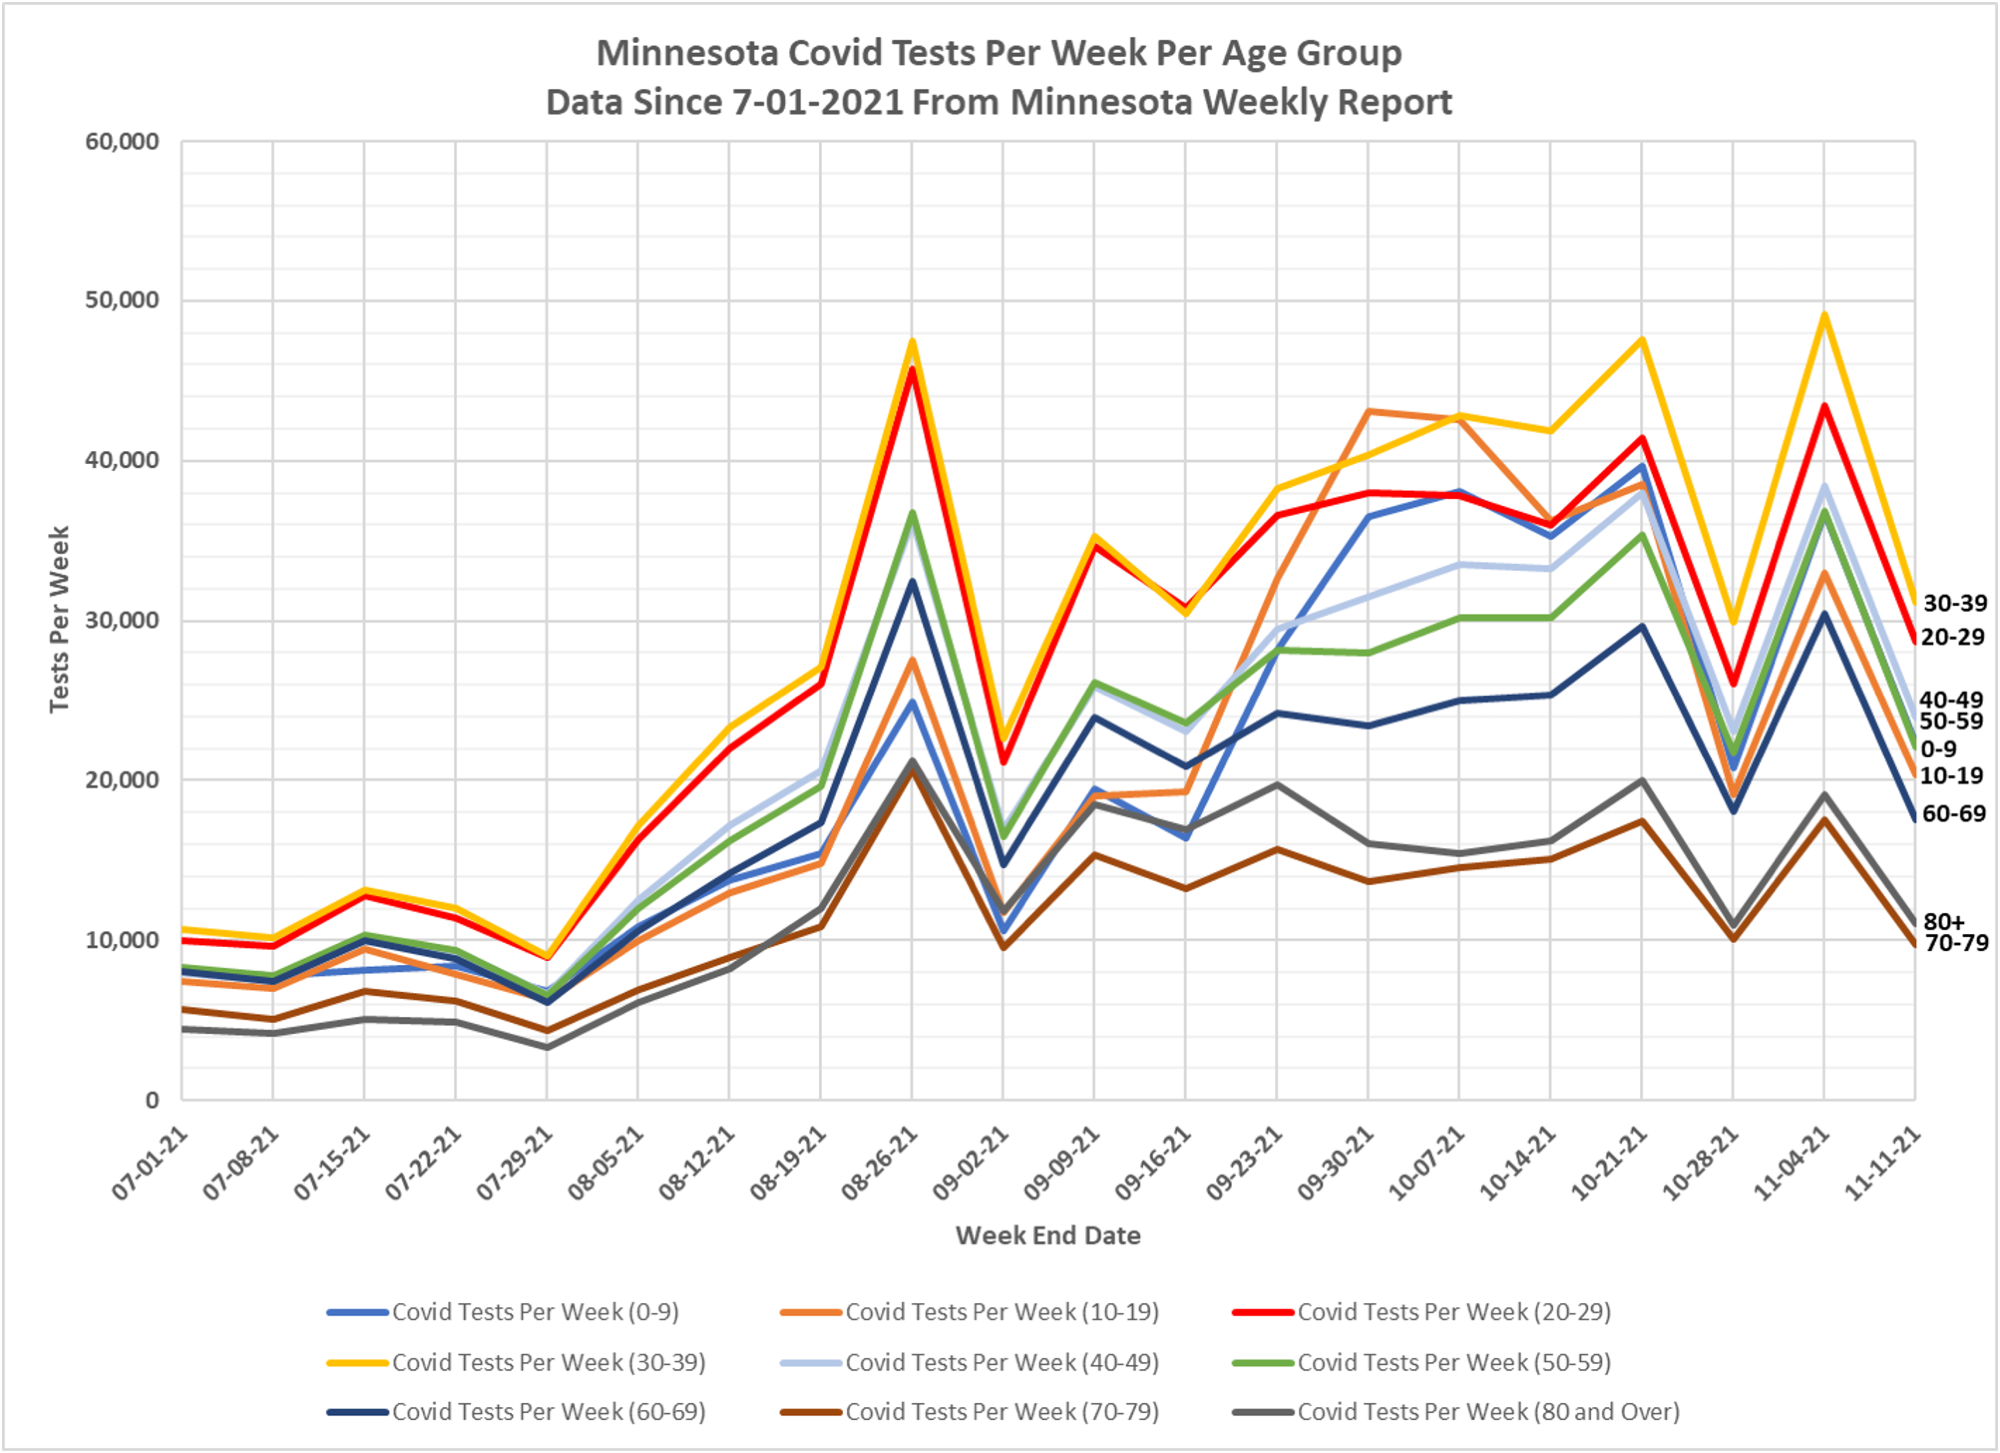
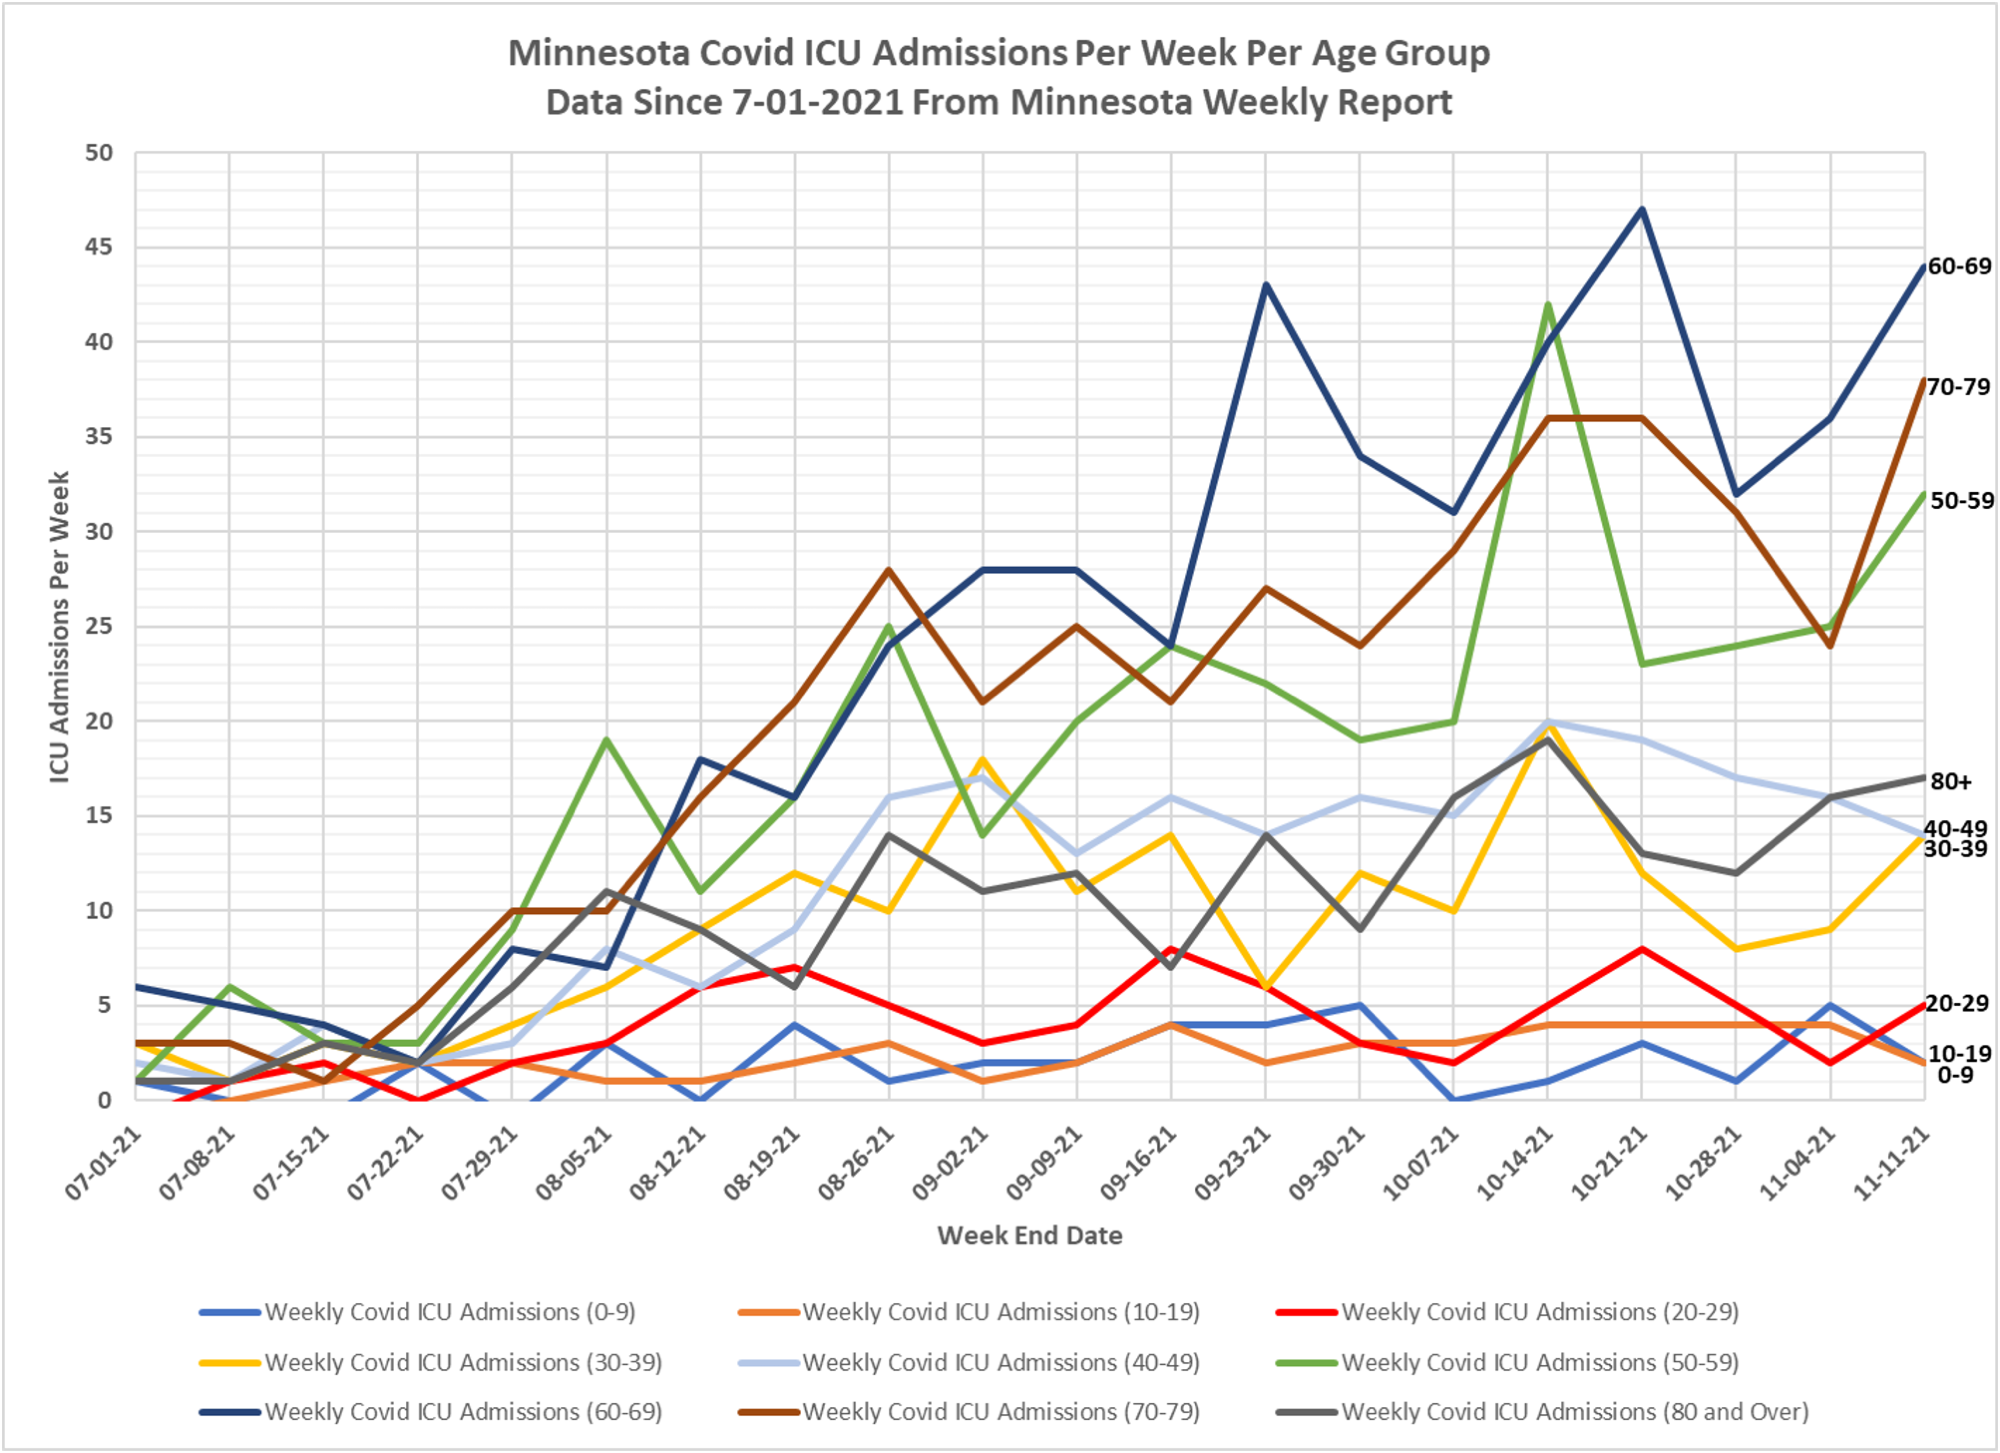
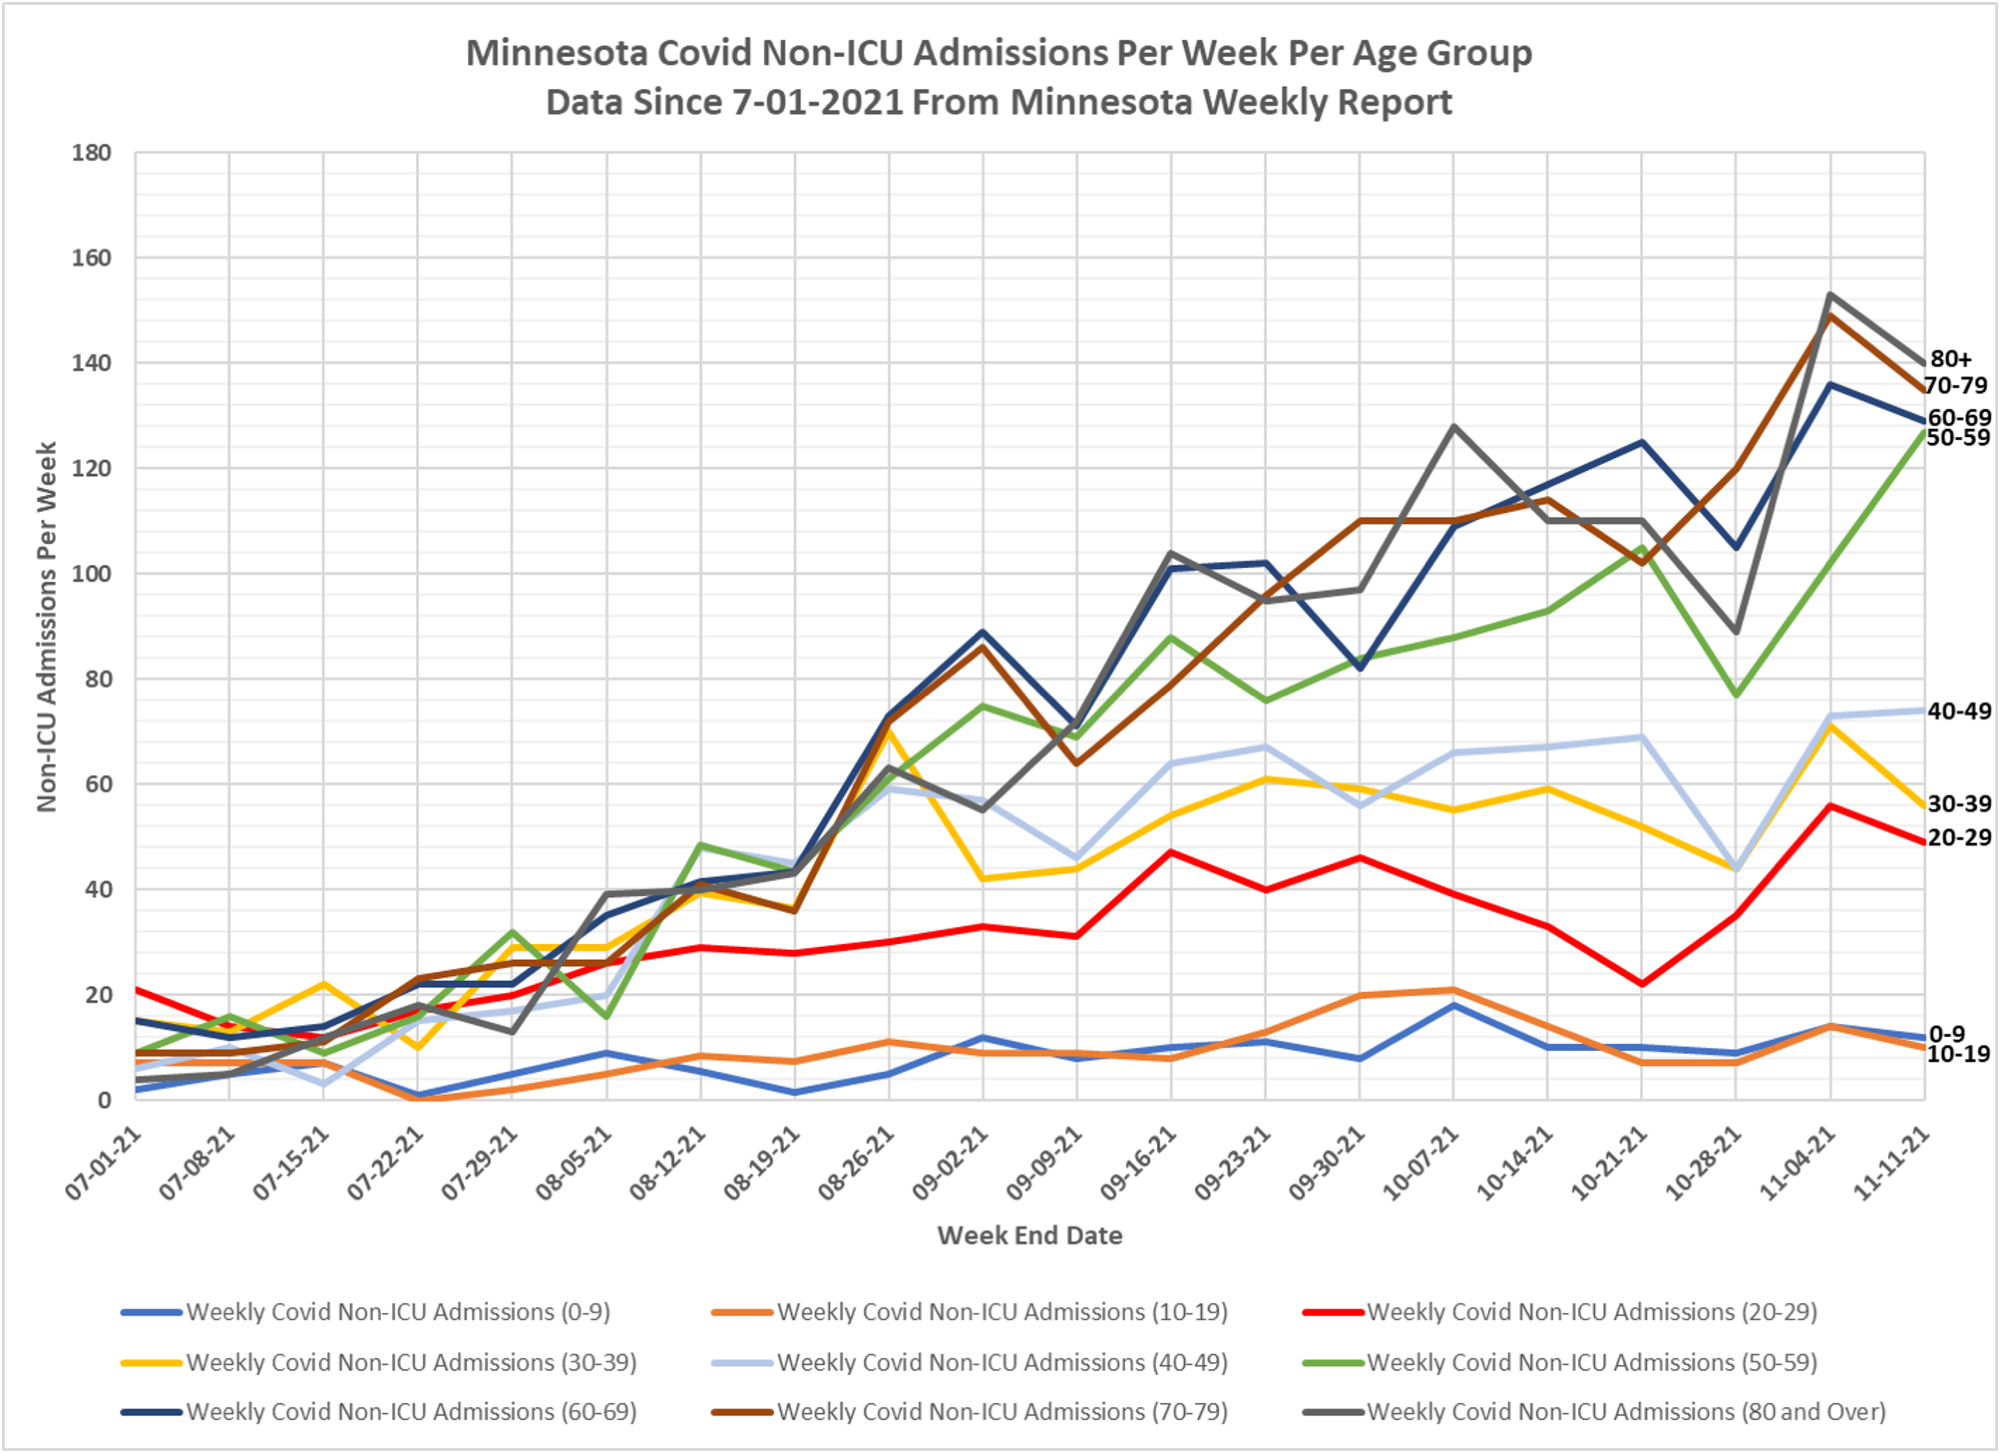
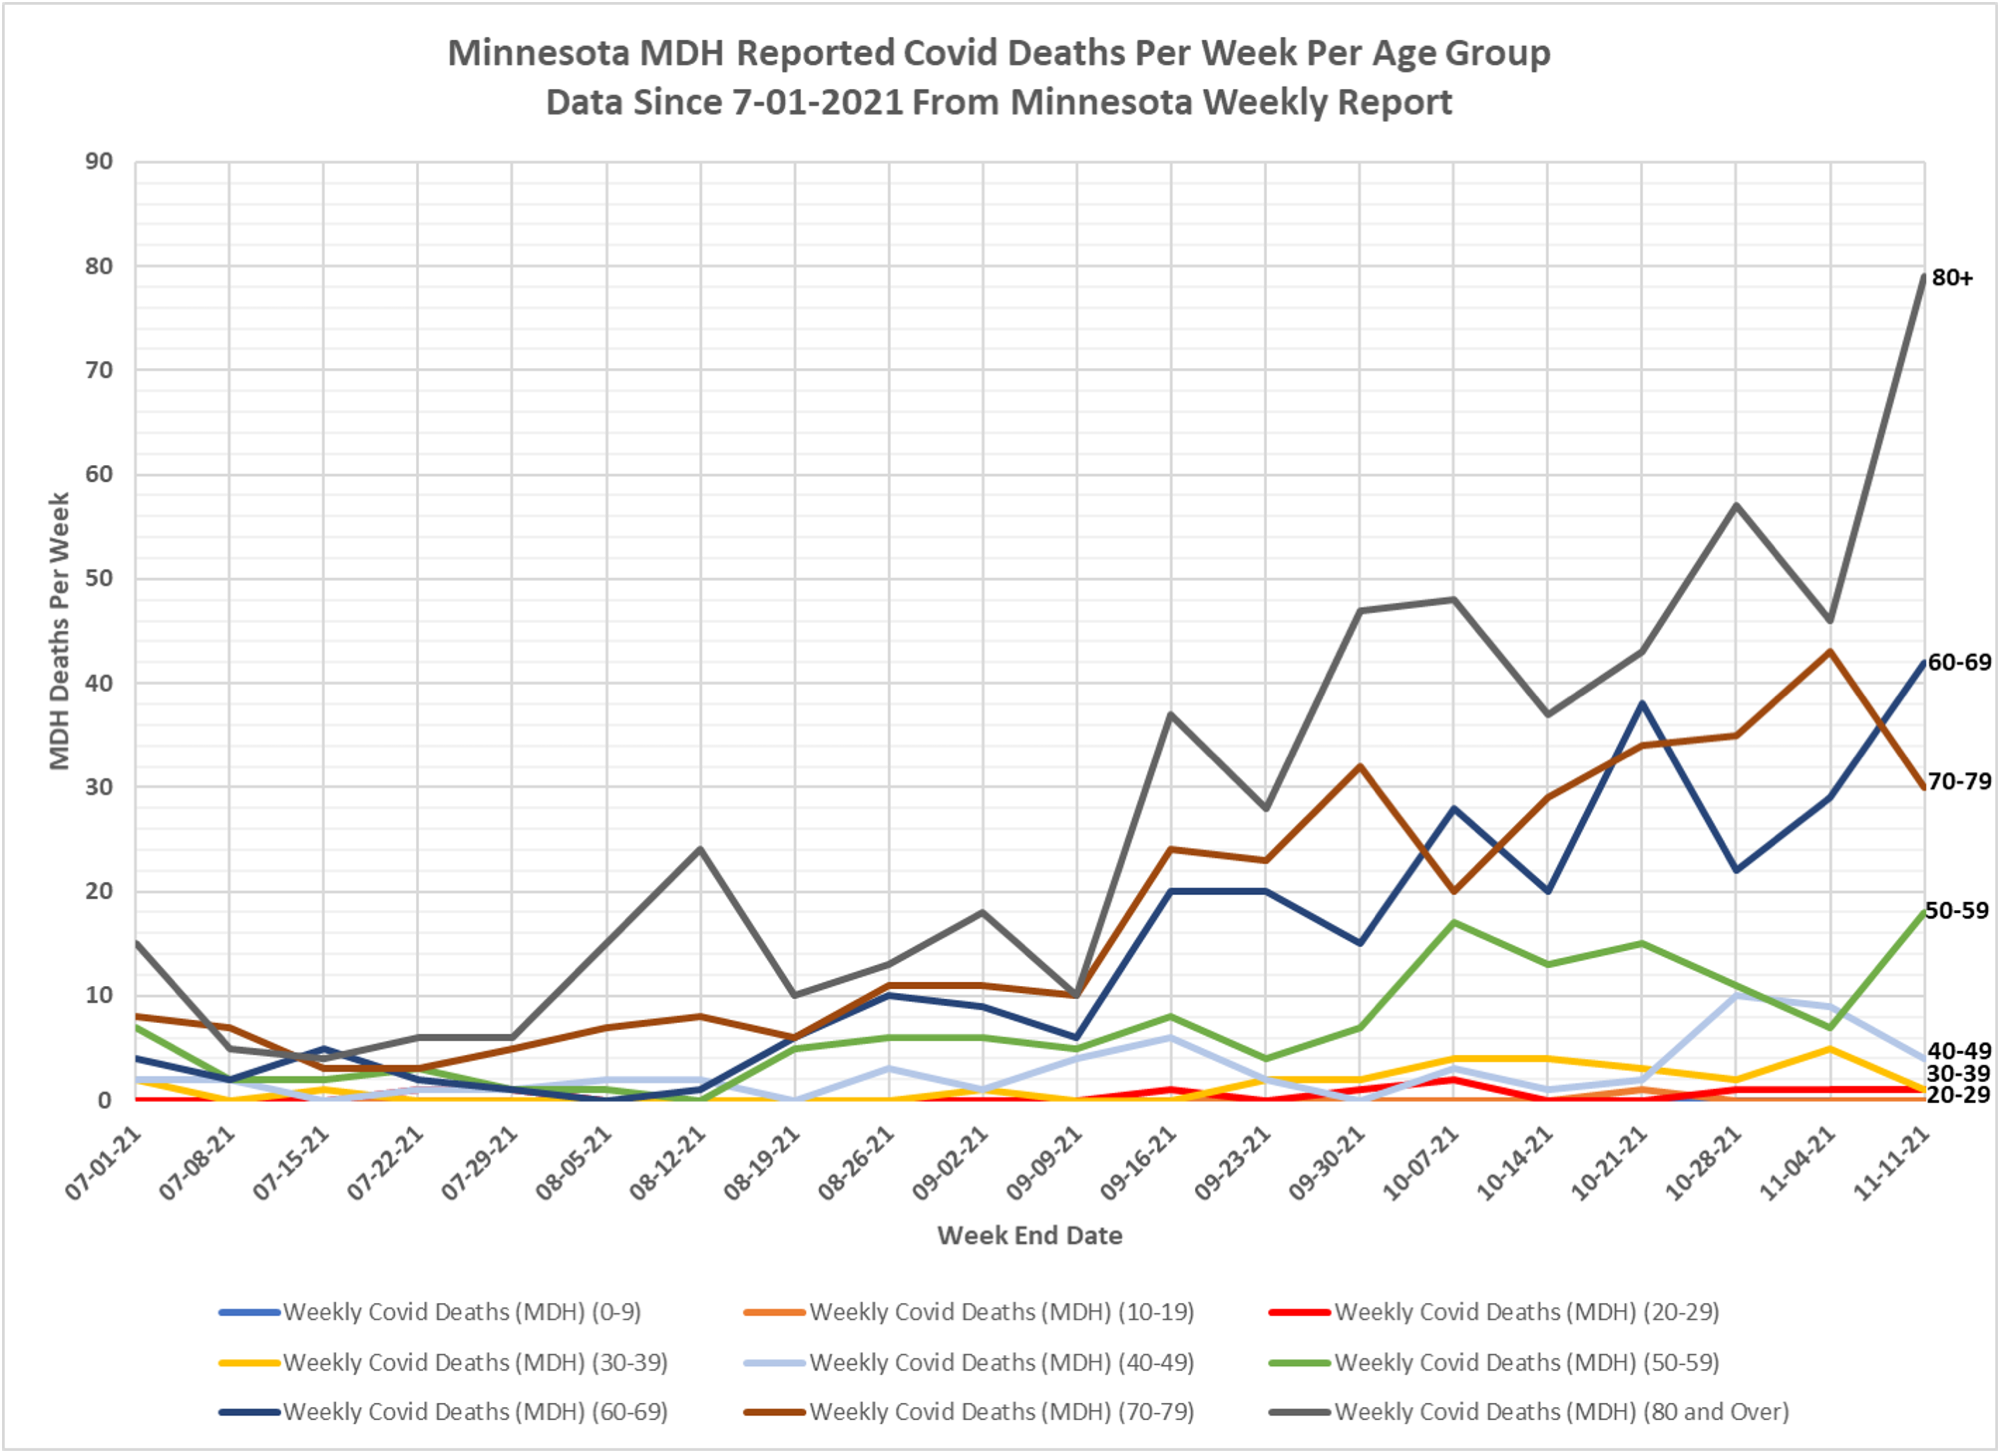
- As always, there are 2 slides for each set of data, one showing data for the whole pandemic and a second chart showing only data since early July, 2021.
- The data for the charts on testing, hospital admissions, and deaths comes from the Minnesota Weekly Report (available here: https://www.health.state.mn.us/diseases/coronavirus/stats/index.html). The data in the Weekly Report is presented as cumulative totals for each data type each week. I am taking weekly differences and assembling the data into charts. This data is by date of report, meaning the charts are documenting new events reported this week, even though the underlying event occurred sometime in the past. The data is provided for 5 year age groups, and I am assembling into 10 year age groups to make the charts more readable.
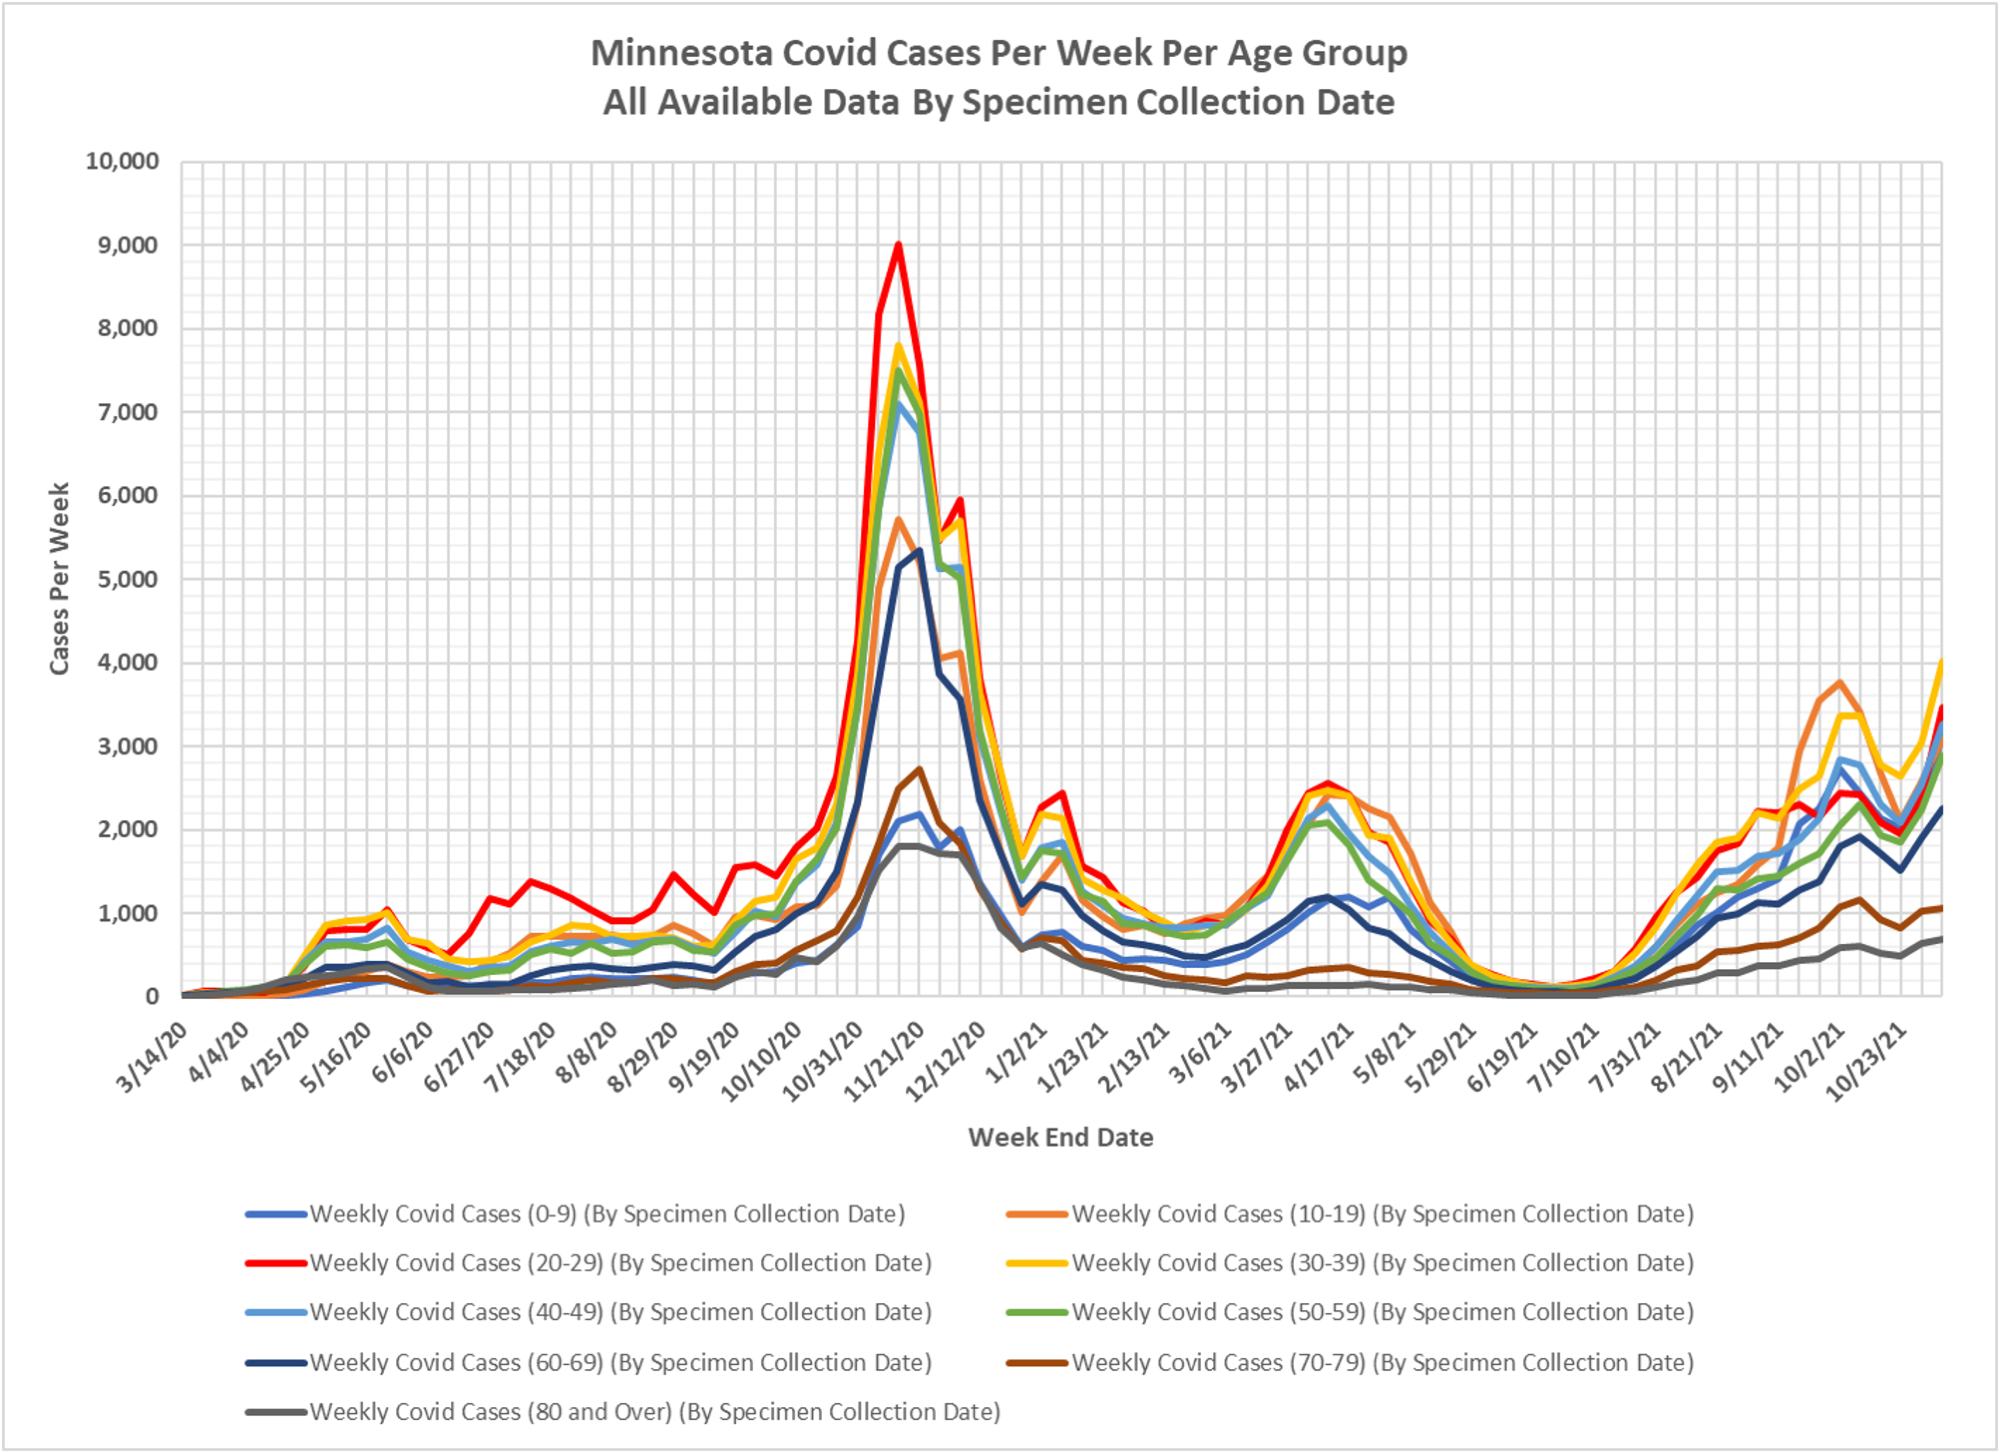
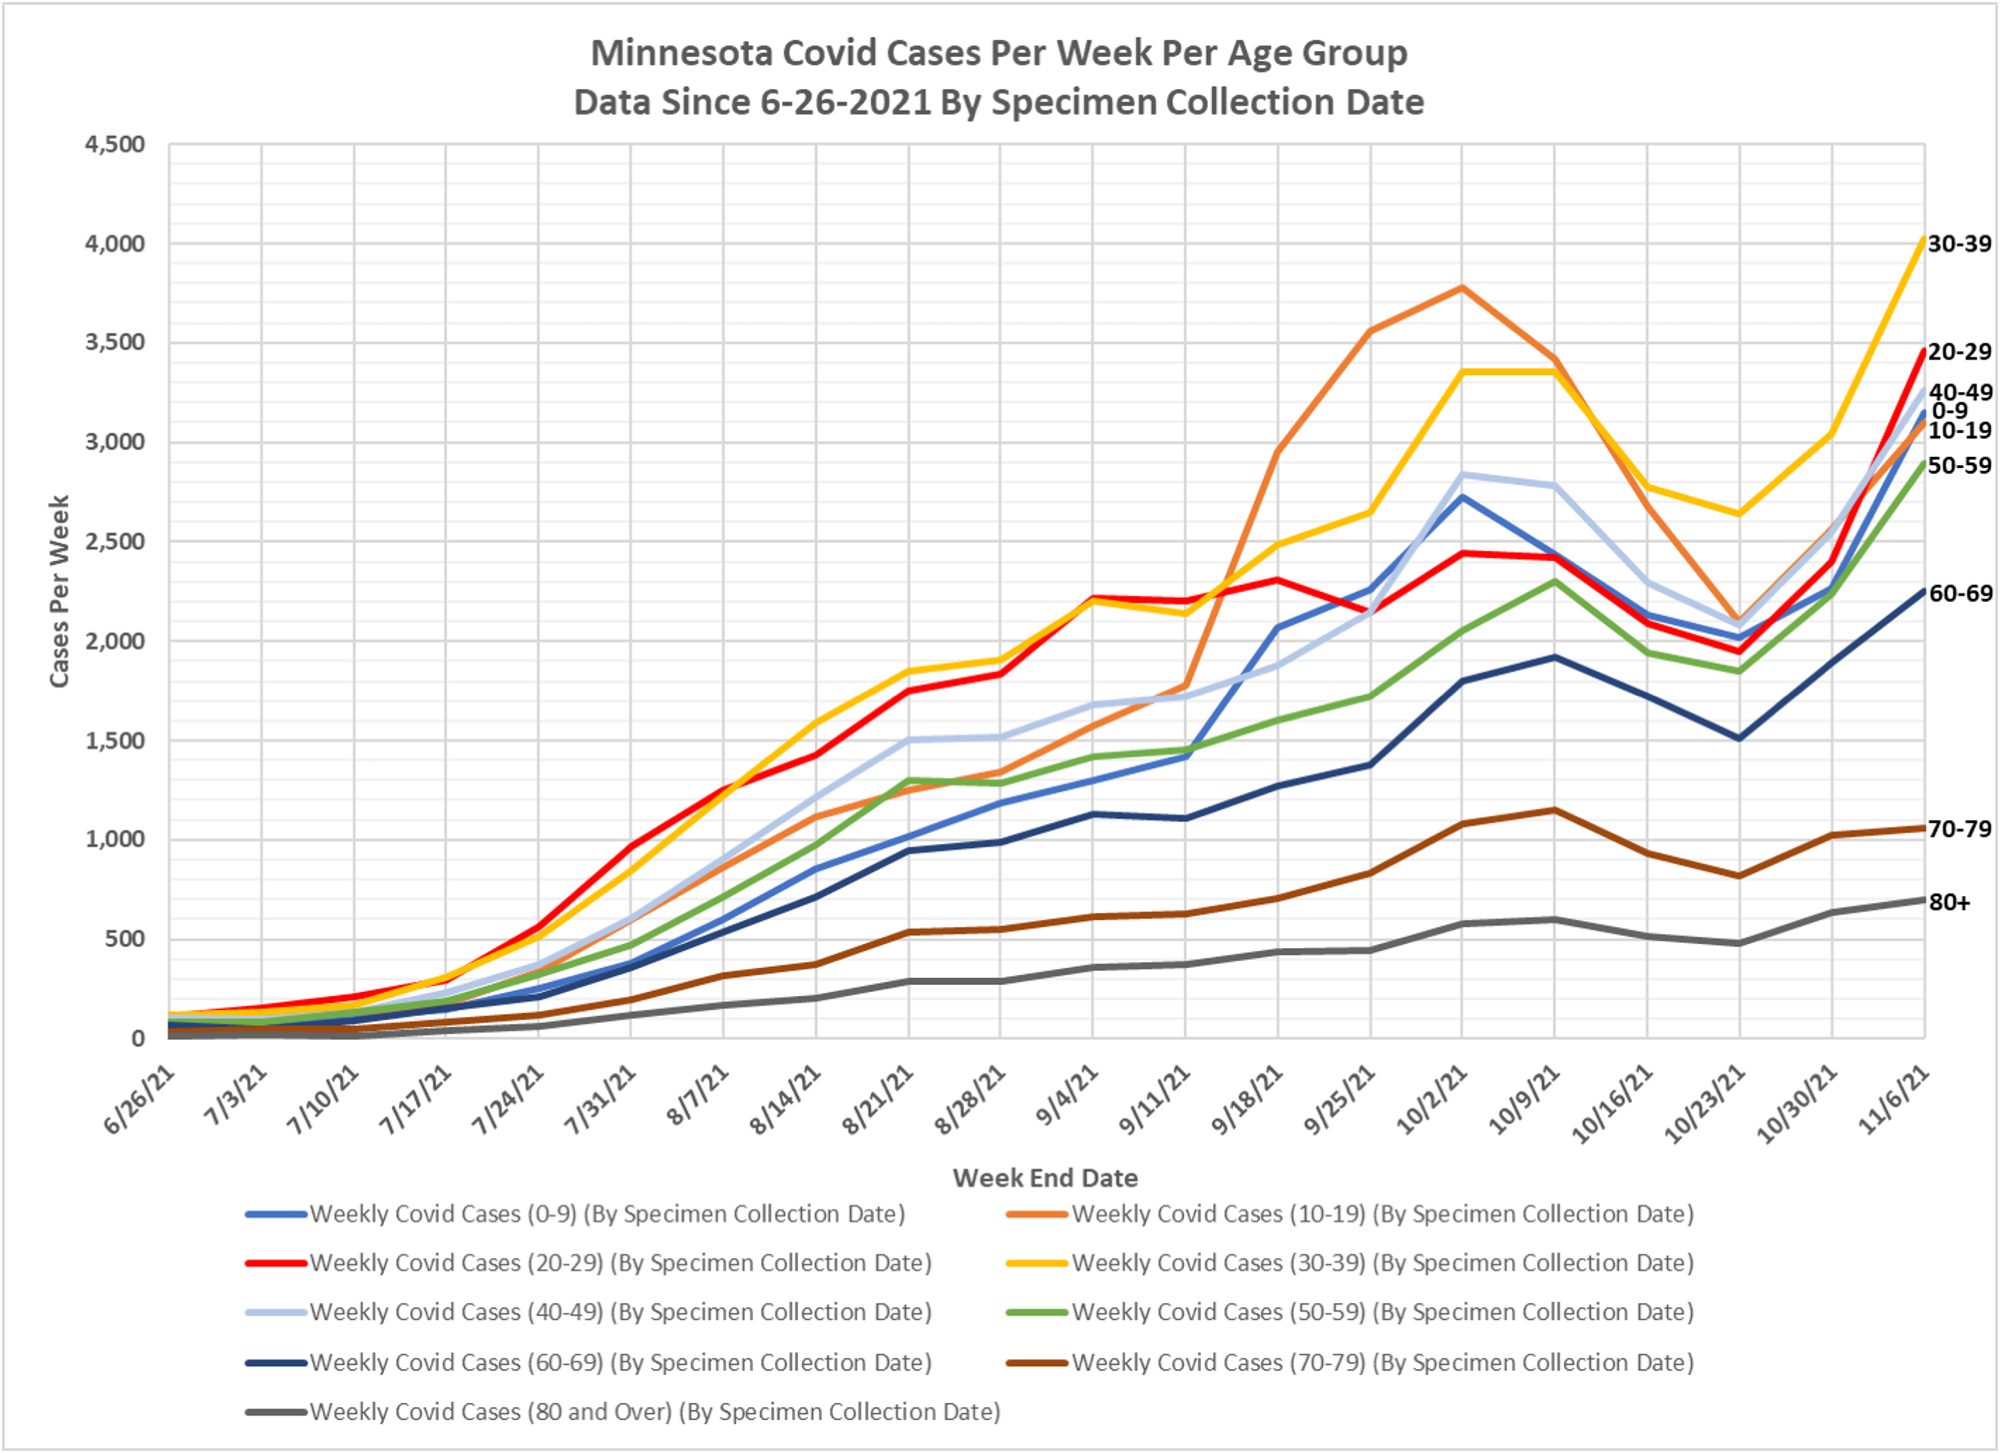
- The data for the Covid cases per week come from a data file published along with the Minnesota Weekly Report, here: https://www.health.state.mn.us/diseases/coronavirus/stats/index.html#wagscd1 This data is published by date of specimen collection, rather than by date of report as the other data is. The data is provided as cases per week in 5 year age groups. I am compiling the data into 10 year age groups in order for the charts to be more readable.
- Slides 1 and 2: Covid Tests Per Week
- The major changes up and down in weekly testing rates continues. I believe that these rises and falls in testing are an artifact of a data reporting problem, and not real changes in physical testing.
- The Minnesota Situation Update page (https://www.health.state.mn.us/diseases/coronavirus/situation.html) reports testing by date of test (although without the age breakdowns). They report a total of 249,358 the week ending 11-03, and a total of 280,686 tests the week ending 11-10. Therefore, the Situation Report actually reports an increase in testing this week over last week, while the Weekly Report data reports a drop in testing.
- Slides 3 and 4: Covid Cases Per Week:
- the Covid cases per week is higher this week in all age groups, and rising most sharply in the 20-29 and 30-39 age groups.
- The rate of rise in cases in lower in the older age groups,70-79 and 80+.
- Total cases for the week were reported as 23,881, an increase of 28.3% over last week’s total.
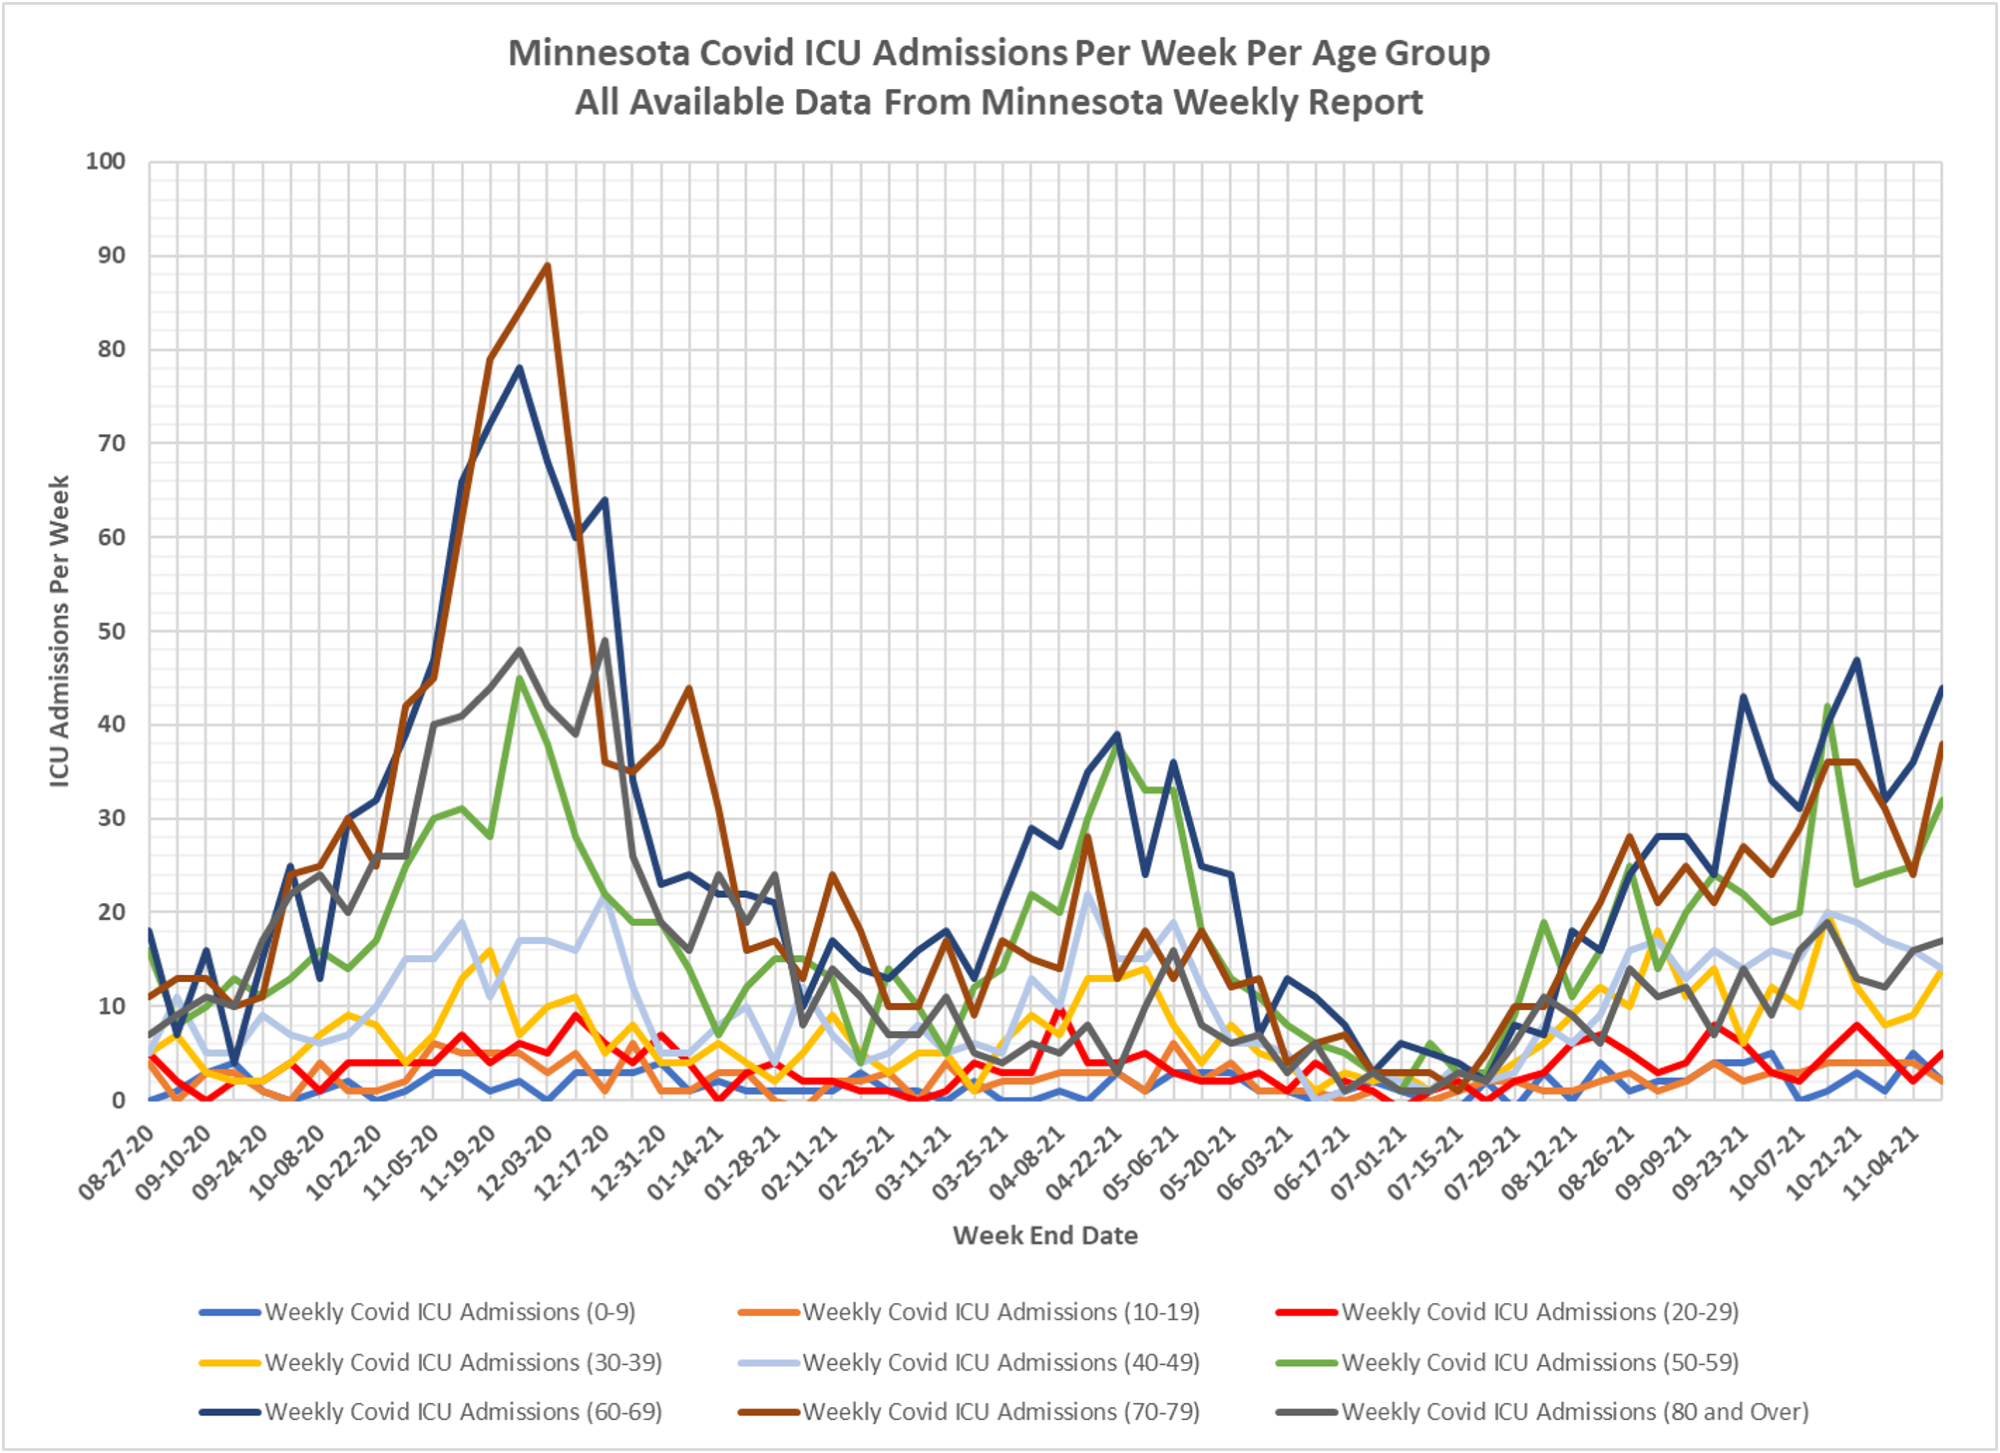
- Slides 5 and 6: ICU Admissions Per Week;
- These were two reported Covid ICU admissions in the 0-9 age group in this Weekly Report, and two in the 10-19 age group. There still appears to be very minor impact of Covid infections on ICU admissions for school age children.
- Total ICU admissions for the week were 168, which is 31 more than the prior week, and the highest since the week ending 12/17/2020, as last winter’s peak was receding..
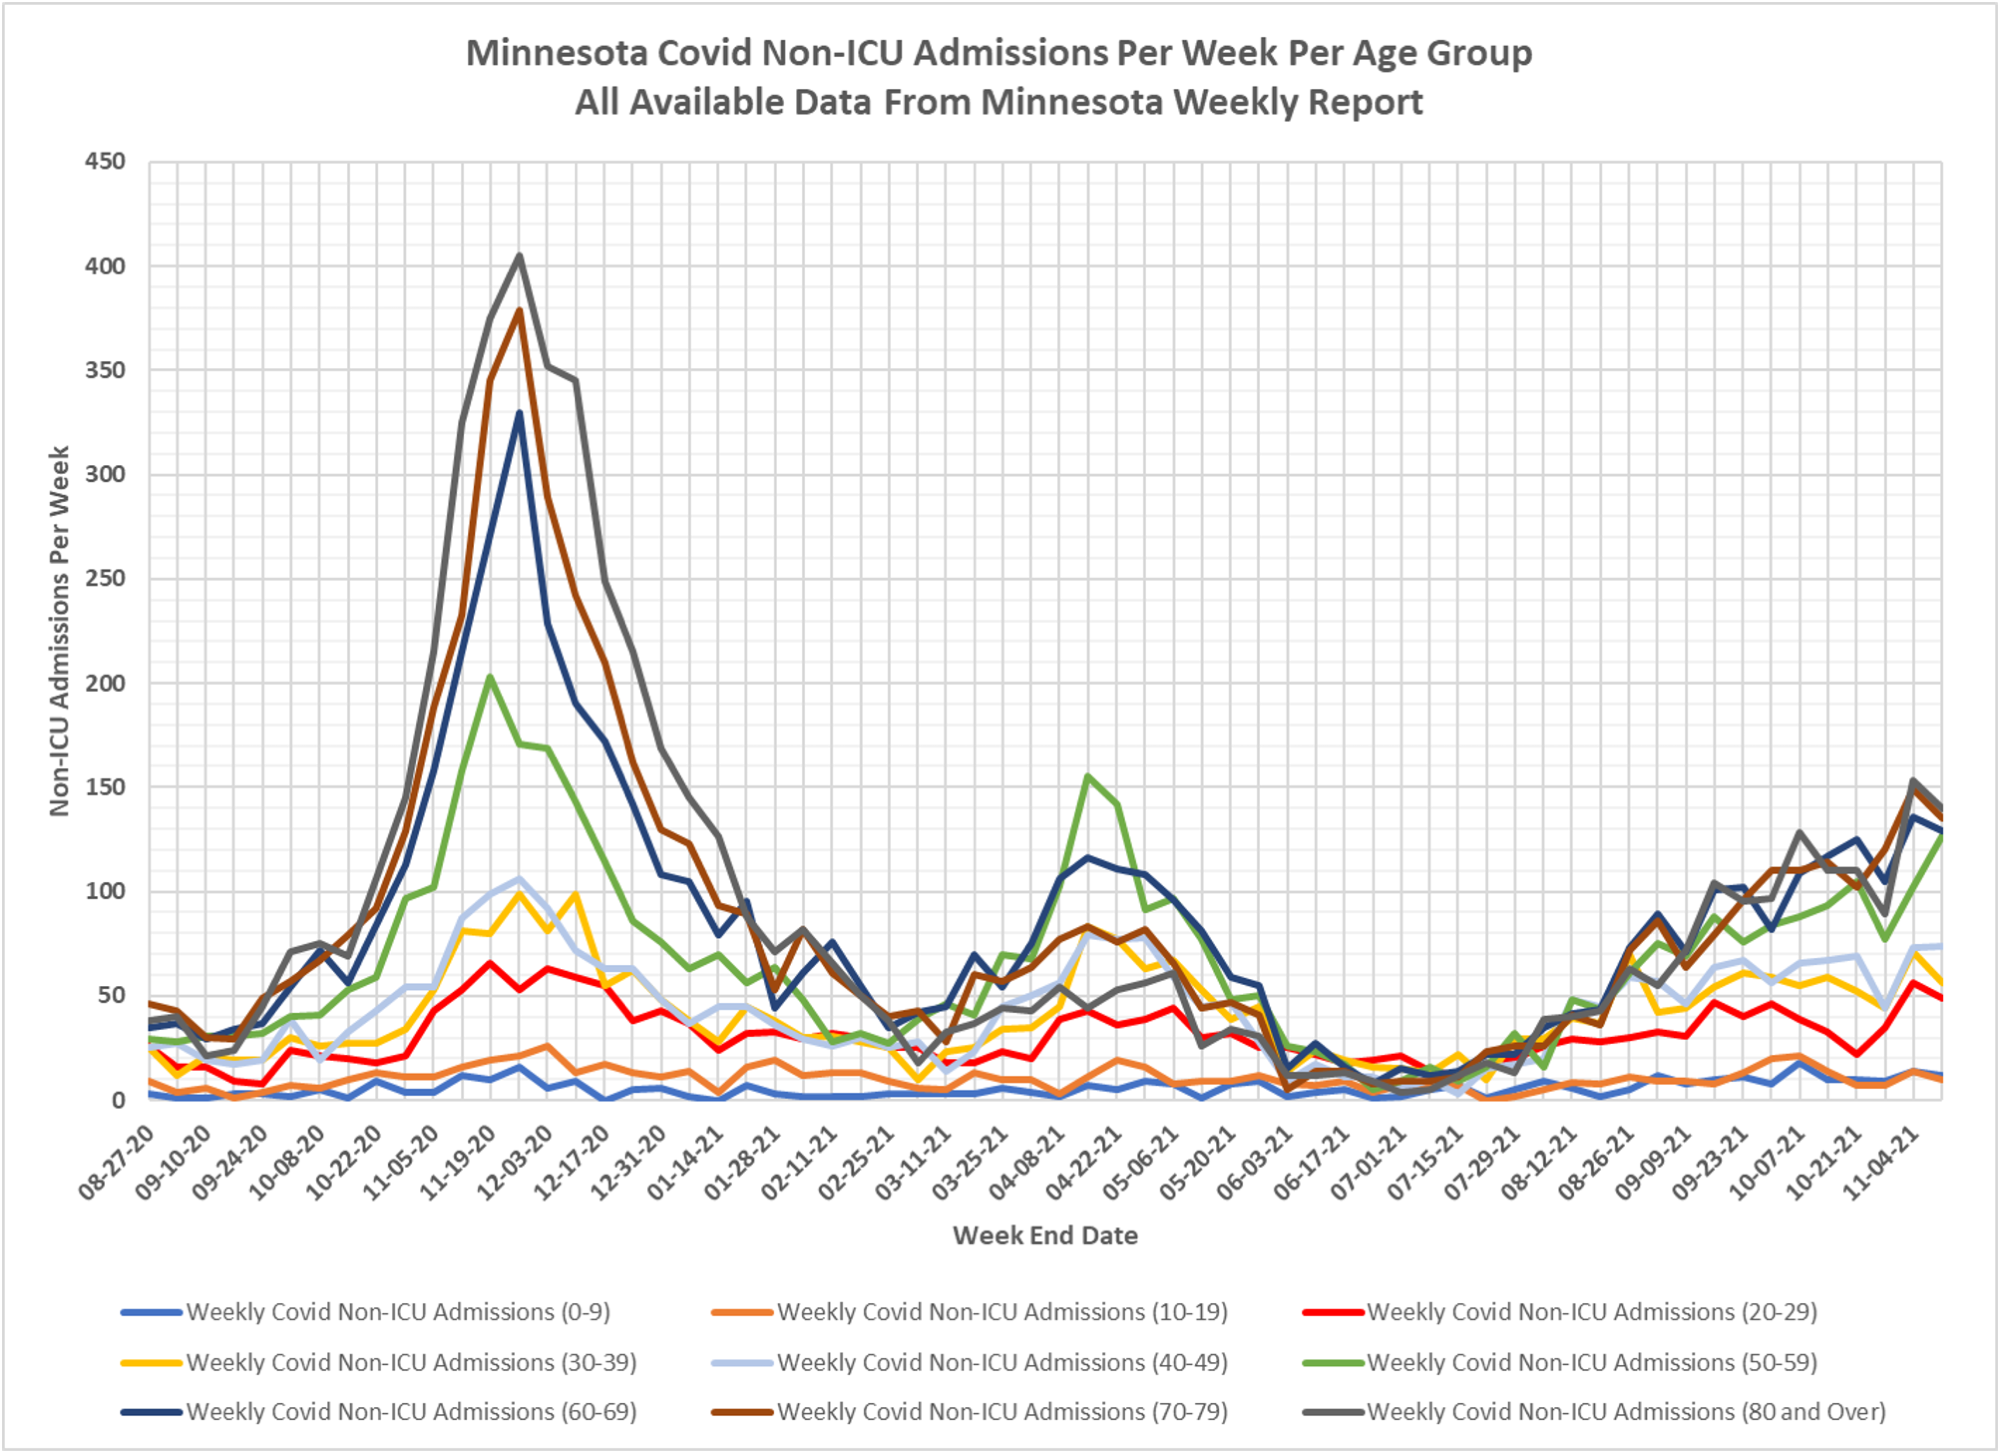
- Slides 7 and 8: Non-ICU Admissions Per Week:
- Non-ICU admissions were generally higher this week for the older age groups, compared to last week.
- Non-ICU Covid admissions for the younger age groups remain very low. The 0-9 age group had 12 Non-ICU Covid admissions for the week and the 10-19 age group had 10 Non-ICU Covid admissions for the week.
- Total Non-ICU Covid admissions for the week were 732, a reduction of 36 admissions from the 768 admissions last week.
- We have not been provided any data about the number of people admitted for non-Covid reasons but then test positive upon admission. The only data I have seen is from a Jeremy Olson article in the Star-Tribune (https://www.startribune.com/covid-19-levels-remain-lower-in-minnesota-despite-u-s-uptick/600077976/) which said that in a small study 51% of Covid patients were actually admitted for Covid, and the rest were admitted for surgeries or other reasons. I think it is reasonable to assume that half the Covid admissions continue to be for non-Covid reasons, until we are provided with better data.
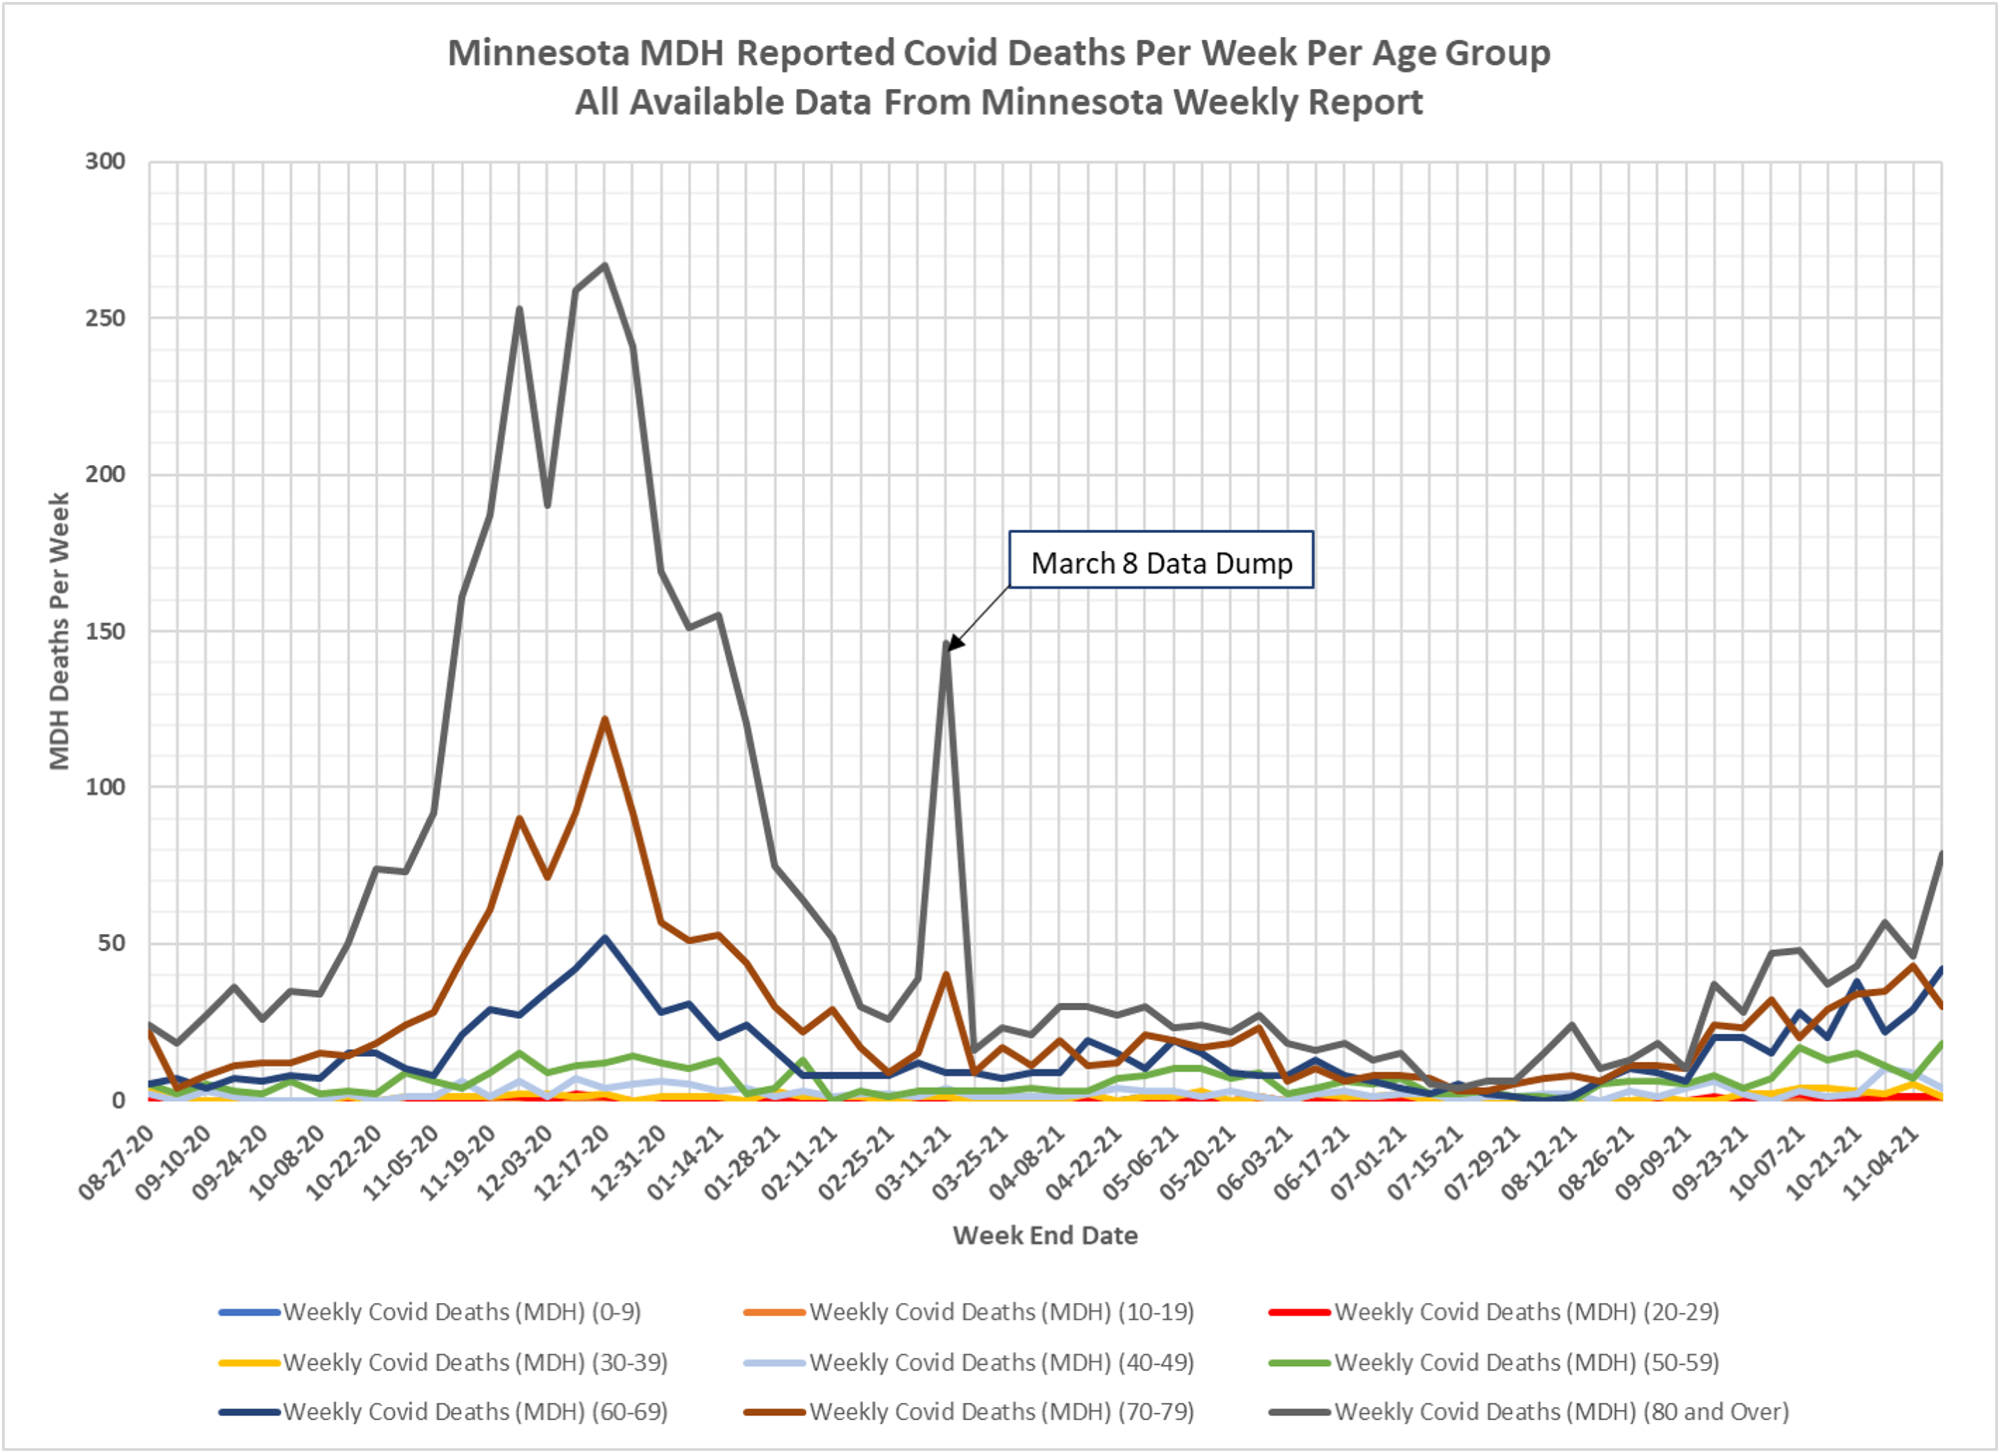
- Slides 9 and 10: Deaths Per Week:
- Deaths per week were overall higher for the week, led higher especially by the 80+ age group.
- Total reported deaths for the week were 175, an increase of 35 deaths over the week before.