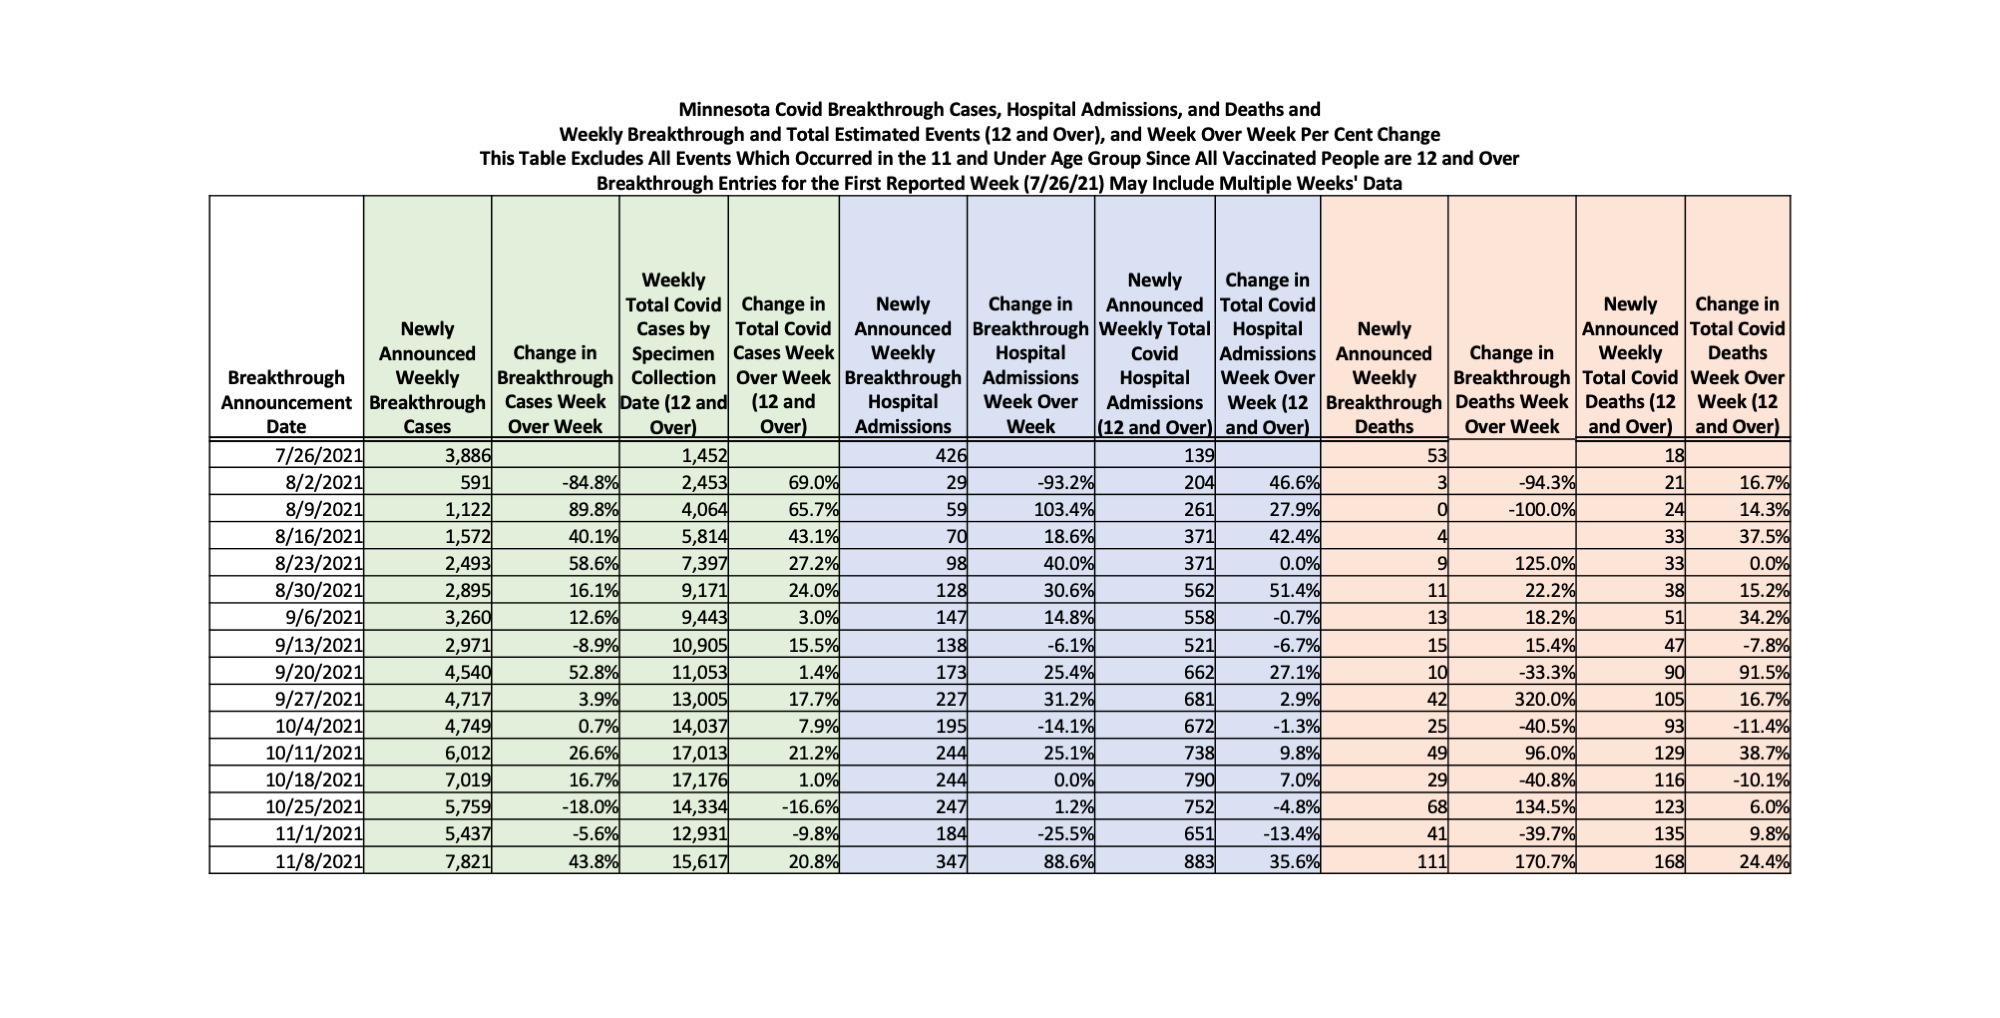
I teased this in an earlier post, here is Dave Dixon’s actual updated table. You can read the numbers for yourself, you can see the truth of what is happening and the trend. Cases, hospitalizations and deaths all rising far faster in the vaxed than in the unvaxed. Look at the week-over-week reported growth. I would love for DOH to whine about the comparison being inaccurate because of differential reporting lags, because they can solve that instantly by giving us dates of events. And vaxed events are undercounted. Dave has slightly adjusted matching reported data since my earlier post, so only 111 out of 168 reported deaths this week were in the vaxed. The multiple corrections on this today are due to trying to figure out the best way to match breakthrough reported numbers to total reported numbers. If you look at the table it looks like DOH only tries hard to identify breakthroughs every other week. Note also the massive breakthrough case and hospitalization growth this week. I will push and push on this til the state comes clean. You can count on that.


What are your thoughts about the vaccine’s manufacturing QC process, apparently outsourced in some cases, leading to ‘off’ doses that are causing the VAERS data to balloon as opposed to an unsafe product by design (mRNA strategy and the apparent lack of control of the spike protein replication in some). Or is everything just fine, consistent manufacturing processes, and the risk lies with the individual’s response to the product?
The chart is still confusing as the numbers presented don’t appear anywhere on the weekly report thus seeming ‘un-sourced’ and making it ‘non-persuasive’ to others. A disclaimer would be helpful so let’s see if I’ve got this right: Every week MN-DoH reports three data points in their ‘COVID-19 Vaccine Breakthrough Weekly Update;’ total cases, total cases hospitalized and total deaths. Each week’s total is subtracted from the prior week’s total yielding the first data point in the three shaded areas within each row presented here (data in the third column per shaded area in each row is extracted in a similar way from other DoH source material -I don’t know where). These numbers are used to generate data that populates columns 2 and 4 in each shaded area.
…How did I do?
Paying kids to get vaccinated, using college lottery systems, Sesame Street characters, so this is NOT COLLUSION ? Maybe the White House changed the definition of collusion behind the scenes?
I hope they all rot in what ever hell there is when a future administration blows this up and starts the Nuremburg 2.0 trials.