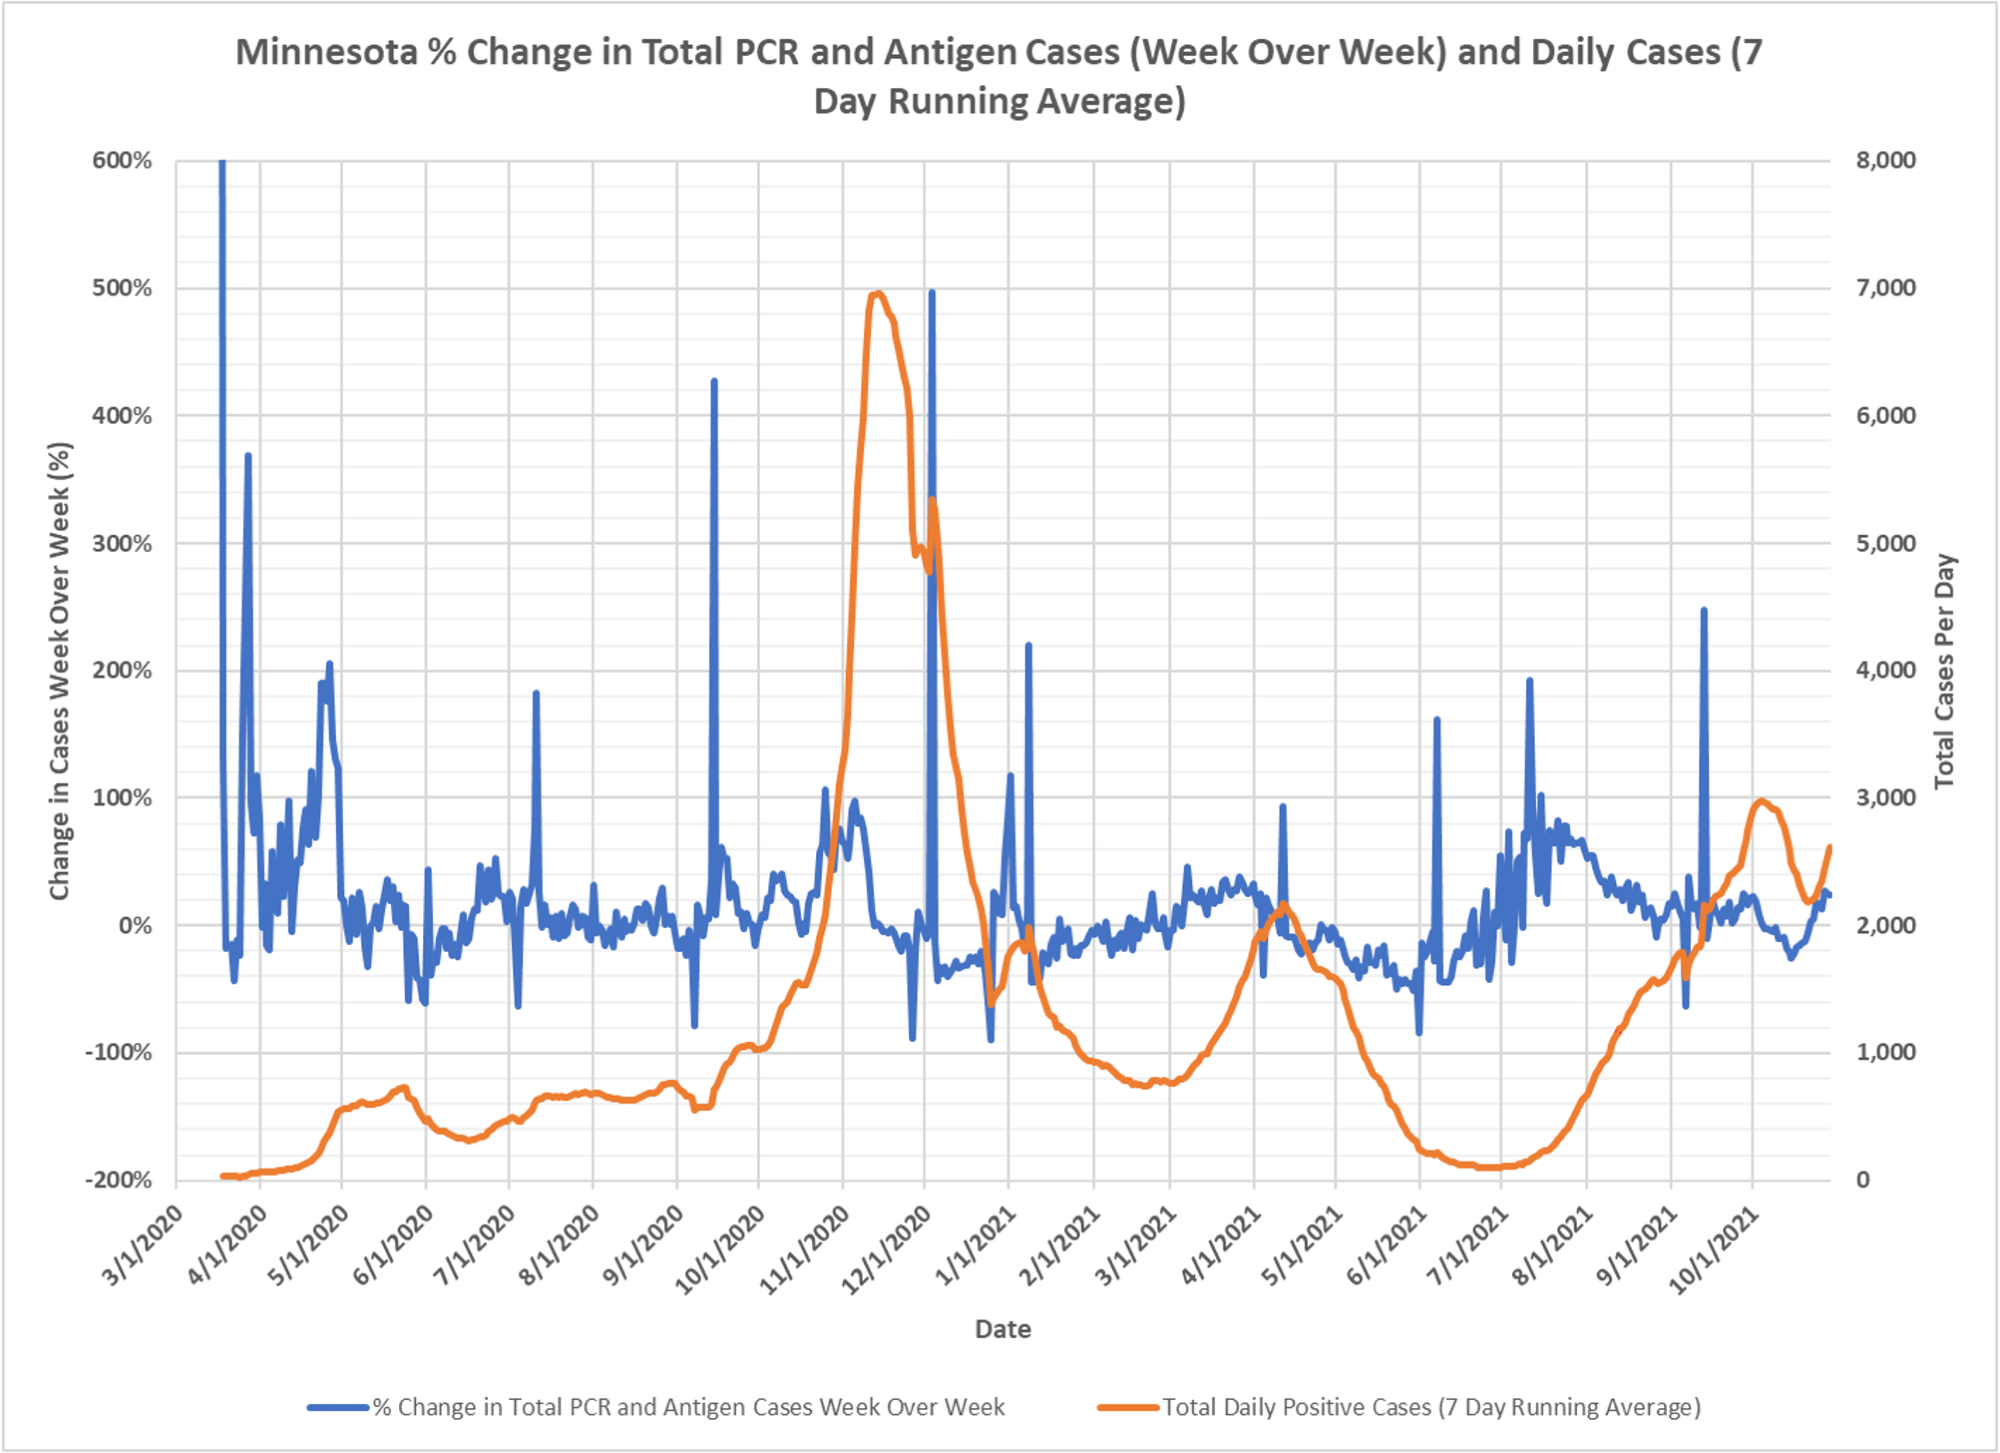
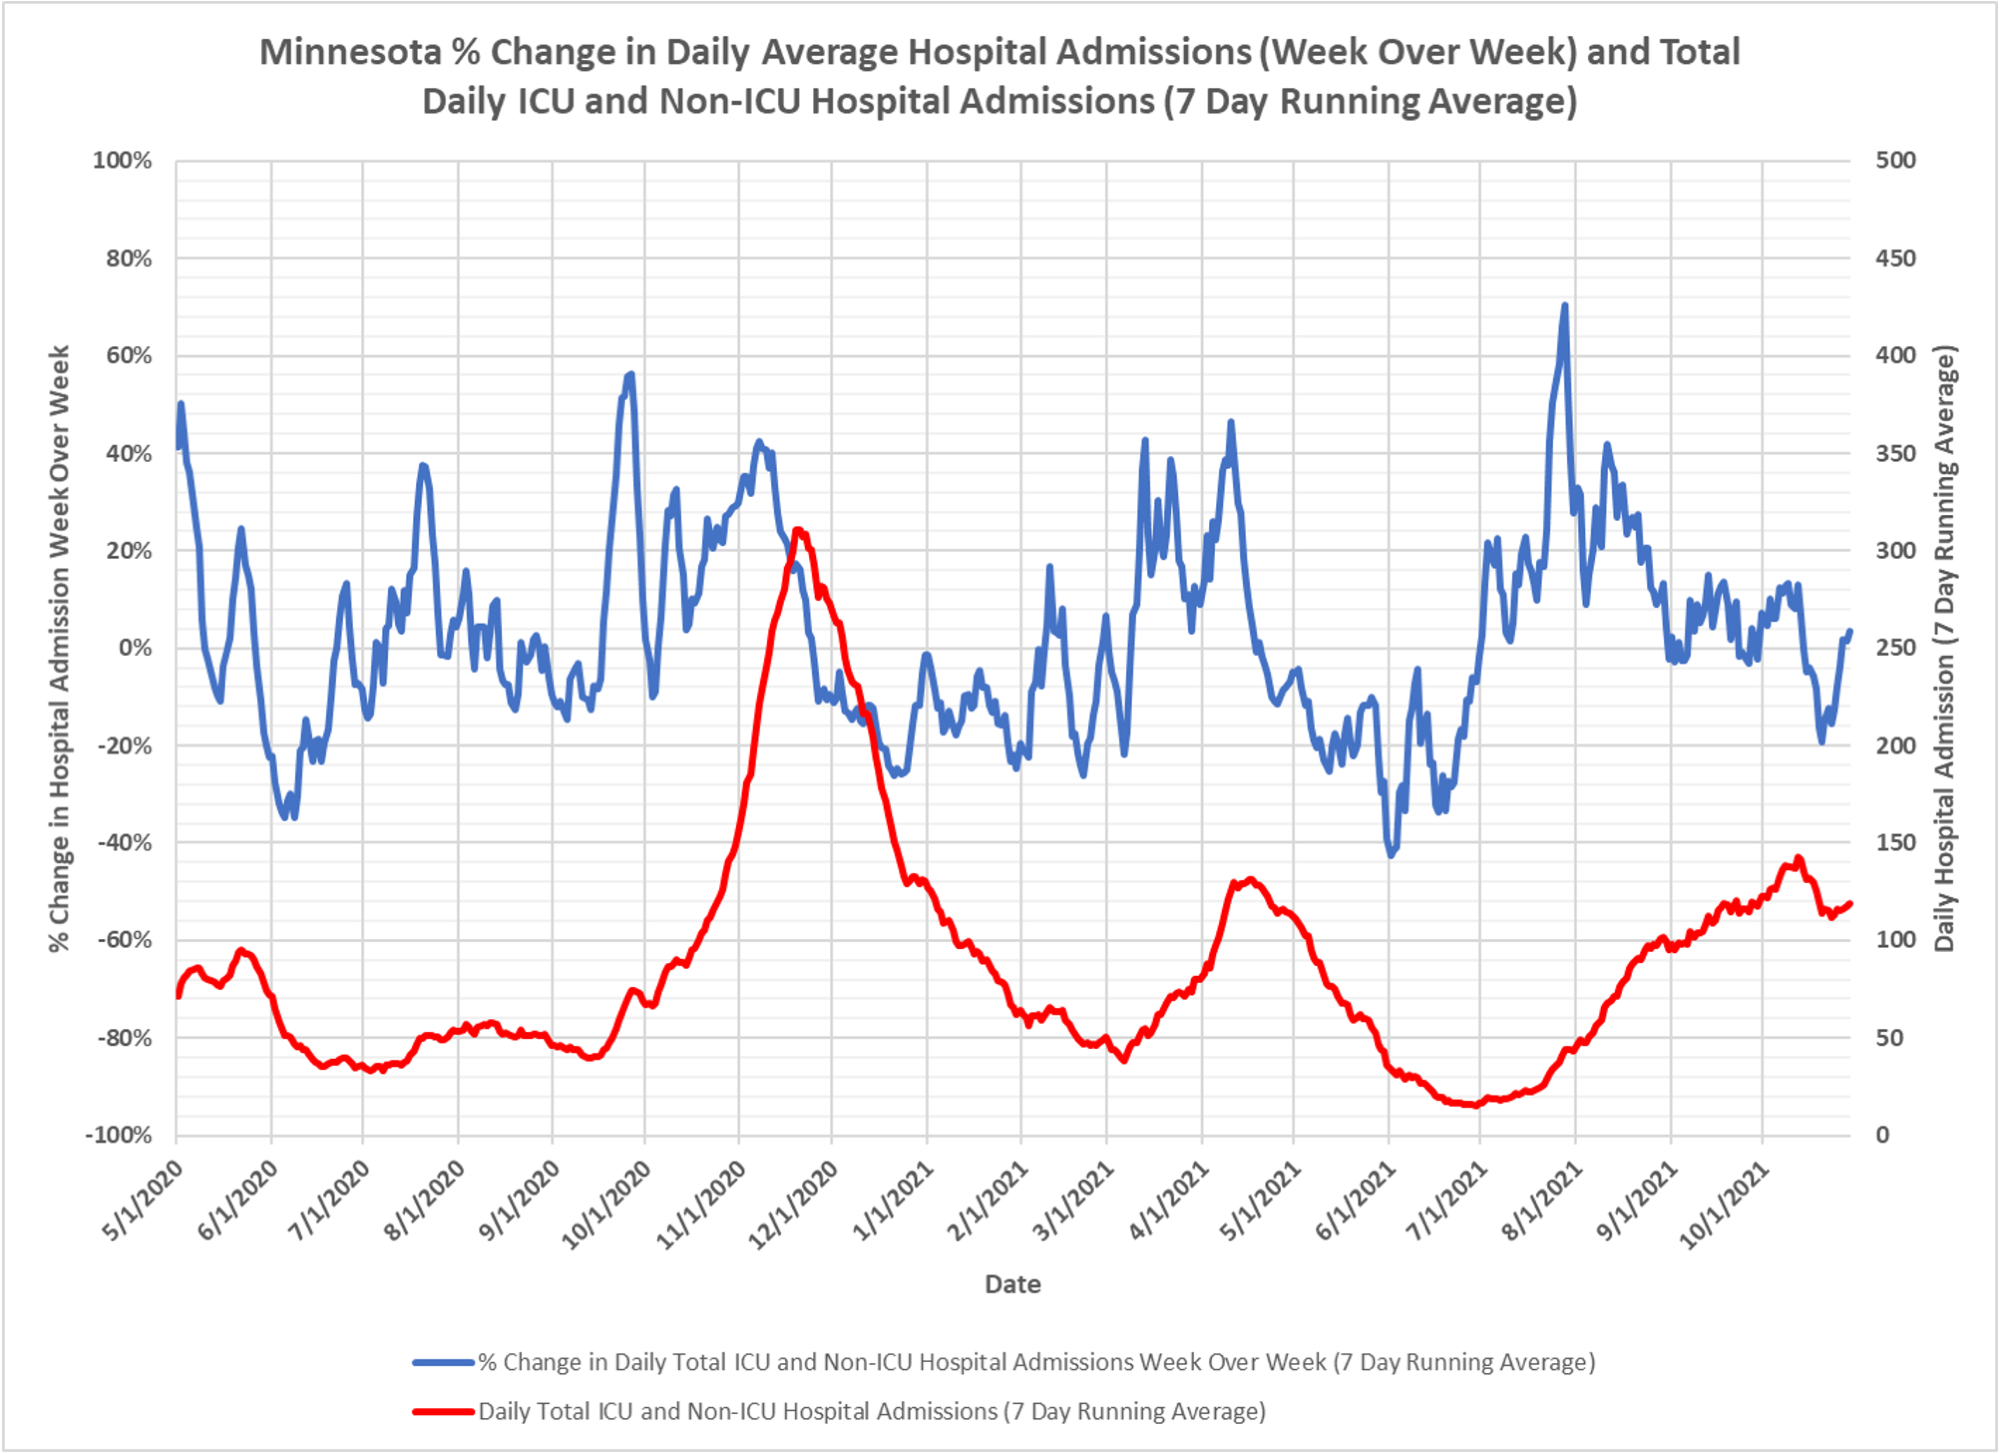
Another leading indicator which also shows a recent rebound in cases and hospitalizations. The data is through October 29 because it is date of event and is lagged to allow for completion. Another possible explanation for this weird rebound is that the teachers’ union has its annual meeting in the third week of October. So there could have been a lot less testing, but then people came back from travel, etc. and did a bunch of testing to return to school or work or whatever. Maybe that it is but something weird clearly going on. Thanks to Dave Dixon.