Here again we see something weird. As Dave Dixon says in his notes, the data doesn’t reconcile and there is some data problem that will take DOH eons to figure out. The two things I keep pointing out continue to be true. Notwithstanding school being in, for most children, there is no uptick in hospitalizations for those ages. And the benefits of vaccine against serious disease continue to wear off greatly for the elderly, look at hospitalization and death trends in recent weeks in those groups.
Dave’s notes:
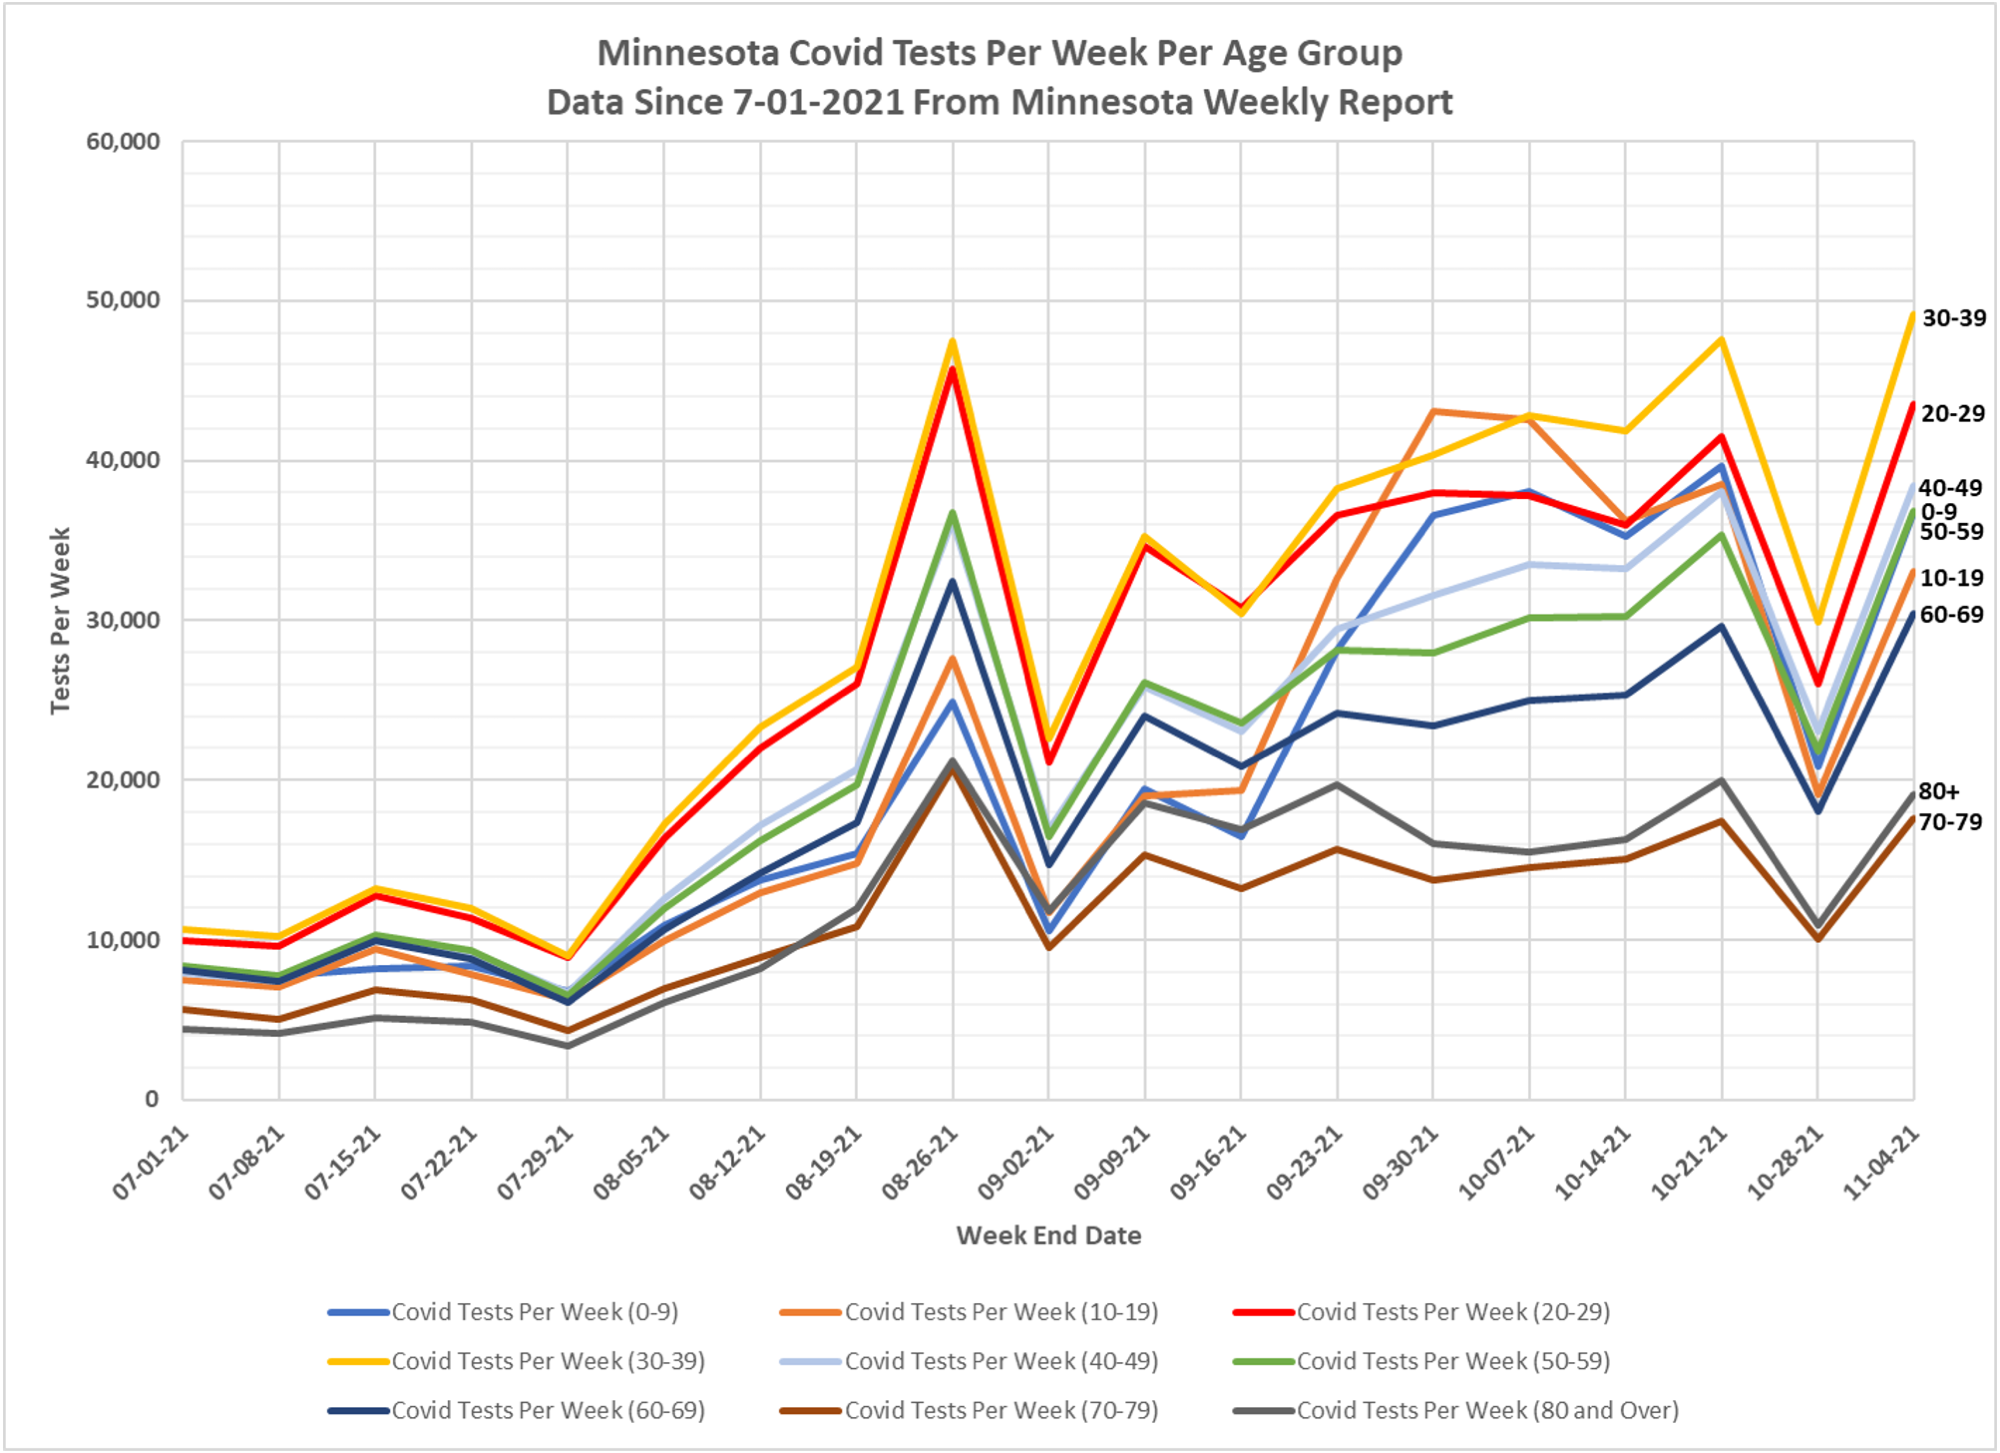
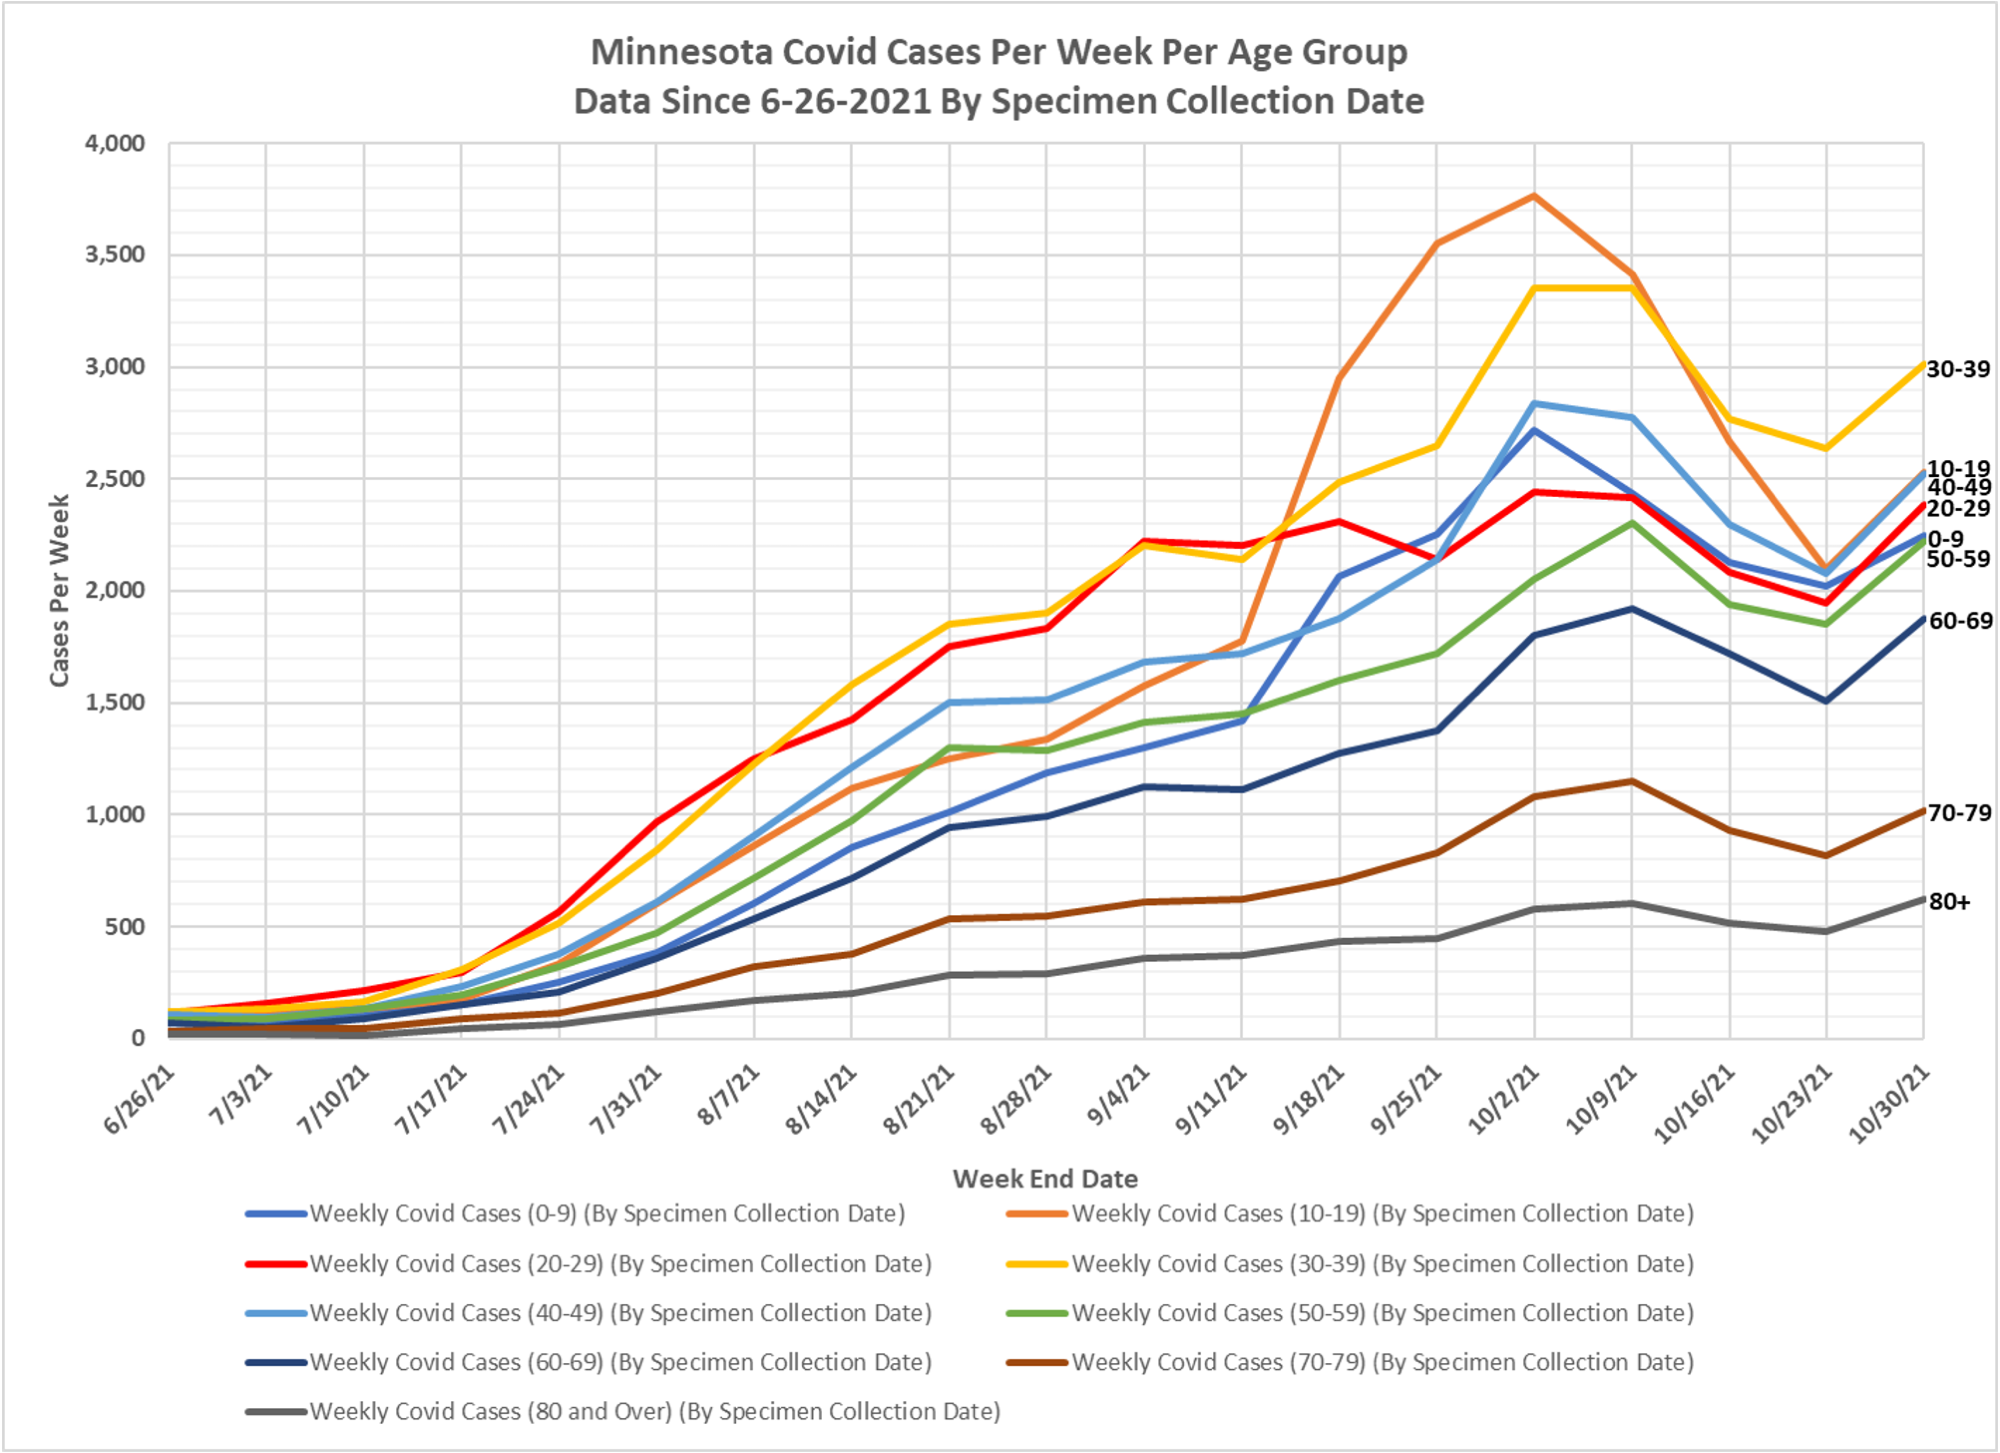
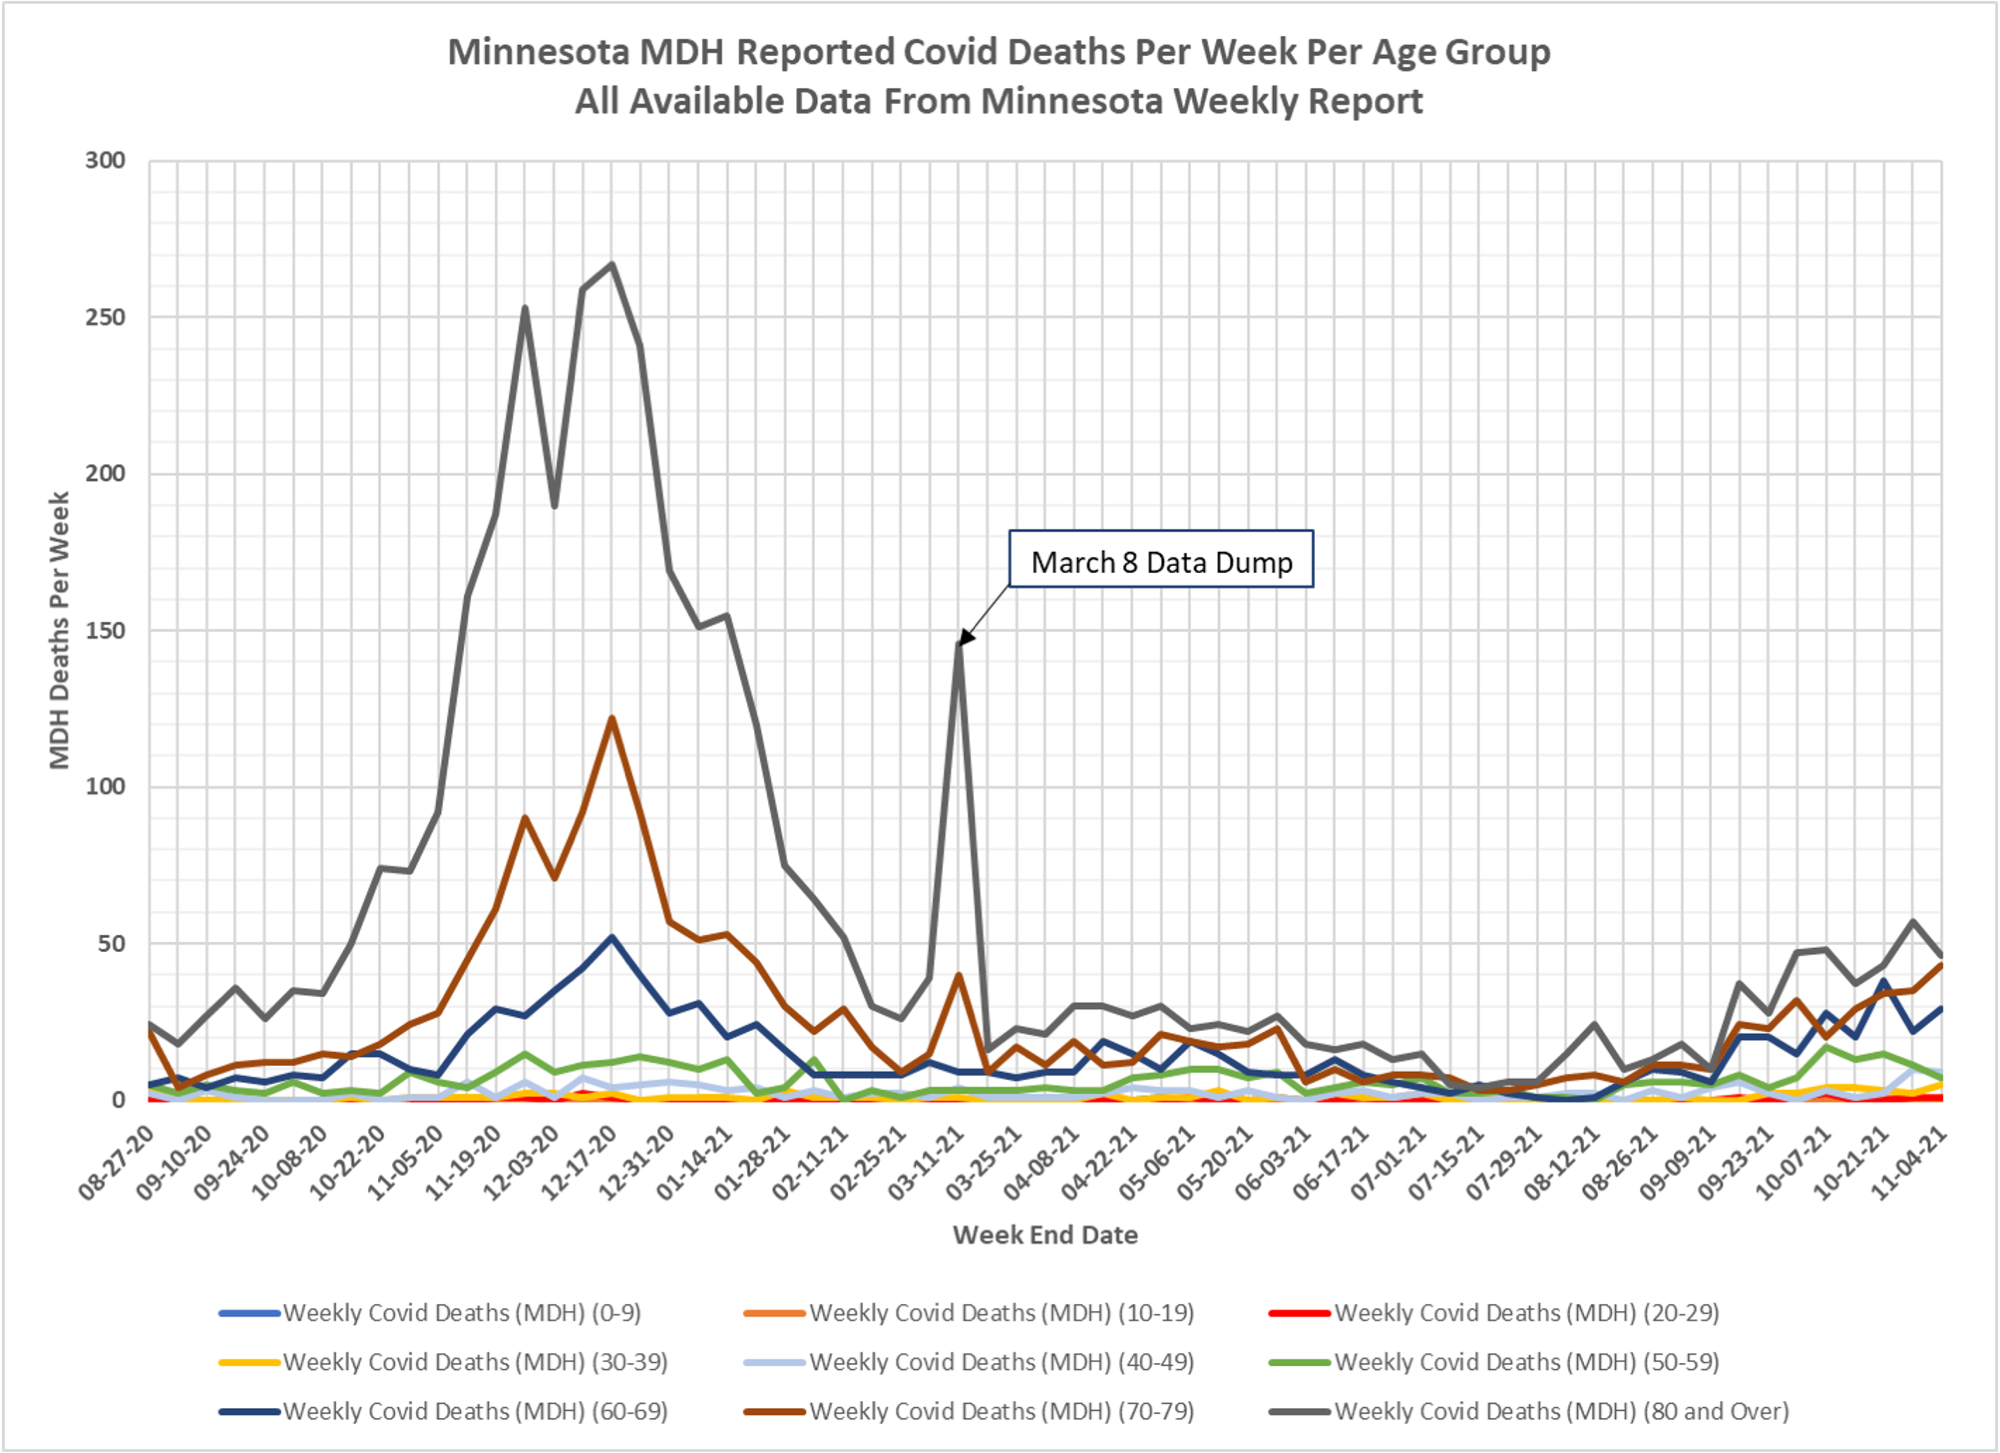
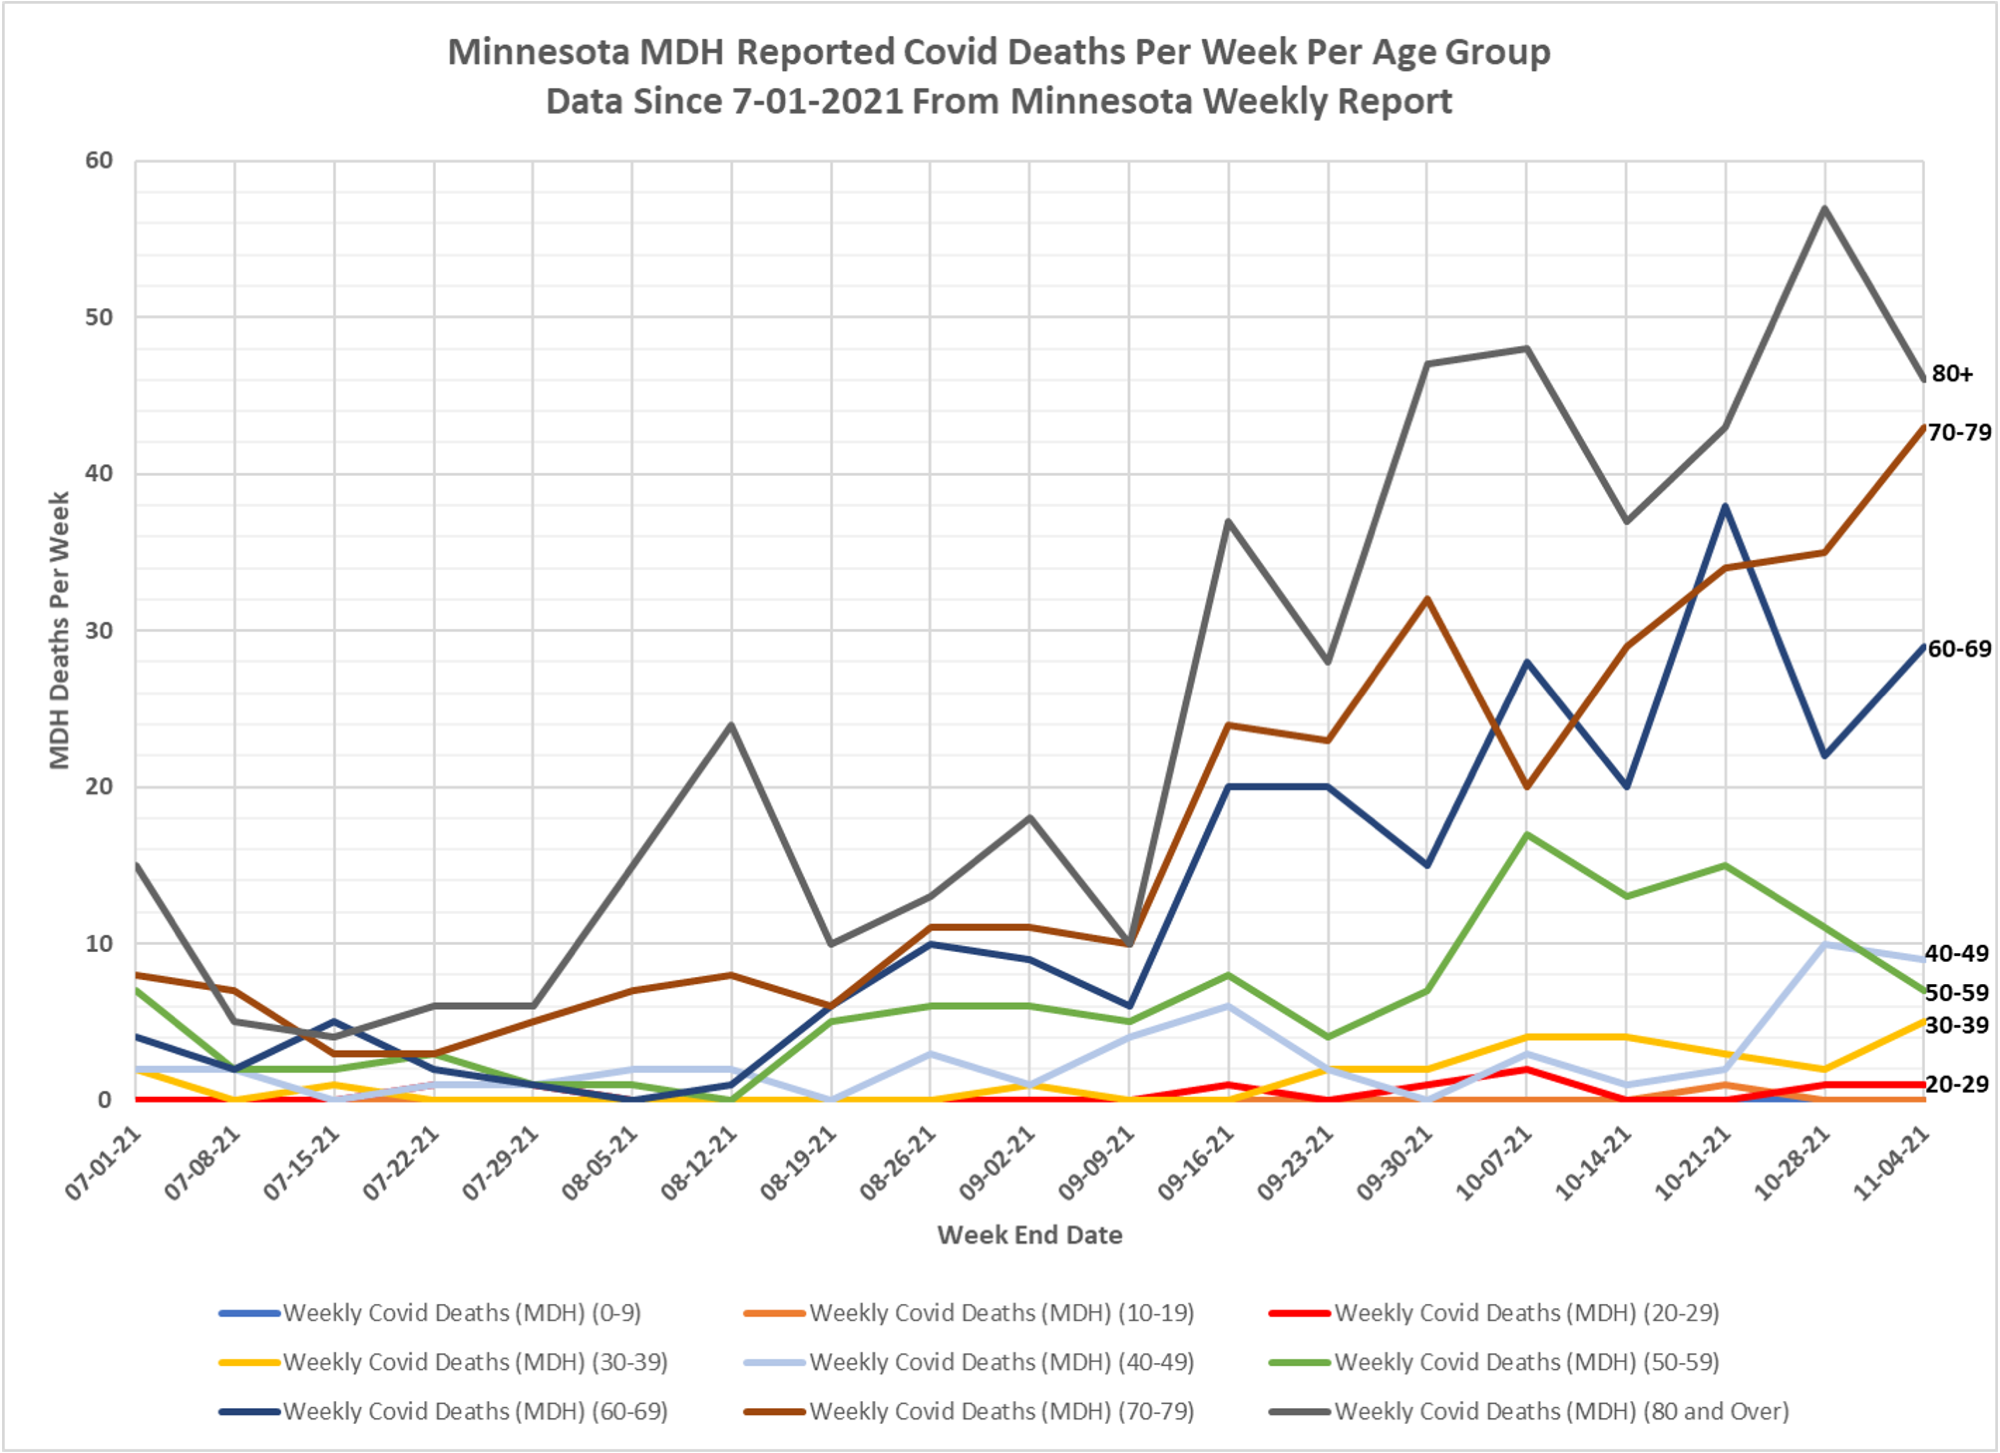
1. As always, there are 2 slides for each set of data, one showing the whole pandemic and a second chart showing only data since early July.
2. The data for the charts on testing, hospital admissions, and deaths comes from the Minnesota Weekly Report (available here: https://www.health.state.mn.us/diseases/coronavirus/stats/index.html). The data in the Weekly Report is presented as cumulative totals for each data type each week. I am taking weekly differences and assembling the data into charts. This data is by date of report, meaning the charts are documenting new events reported this week, even though the underlying event occurred some time in the past. The data is provided for 5 year age groups, and I am assembling into 10 year age groups to make the charts more readable.
3. The data for the Covid cases per week come from a data file published along with the Minnesota Weekly Report, here: https://www.health.state.mn.us/diseases/coronavirus/stats/index.html#wagscd1 This data is published by date of specimen collection, rather than by date of report as the other data is. The data is provided as cases per week in 5 year age groups. I am compiling the data into 10 year age groups in order for the charts to be more readable.
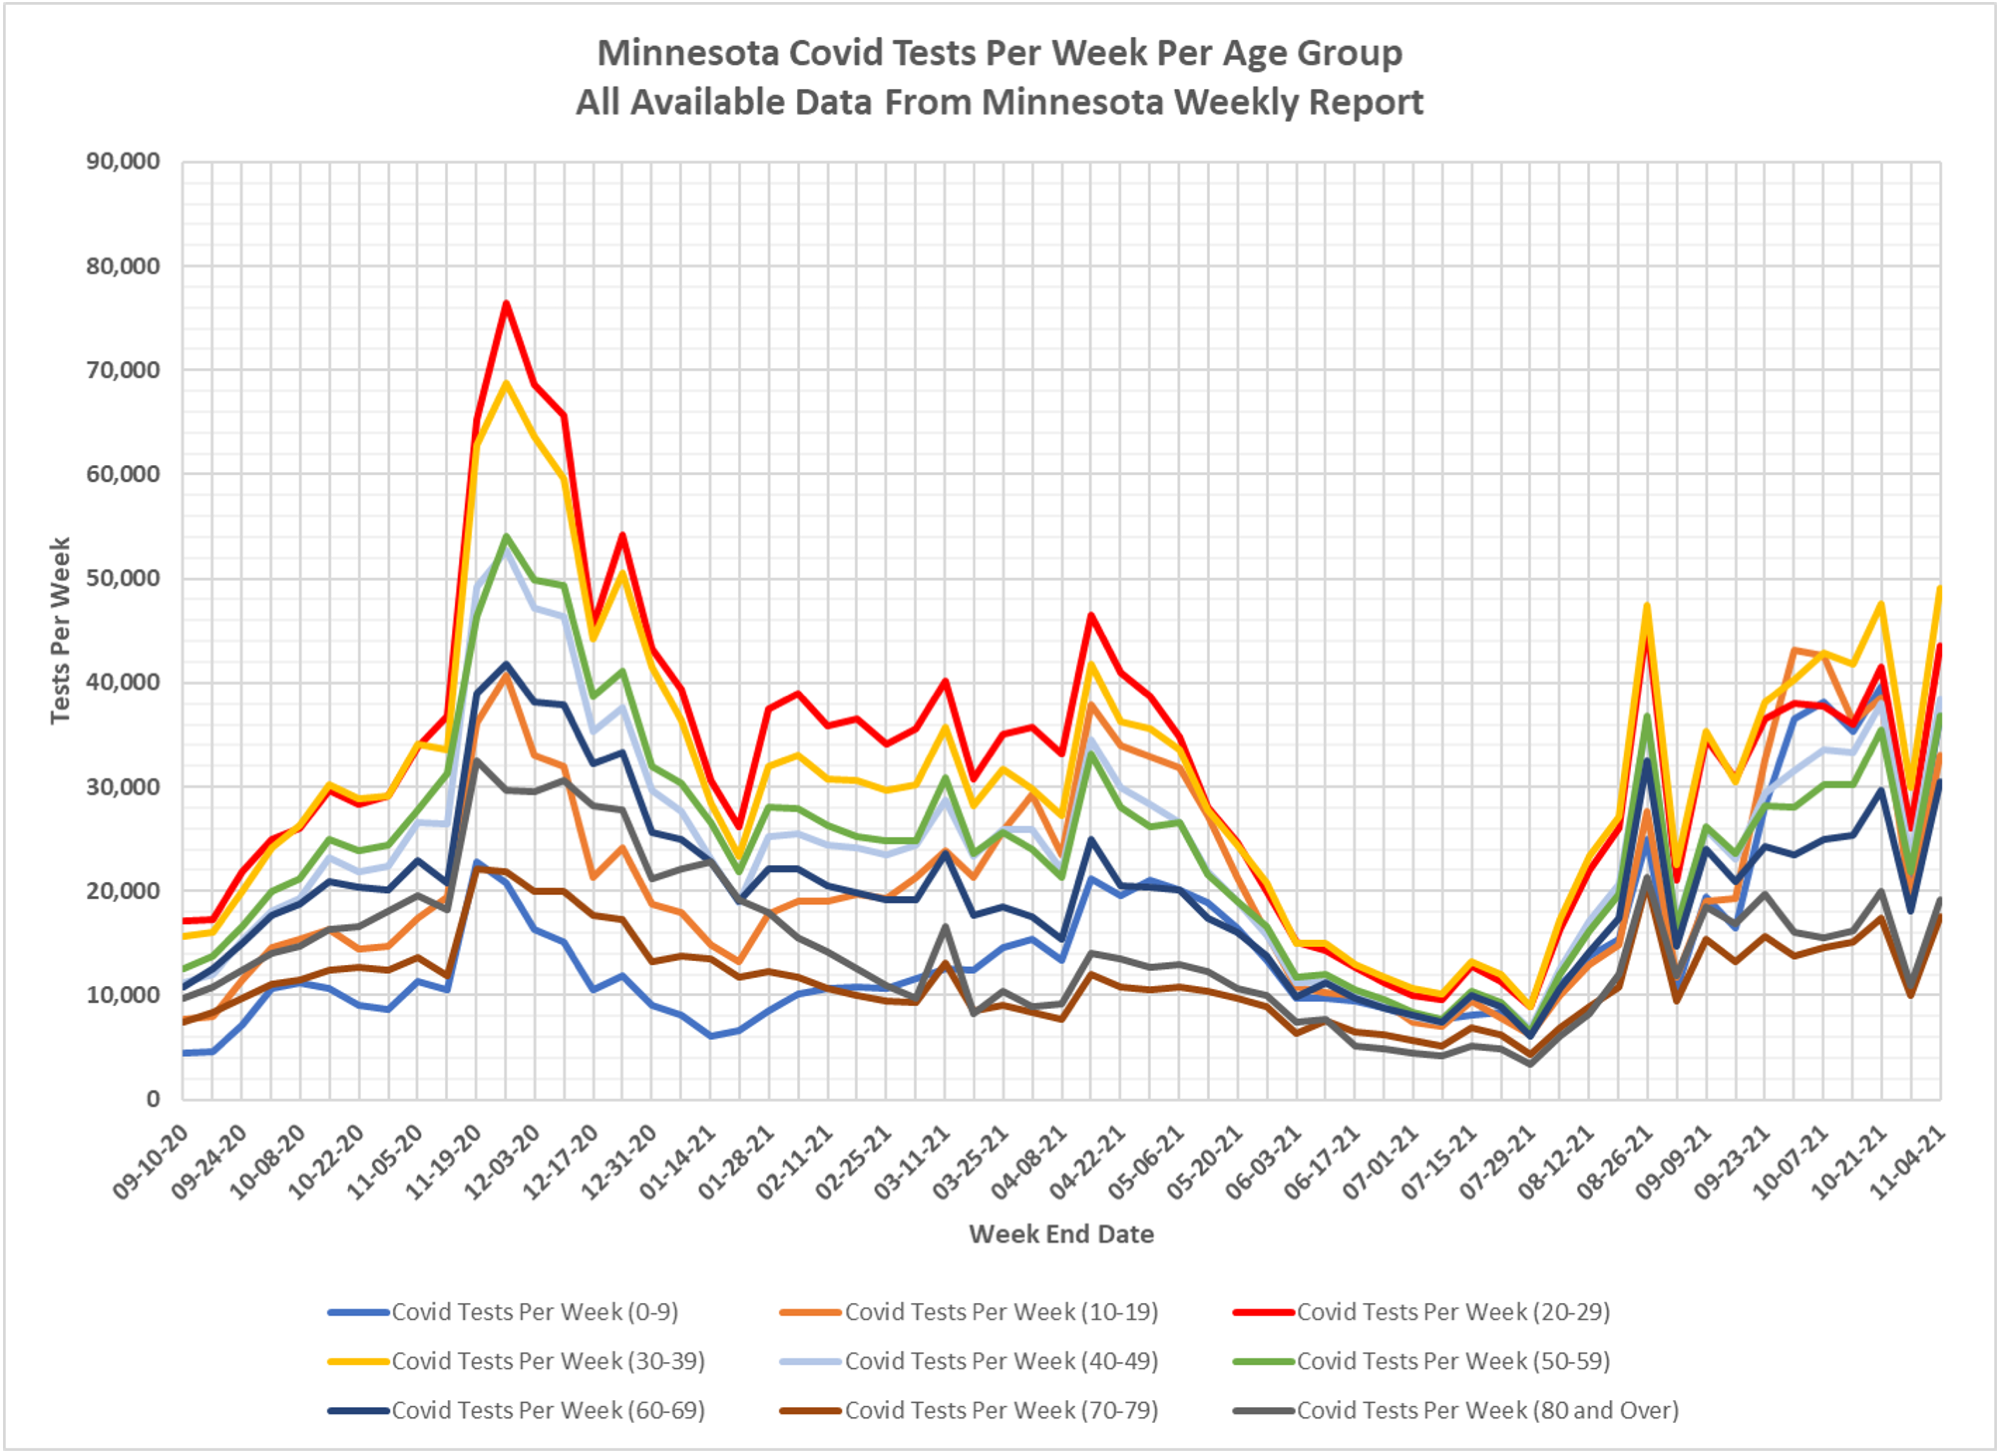
4. Slides 1 and 2: Covid Tests Per Week
We can see that the dramatic drop in testing the week ending 10-28 has completely reversed. This pattern is very reminiscent of the spike in testing seen the week ending 8/26. I believe that these spikes and drops in testing are an artifact of a data reporting problem, and not real changes in physical testing.
The Minnesota Situation Update page (https://www.health.state.mn.us/diseases/coronavirus/situation.html) reports testing by date of test (although without the age breakdowns). The week ending 10-28 they report a total of 251,846 tests, and the week ending 11-04 a total of 249,419 tests, so no material change in testing despite what the age structure data shows.
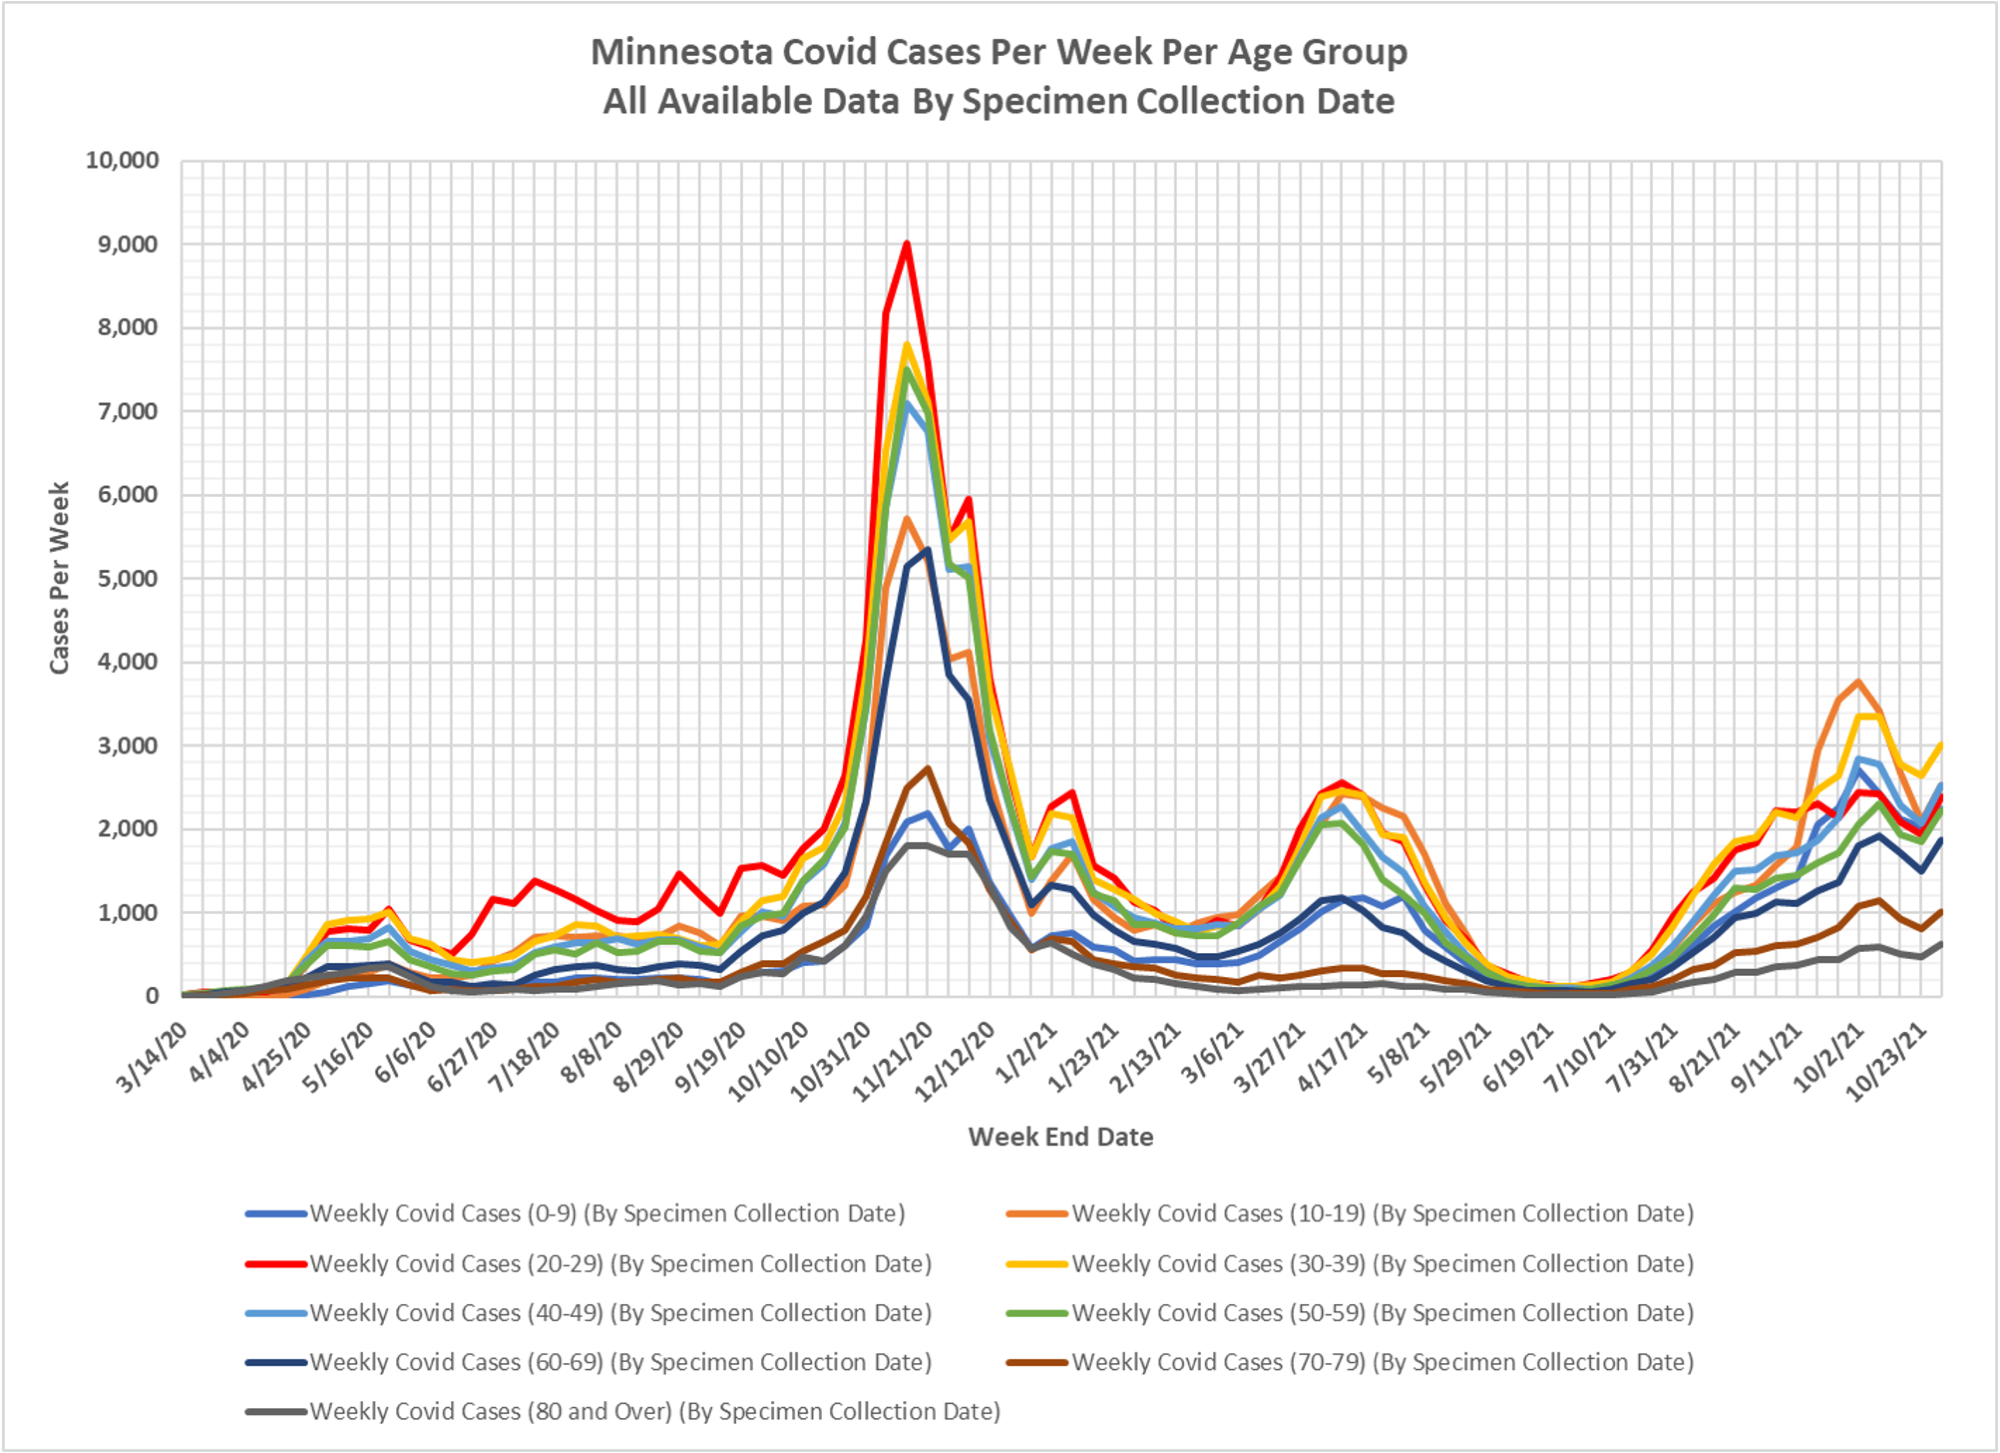
5. Slides 3 and 4: Covid Cases Per Week:
The Covid cases per week data comes from a different data file than that published in the Minnesota Weekly Report, so hopefully more reliable than the testing data. Positive Covid cases rebounded higher this week in all age groups, compared to the lows seen last week.
Total cases for the week were reported as 18,441, an increase of 19.5% over last week’s total.
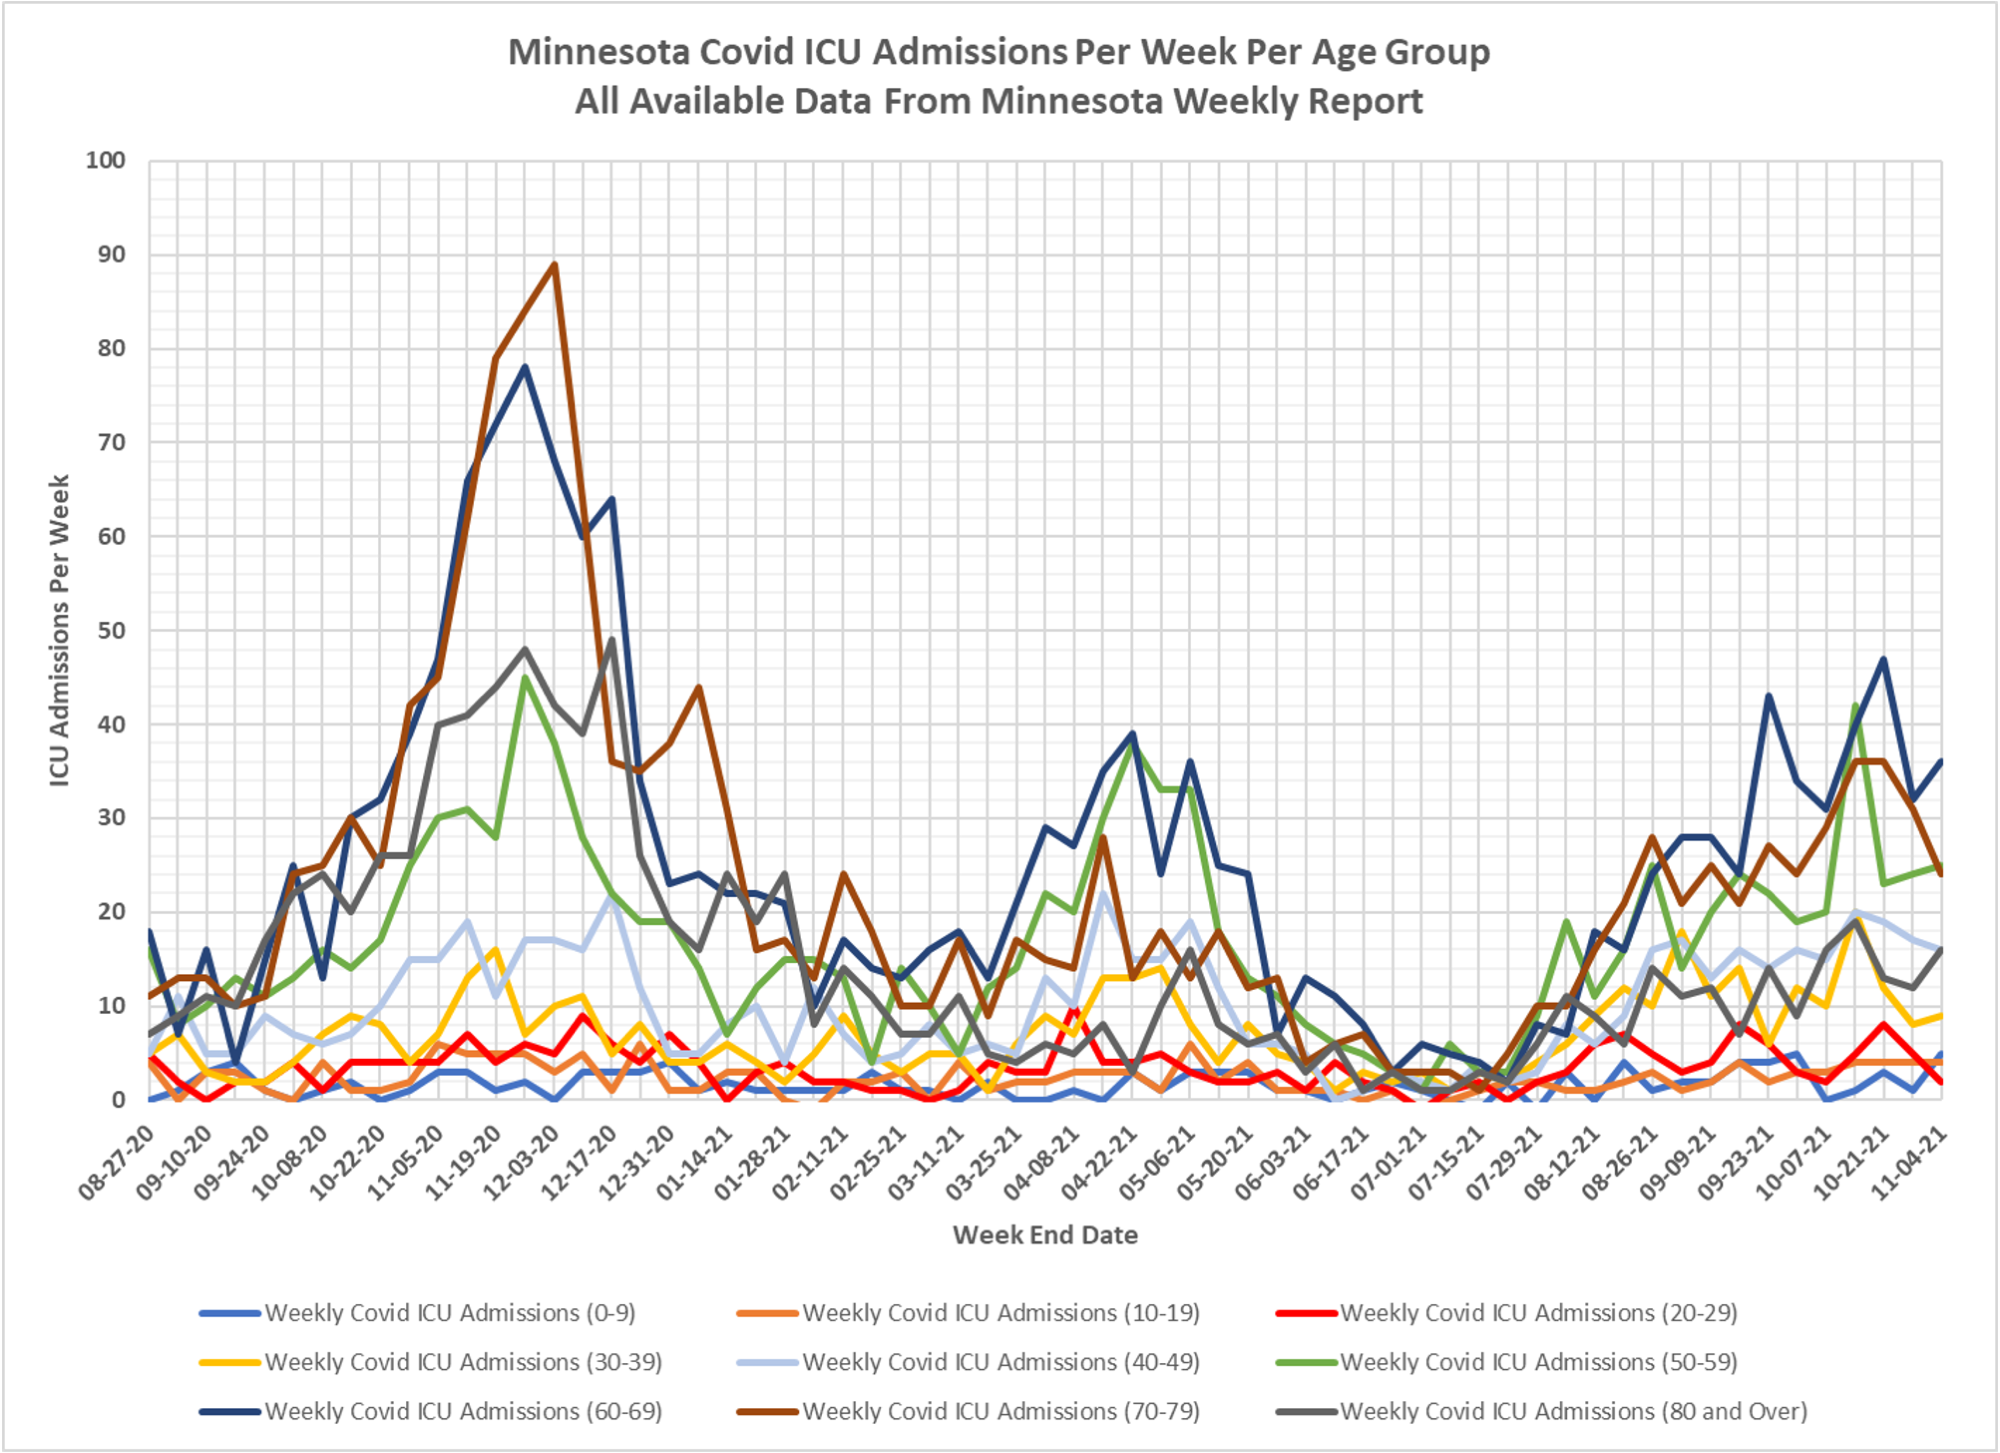
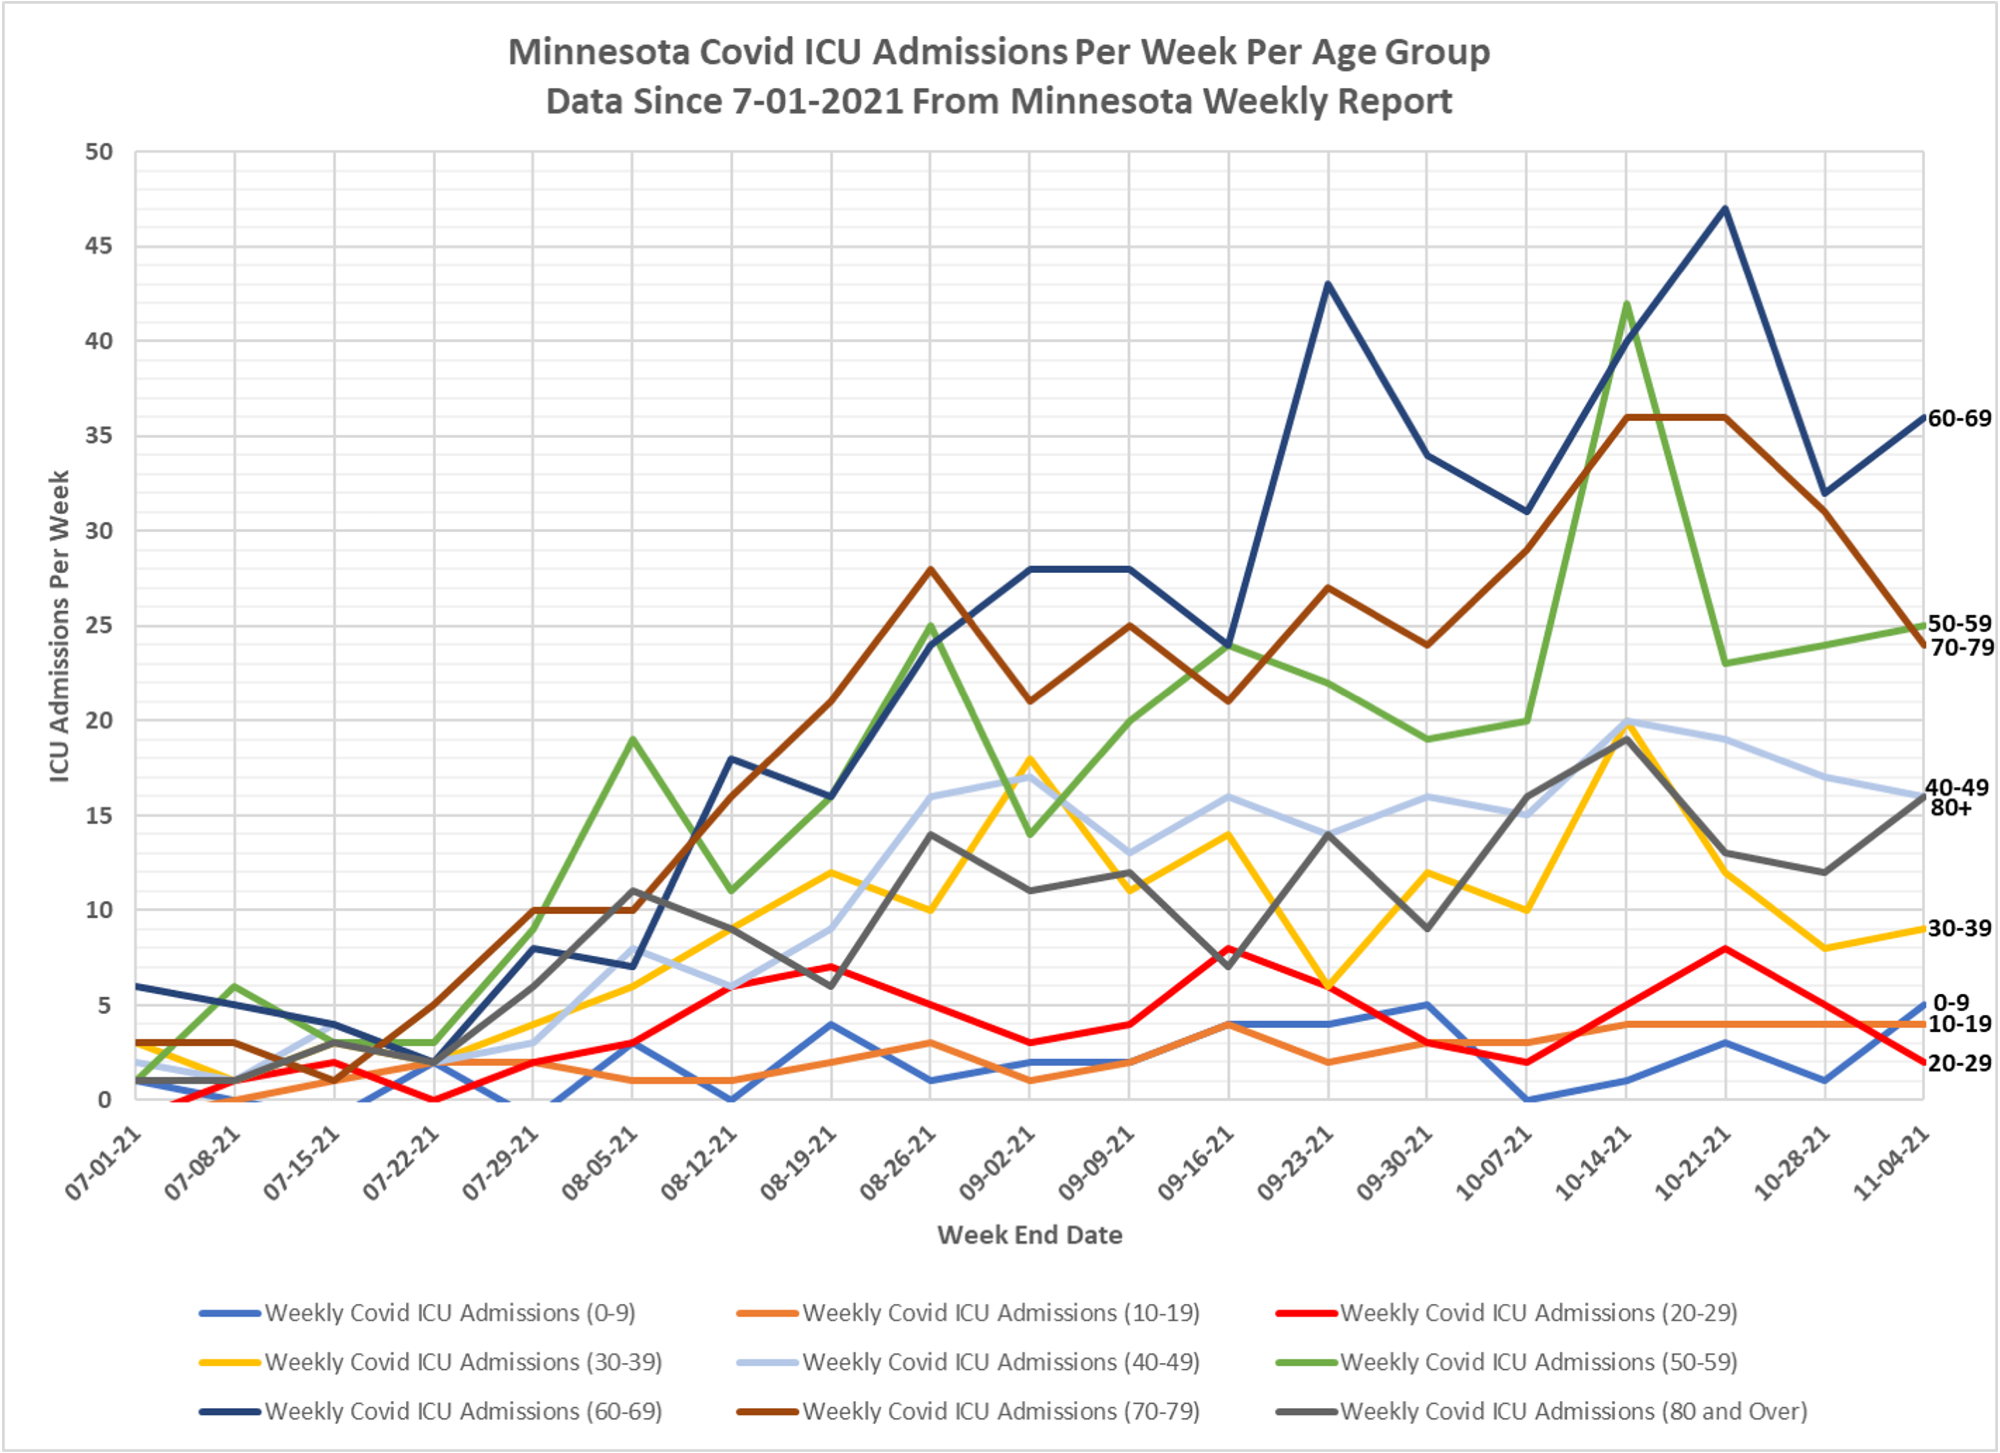
6. Slides 5 and 6: ICU Admissions Per Week;
These were five reported Covid ICU admissions in the 0-9 age group in this Weekly Report, and four in the 10-19 age group. There still appears to be very minor impact of Covid infections on ICU admissions for school age children.
No real trend as a whole.
Total ICU admissions for the week were 137, just 3 more than the prior week.
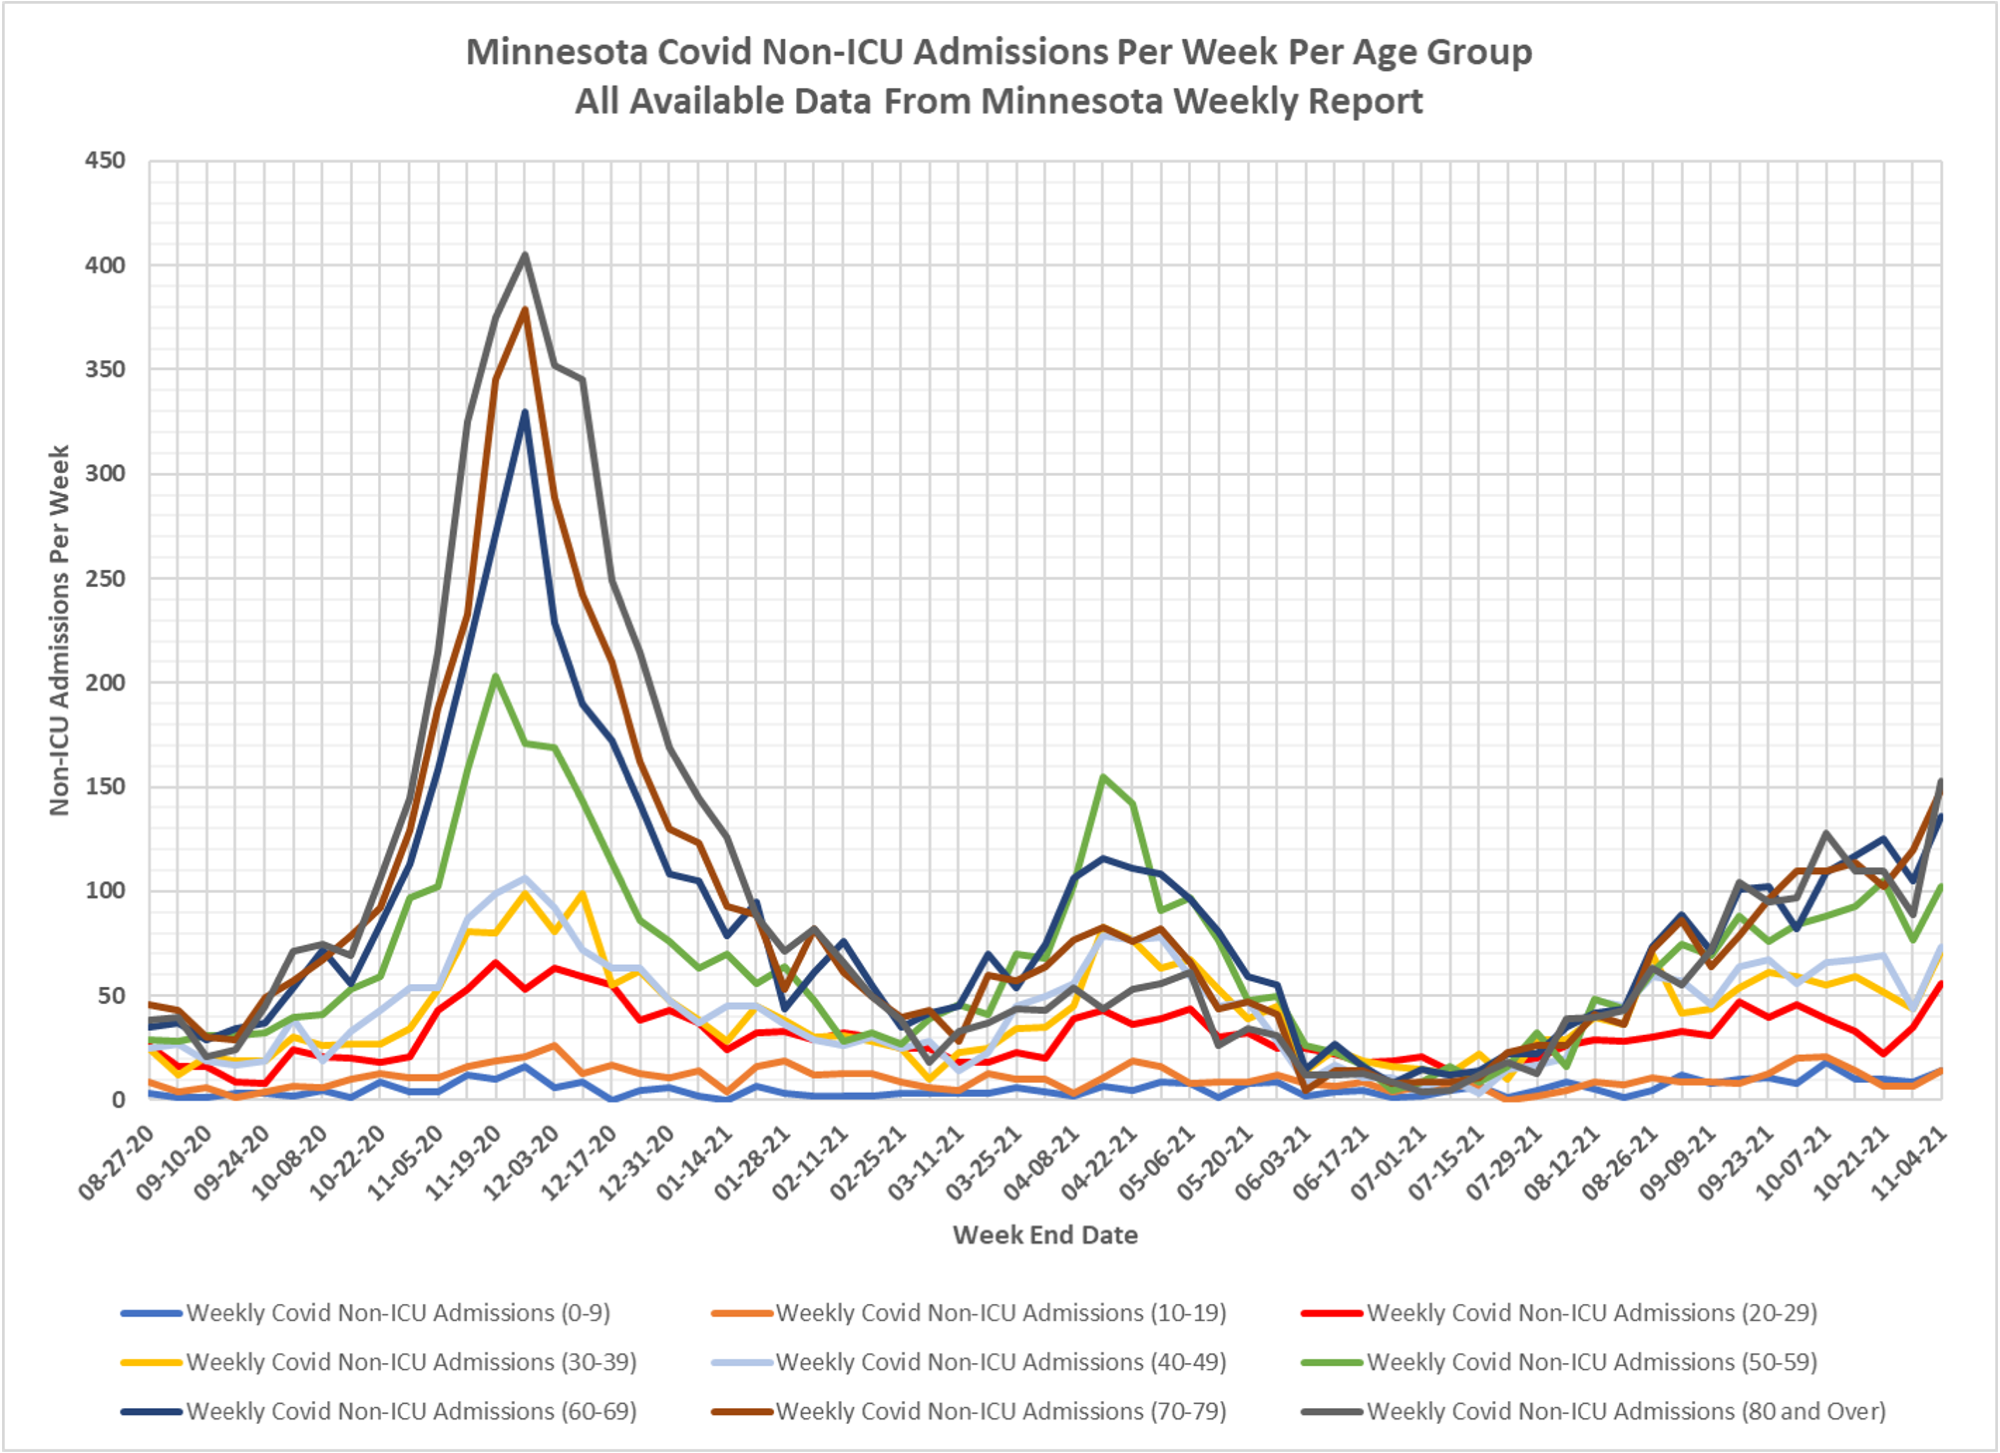
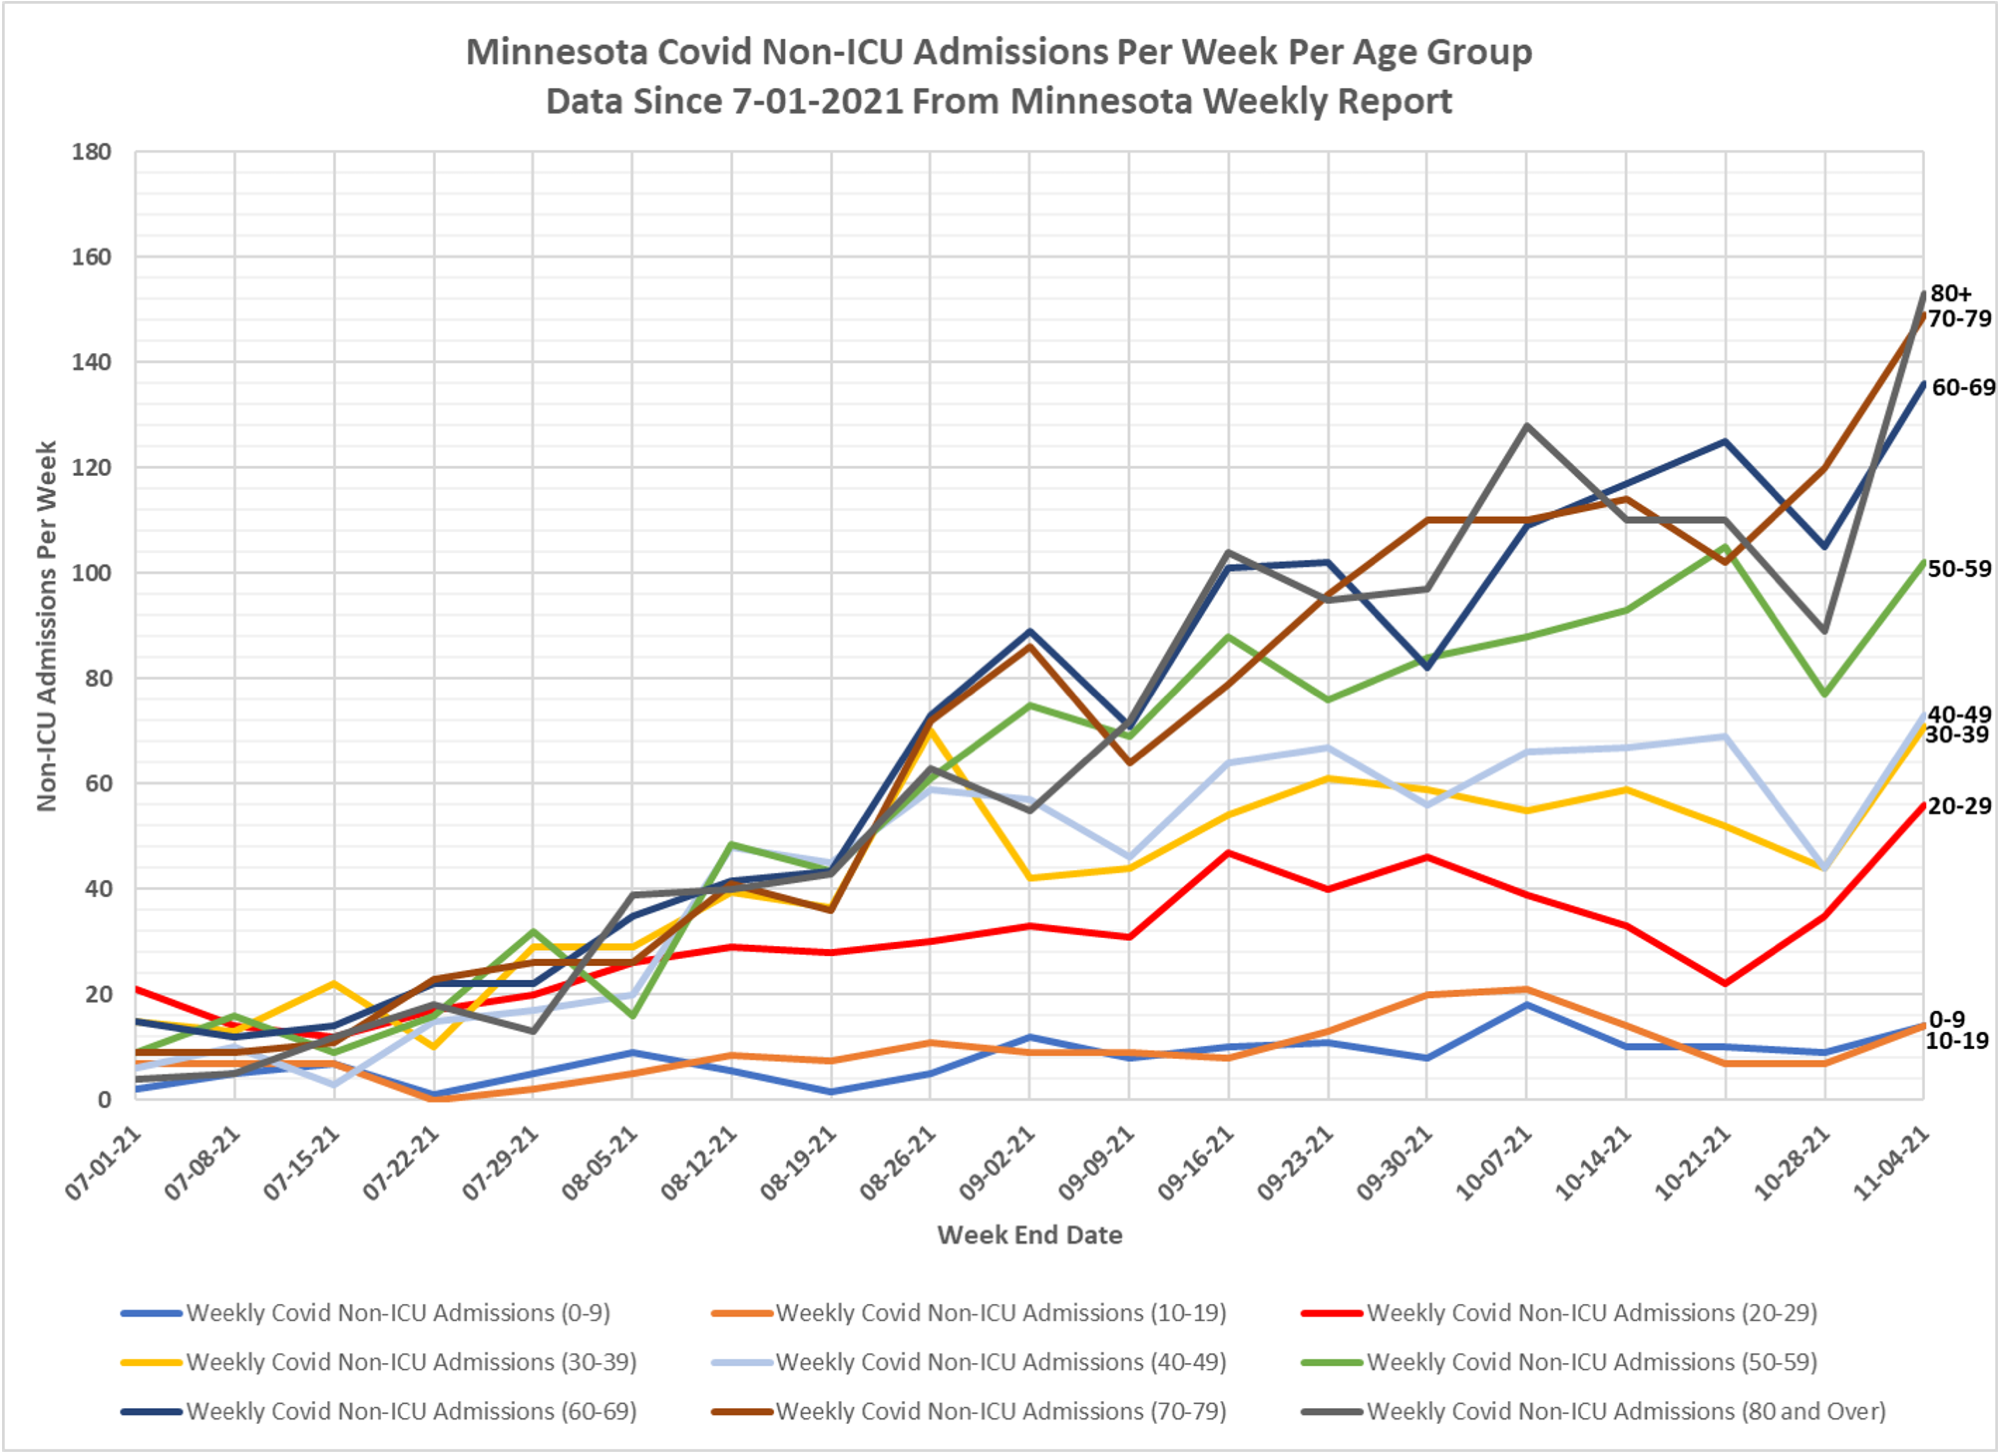
7. Slides 7 and 8: Non-ICU Admissions Per Week:
Non-ICU admissions were higher this week for all age groups, compared to last week.
The 0-9 and 10-19 age groups each had 14 Non-ICU Covid admissions for the week.
Total Non-ICU Covid admissions for the week were 768, a 45% increase compared to last week.
We have not been provided any data about the number of people admitted for non-Covid reasons but then test positive upon admission. The only data I have seen is from a Jeremy Olson article in the Star-Tribune (https://www.startribune.com/covid-19-levels-remain-lower-in-minnesota-despite-u-s-uptick/600077976/) which said that in a small study 51% of Covid patients were actually admitted for Covid, and the rest were admitted for surgeries or other reasons. I think it is reasonable to assume that half the Covid admissions continue to be for non-Covid reasons, until we are provided with better data.
8. Slides 9 and 10: Deaths Per Week:
Deaths per week were overall relatively unchanged for the week, with the 60 and older age groups experiencing the most Covid deaths.
Total reported deaths for the week were 140, only a slight increase over 138 deaths the week before.
If half of hospital admissions were for non-Covid reasons, it seems reasonable to me to assume that a sizeable percentage of Covid deaths are also for non-Covid reasons. The Minnesota Department of Health has steadfastly refused to discuss such topics as far as I am aware.

Kevin & David
How many / % of the covid deaths were vaxed ? in each age group
I would presume the age 60-69 , 70-79 and 80+ would be approx 75%+ vaxed or greater since those age groups would know they are the vunerable group
thanks for any insight
Joe
I think the elderly who are vaxed are experiencing a lot of deaths and hosps. The state won’t break this out, but the raw numbers mean it must be so.
Kevin thanks for the comment – I found a cite for the vax by age
65+ age group is approx 88% vaxed
https://usafacts.org/visualizations/covid-vaccine-tracker-states/state/minnesota
Isn’t a well functioning immune system a pre-requisite for a vaccine to work? Why do we think that a poor vaccine like this one is going to fix an aged or abused system? Immune systems are developed and /or ruined over time, some genetics yes, but mostly life style, prior pathogen exposures and diet. We are really only recording the % of the population with poor immune systems since corona viruses are not really deadly. There is no evidence of annual deaths being out of whack over a decade’s worth of data.
https://thefatemperor.com/time-to-think-the-basic-data-says-it-all-simplified-and-clear/
And let’s not forget the ‘With vs. From’ factor. Even of you are very generous at 50%, it still changes the numbers and perception of the risks considerably.