Dave Dixon’s regular updates, with Dave’s notes below. Just want to say again, anyone can create these charts with the publicly available data, we are just taking that data and charting it. Nothing fancy, nothing questionable. And here are the most important takeaways:
Notwithstanding the DOH lies at the briefing this week, you can see there is no hospitalization surge among children.
Notwithstanding the Governor’s lies at the beggining of October, our large number of deaths in Minnesota this month is due to a rapid increase in the extremely heavily vaccinated very oldest groups.
Dave’s notes:
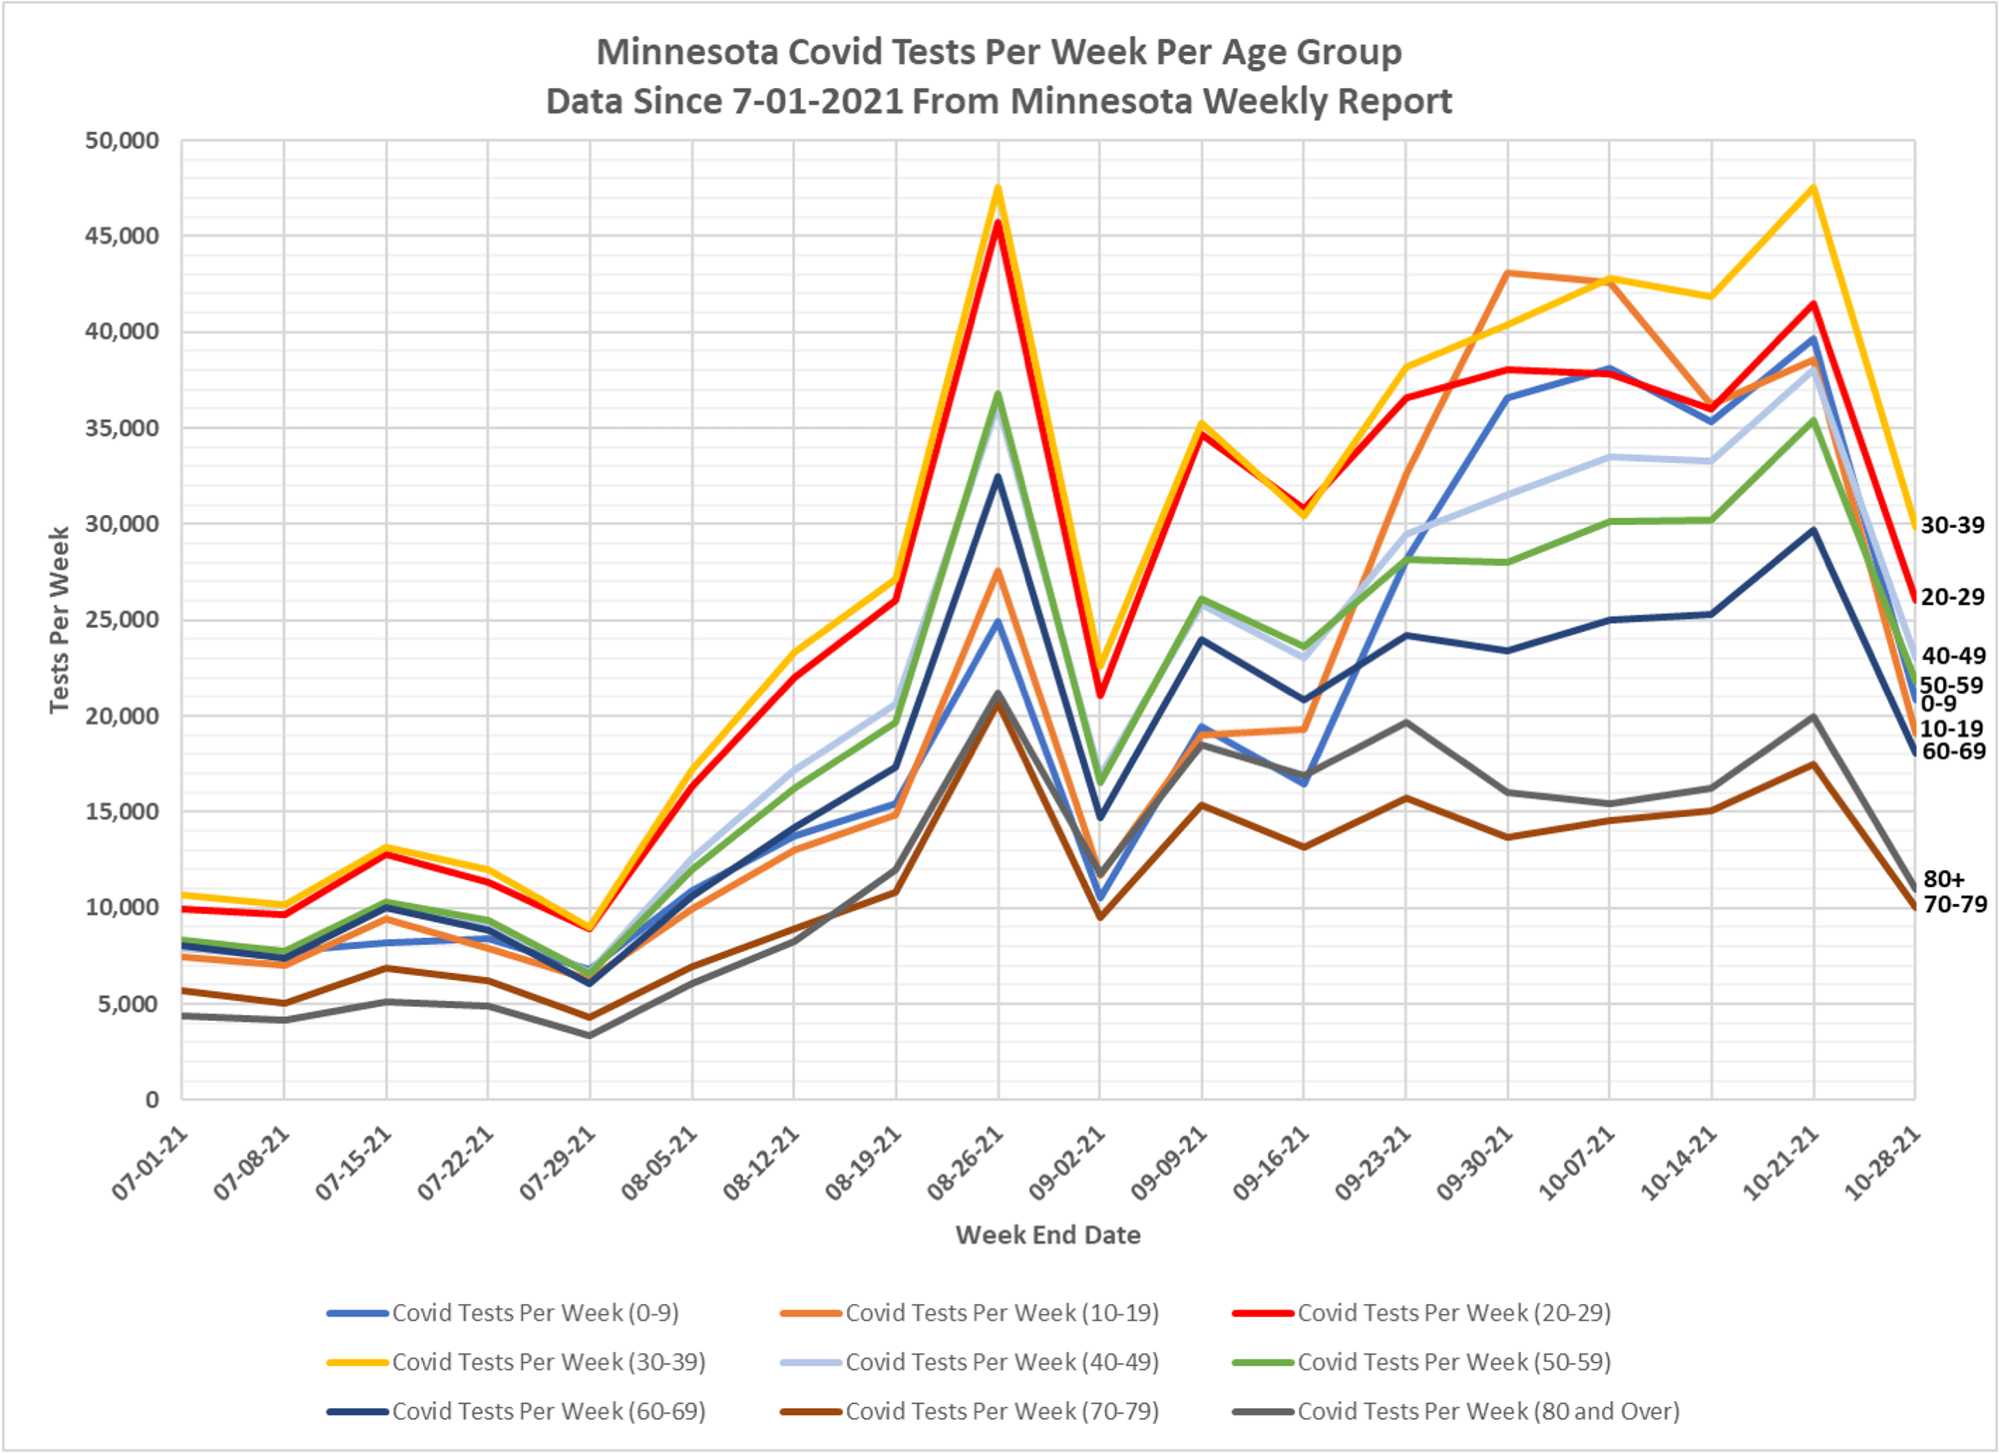
As always, there are 2 slides for each set of data, one showing the whole pandemic and a second chart showing only data since early July.
The data for the charts on testing, hospital admissions, and deaths comes from the Minnesota Weekly Report (available here: https://www.health.state.mn.us/diseases/coronavirus/stats/index.html). This type is by date of report, meaning the charts are documenting new events reported this week, even though the underlying event occurred some time in the past.
The data for the Covid cases per week come from a data file published along with the Minnesota Weekly Report, here: https://www.health.state.mn.us/diseases/coronavirus/stats/index.html#wagscd1 This data is published by date of specimen collection, rather than by date of report as the other data is.
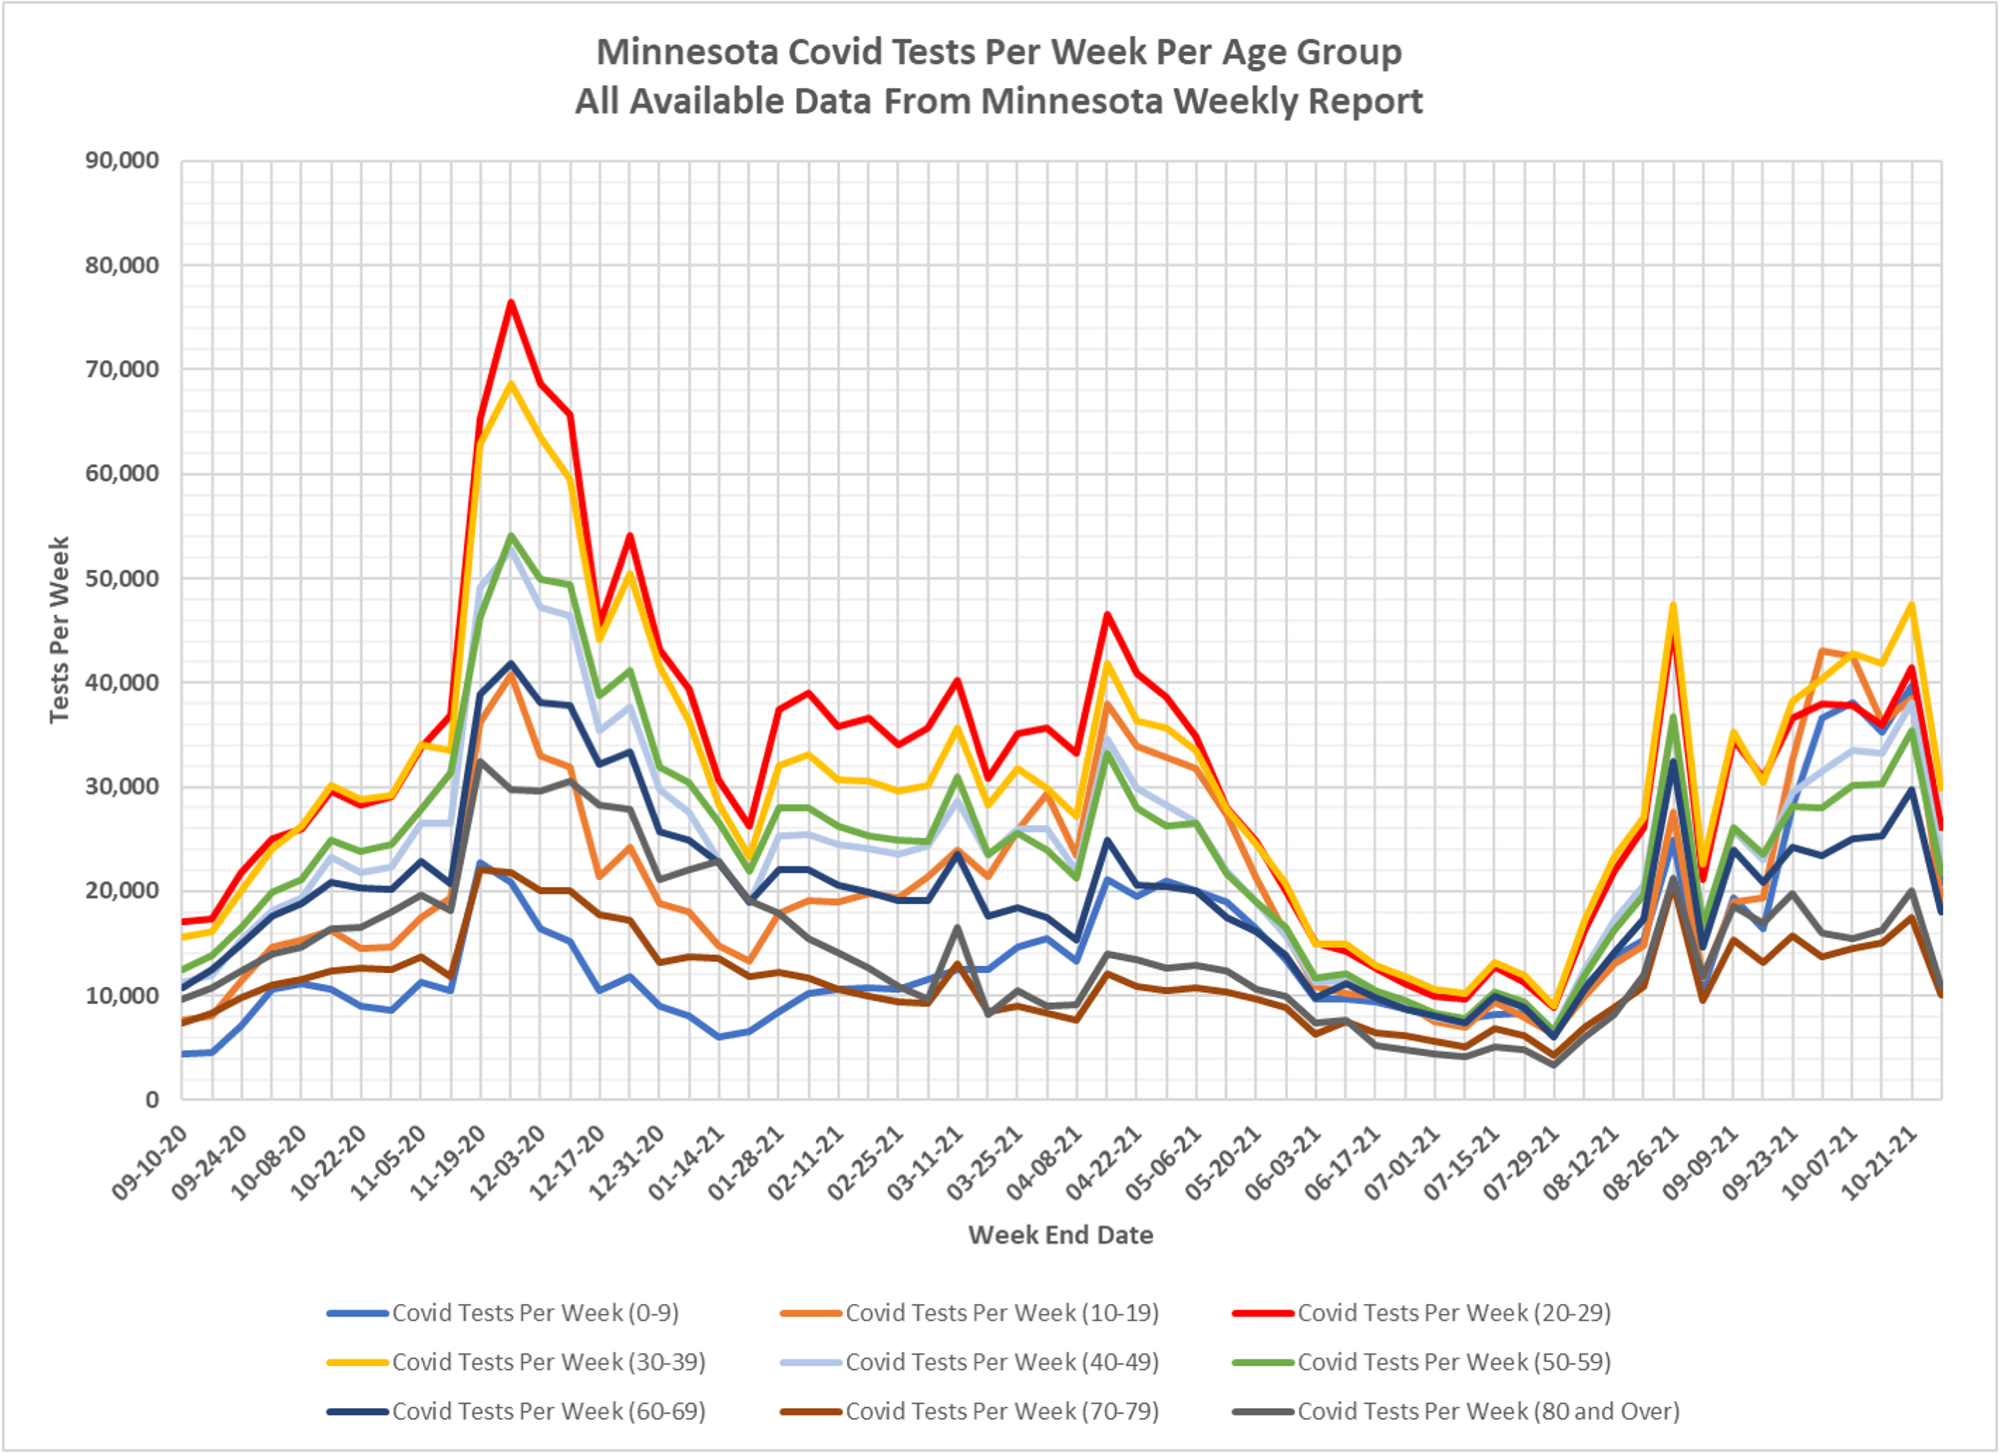
Slides 1 and 2: Covid Tests Per Week
Tests for all age groups are lower dramatically this week compared to last week.
Total tests for the week were 179,762, a reduction of a reduction of 41.5 % compared to the prior week.
The reduction in testing appears fairly consistent across all age groups.
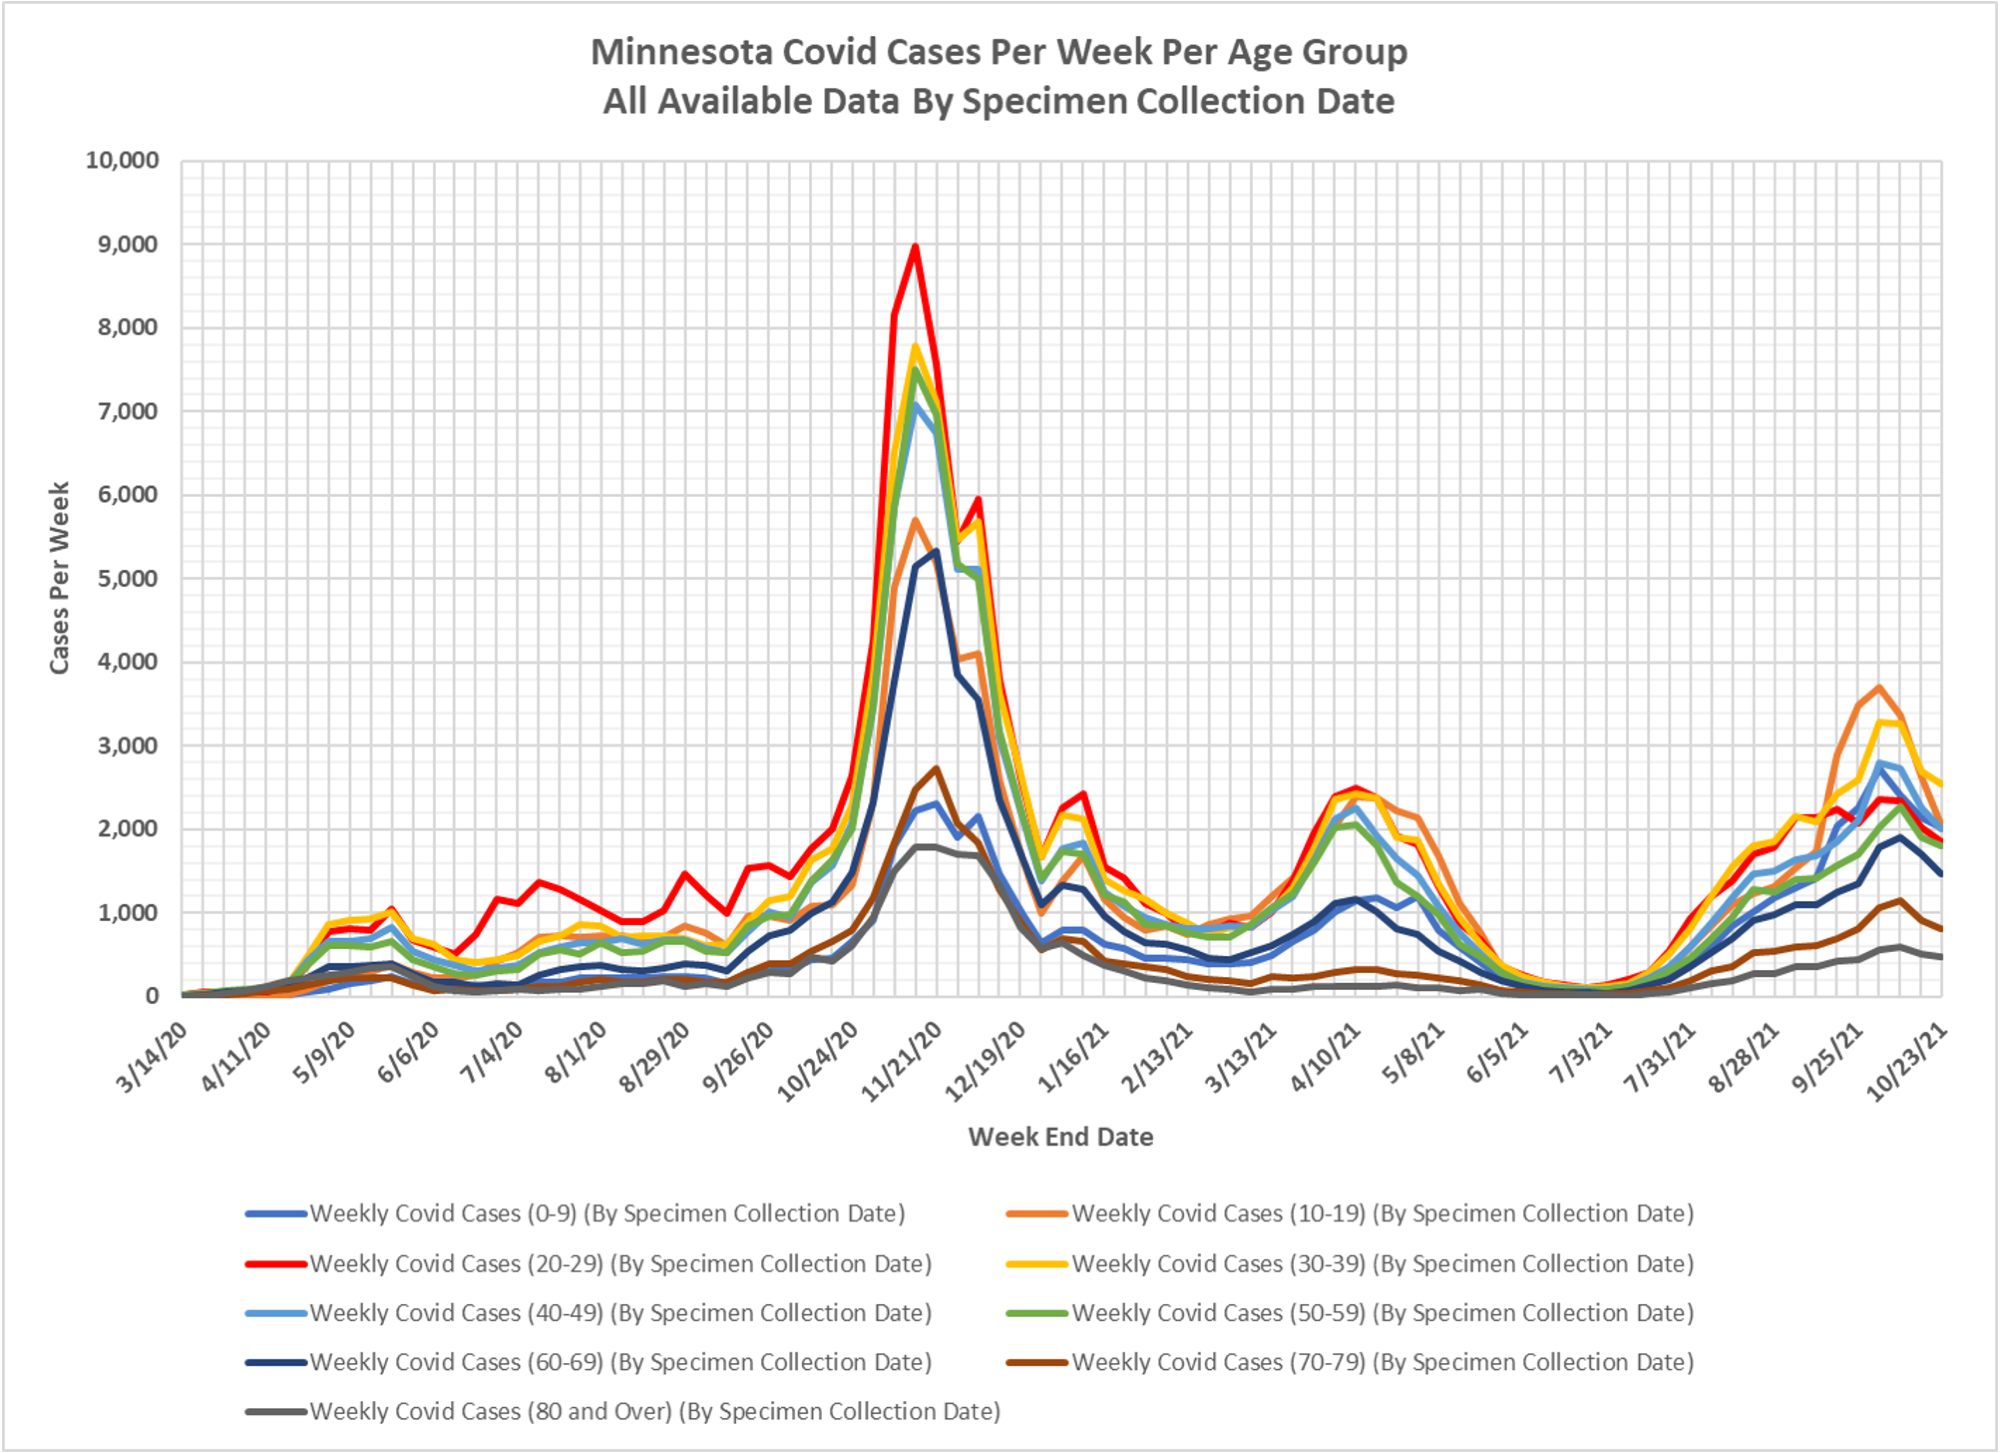
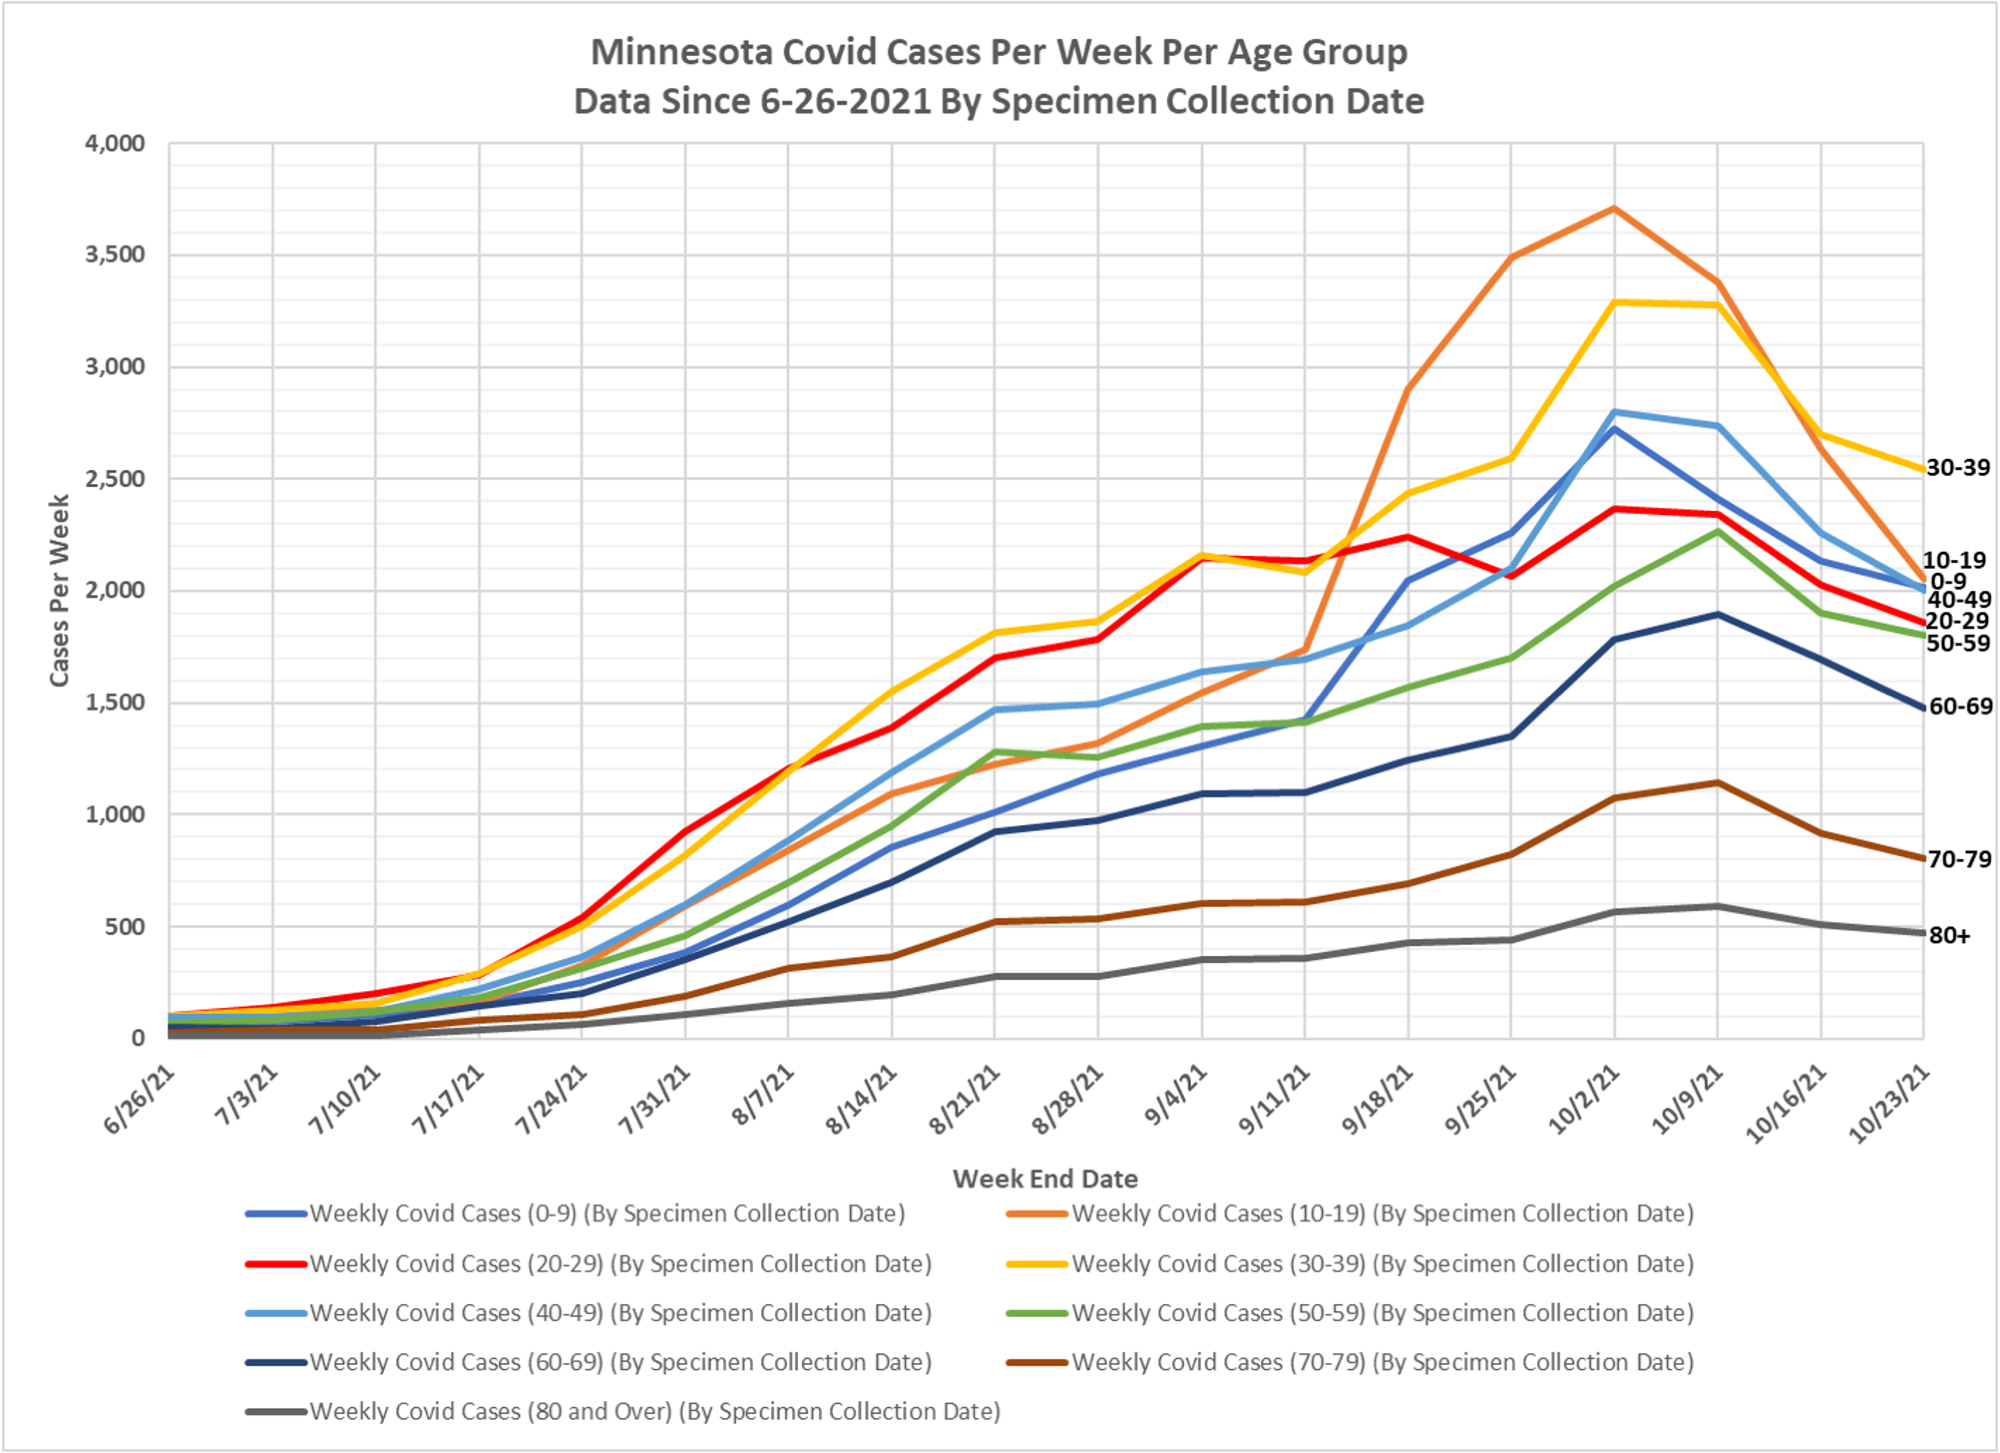
Slides 3 and 4: Covid Cases Per Week:
Positive Covid cases were lower this week in all age groups.
Visually the greatest decrease in weekly cases appears to be the 10-19 age group, following by the 0-9 age group.
Total cases for the week were reported as 14,989, a reduction of 10.6%.
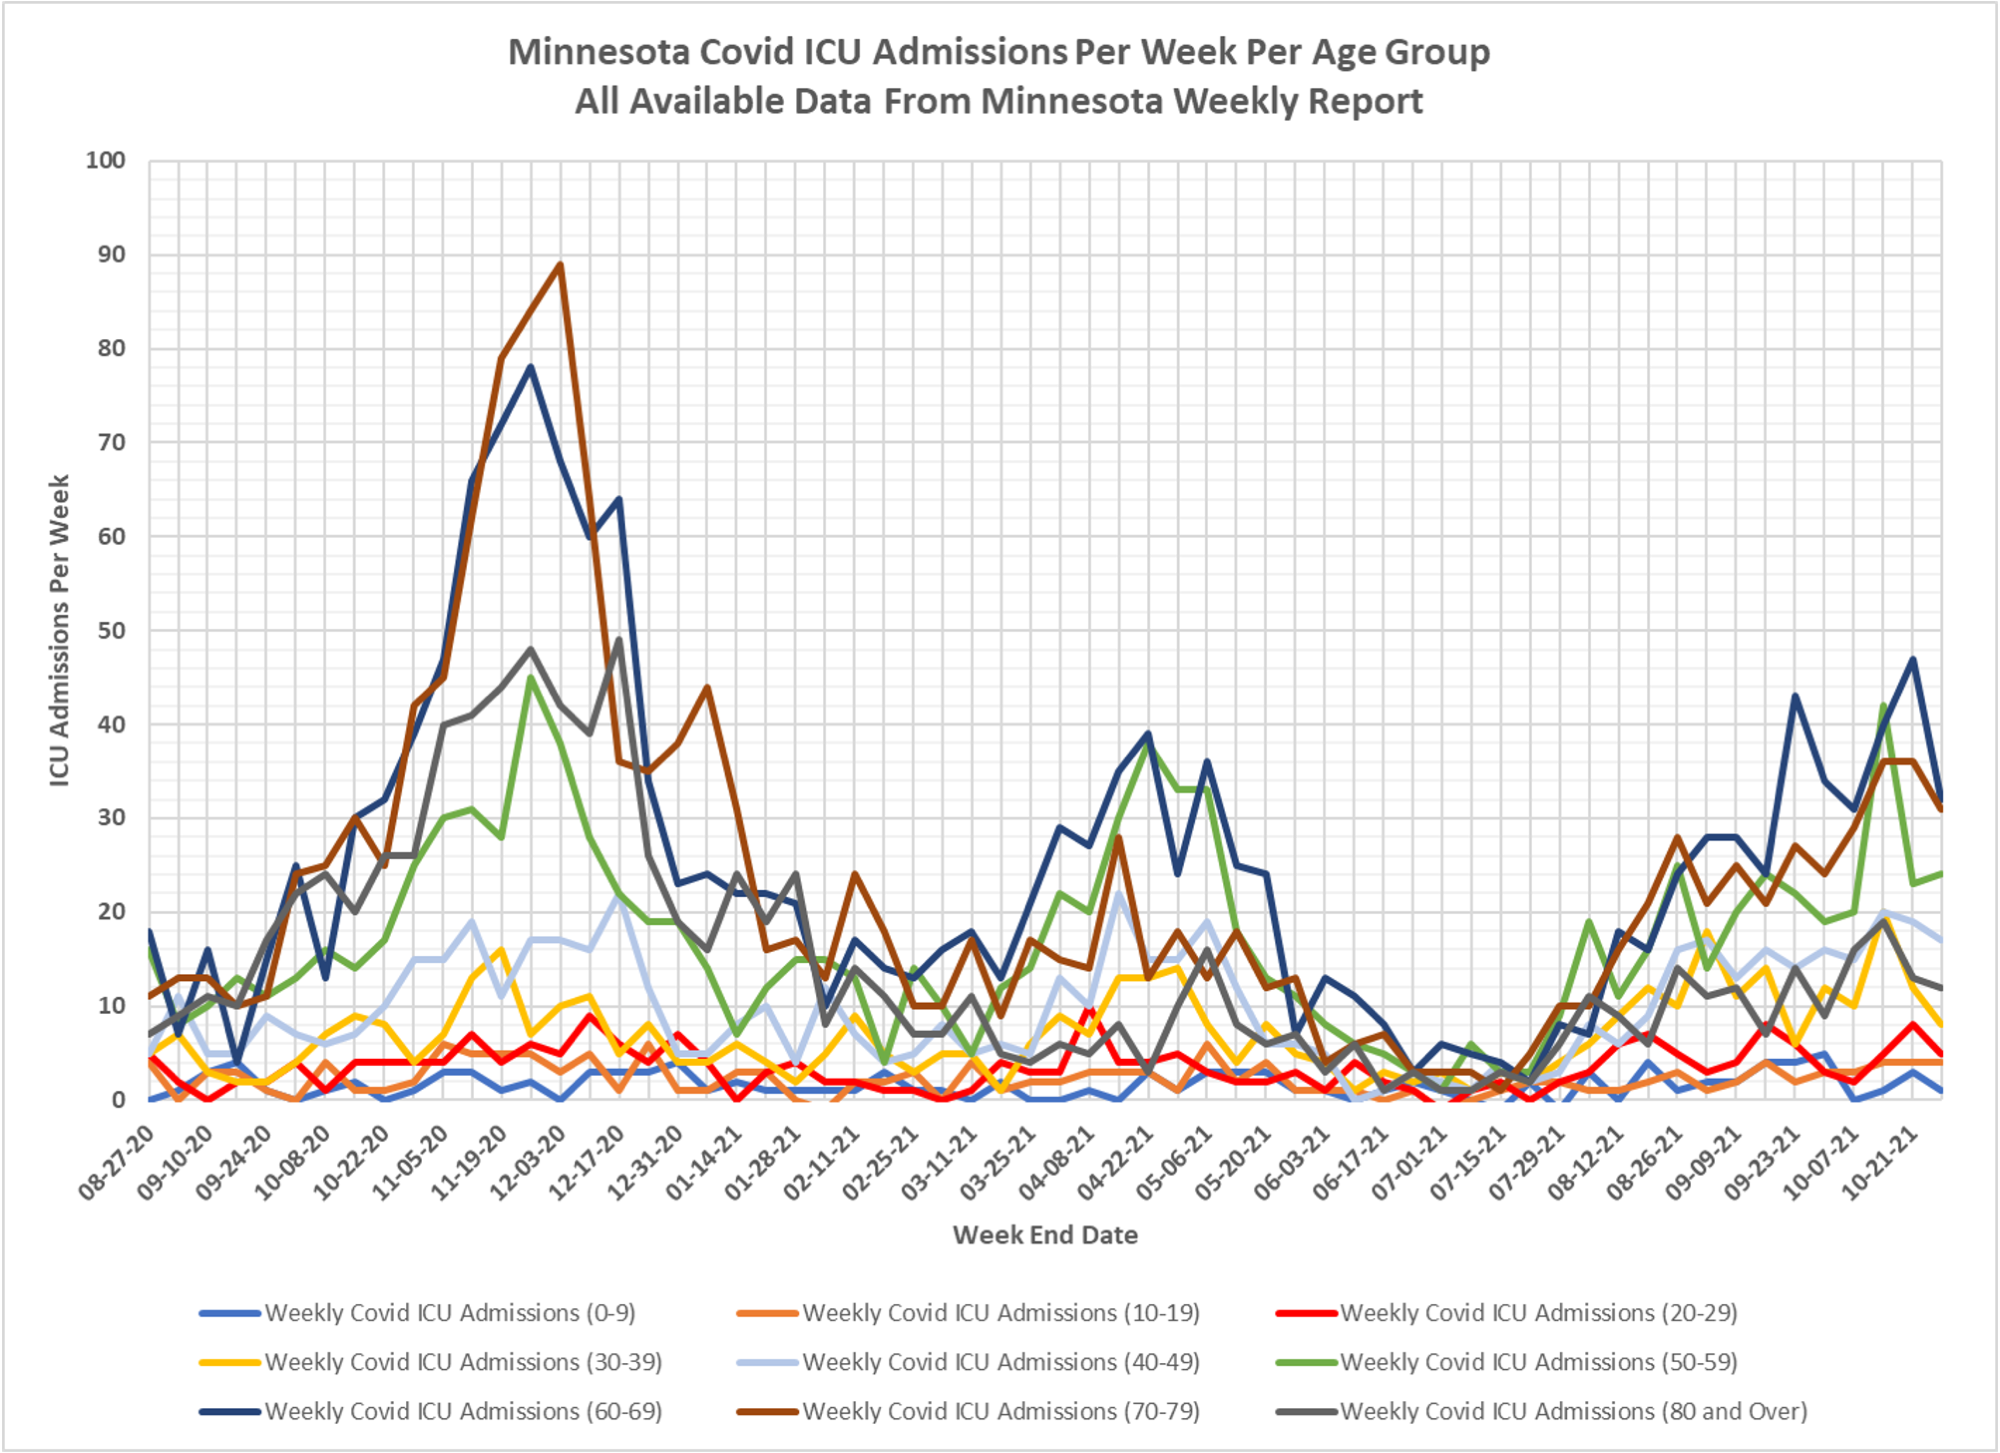
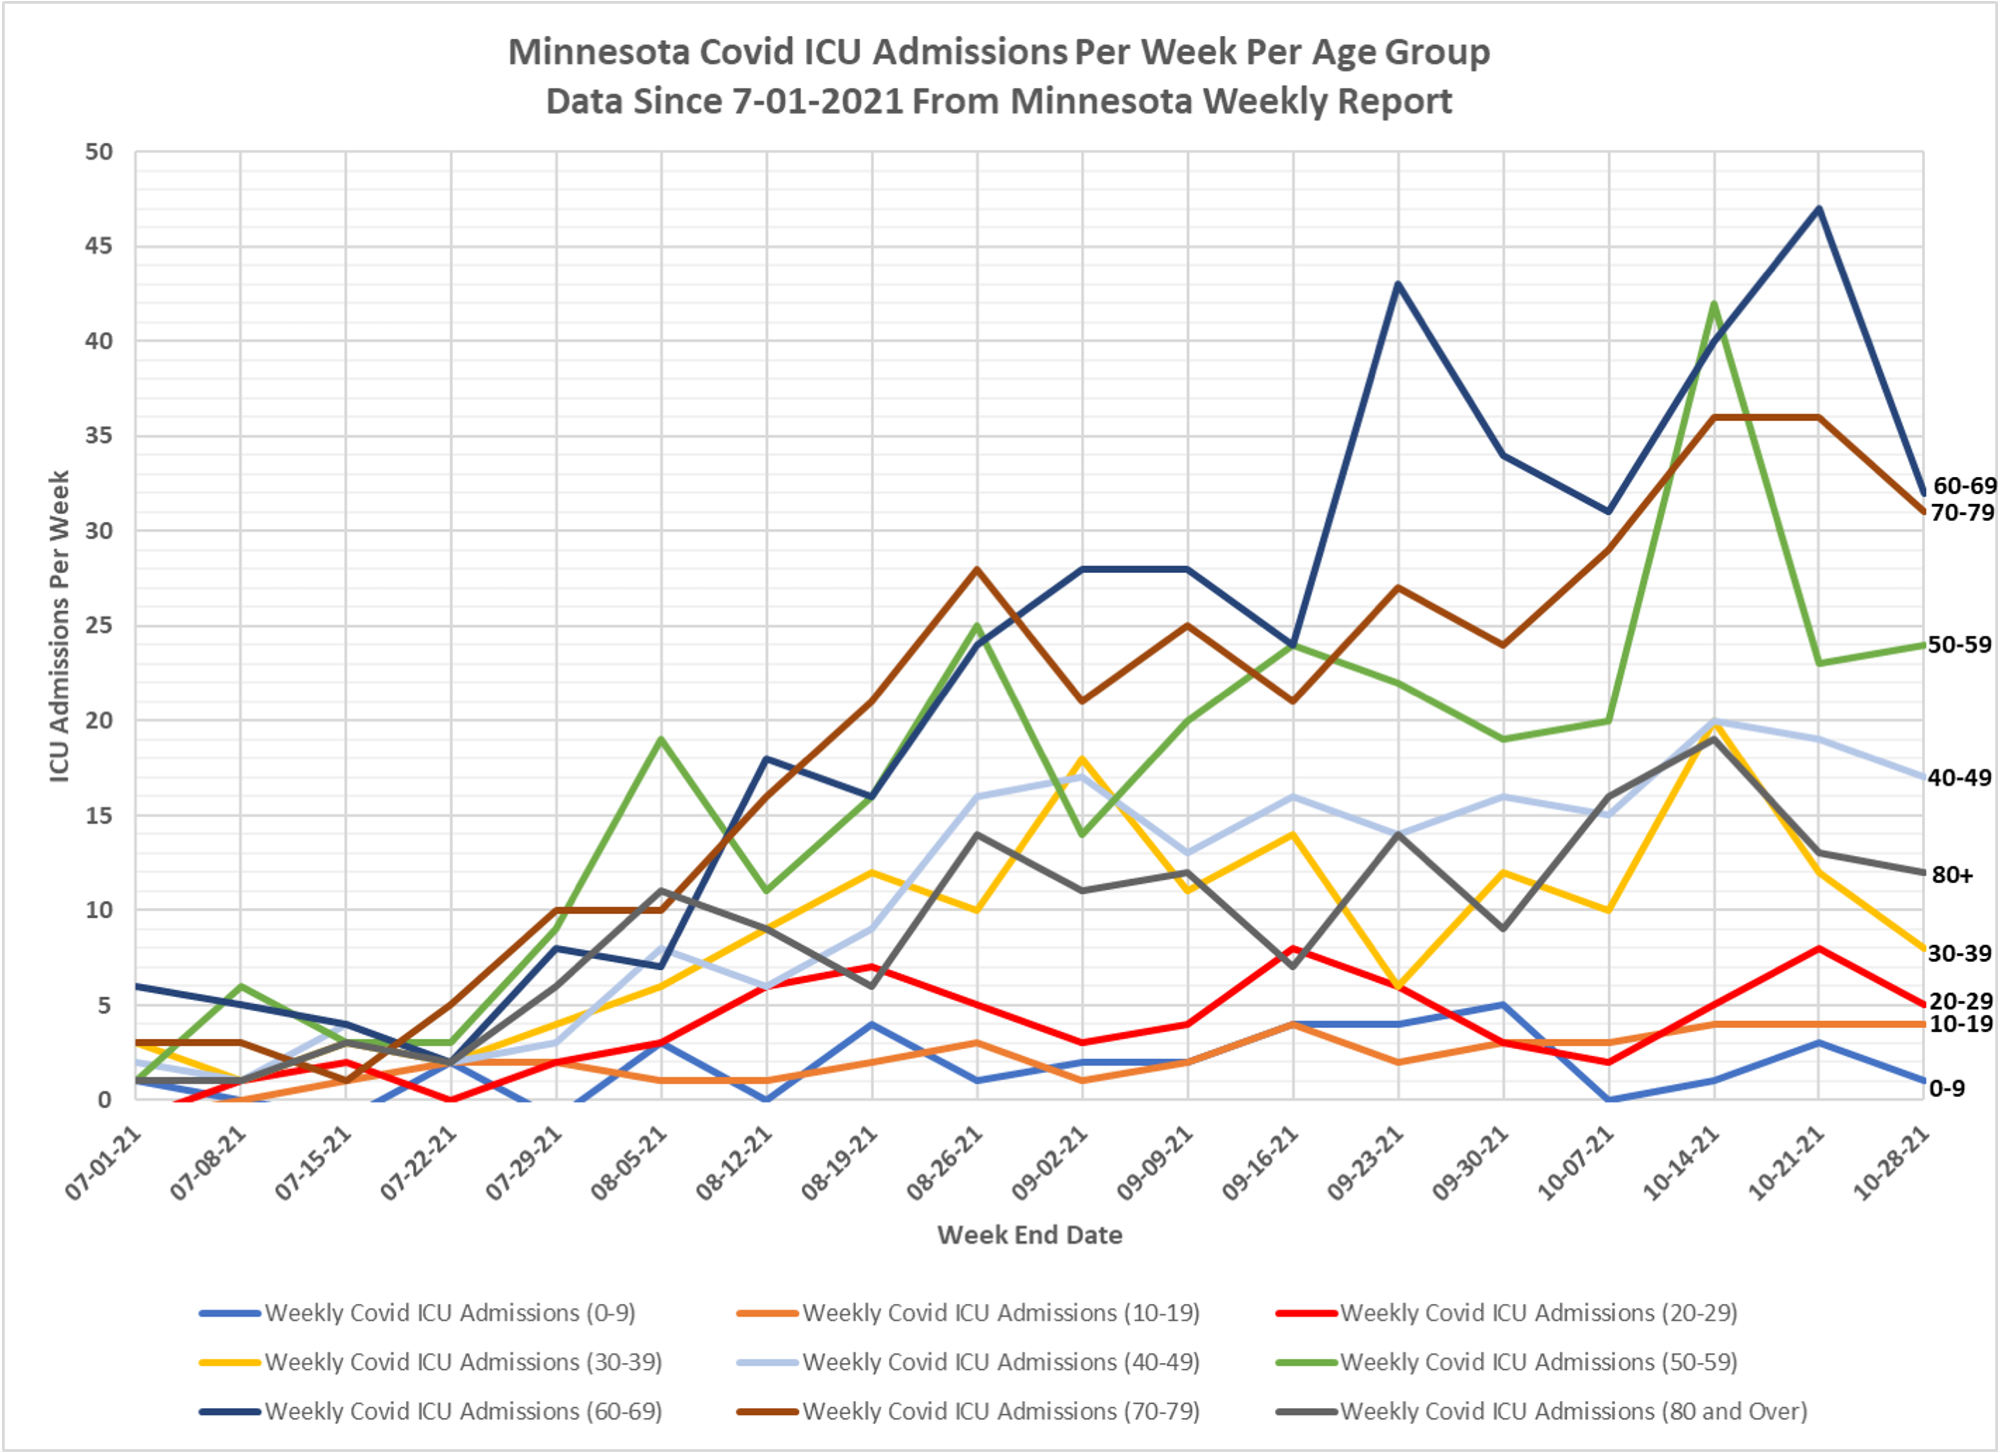
Slides 5 and 6: ICU Admissions Per Week;
These was one reported ICU admission in the 0-9 age group in this Weekly Report, and four in the 10-19 age group. There still appears to be very minor impact of Covid infections on ICU admissions for school age children.
All other age groups were also lower except for the 50-59 age group, which rose slightly.
Total ICU admissions for the week were 134, a reduction of 18.8% compared to the prior week.
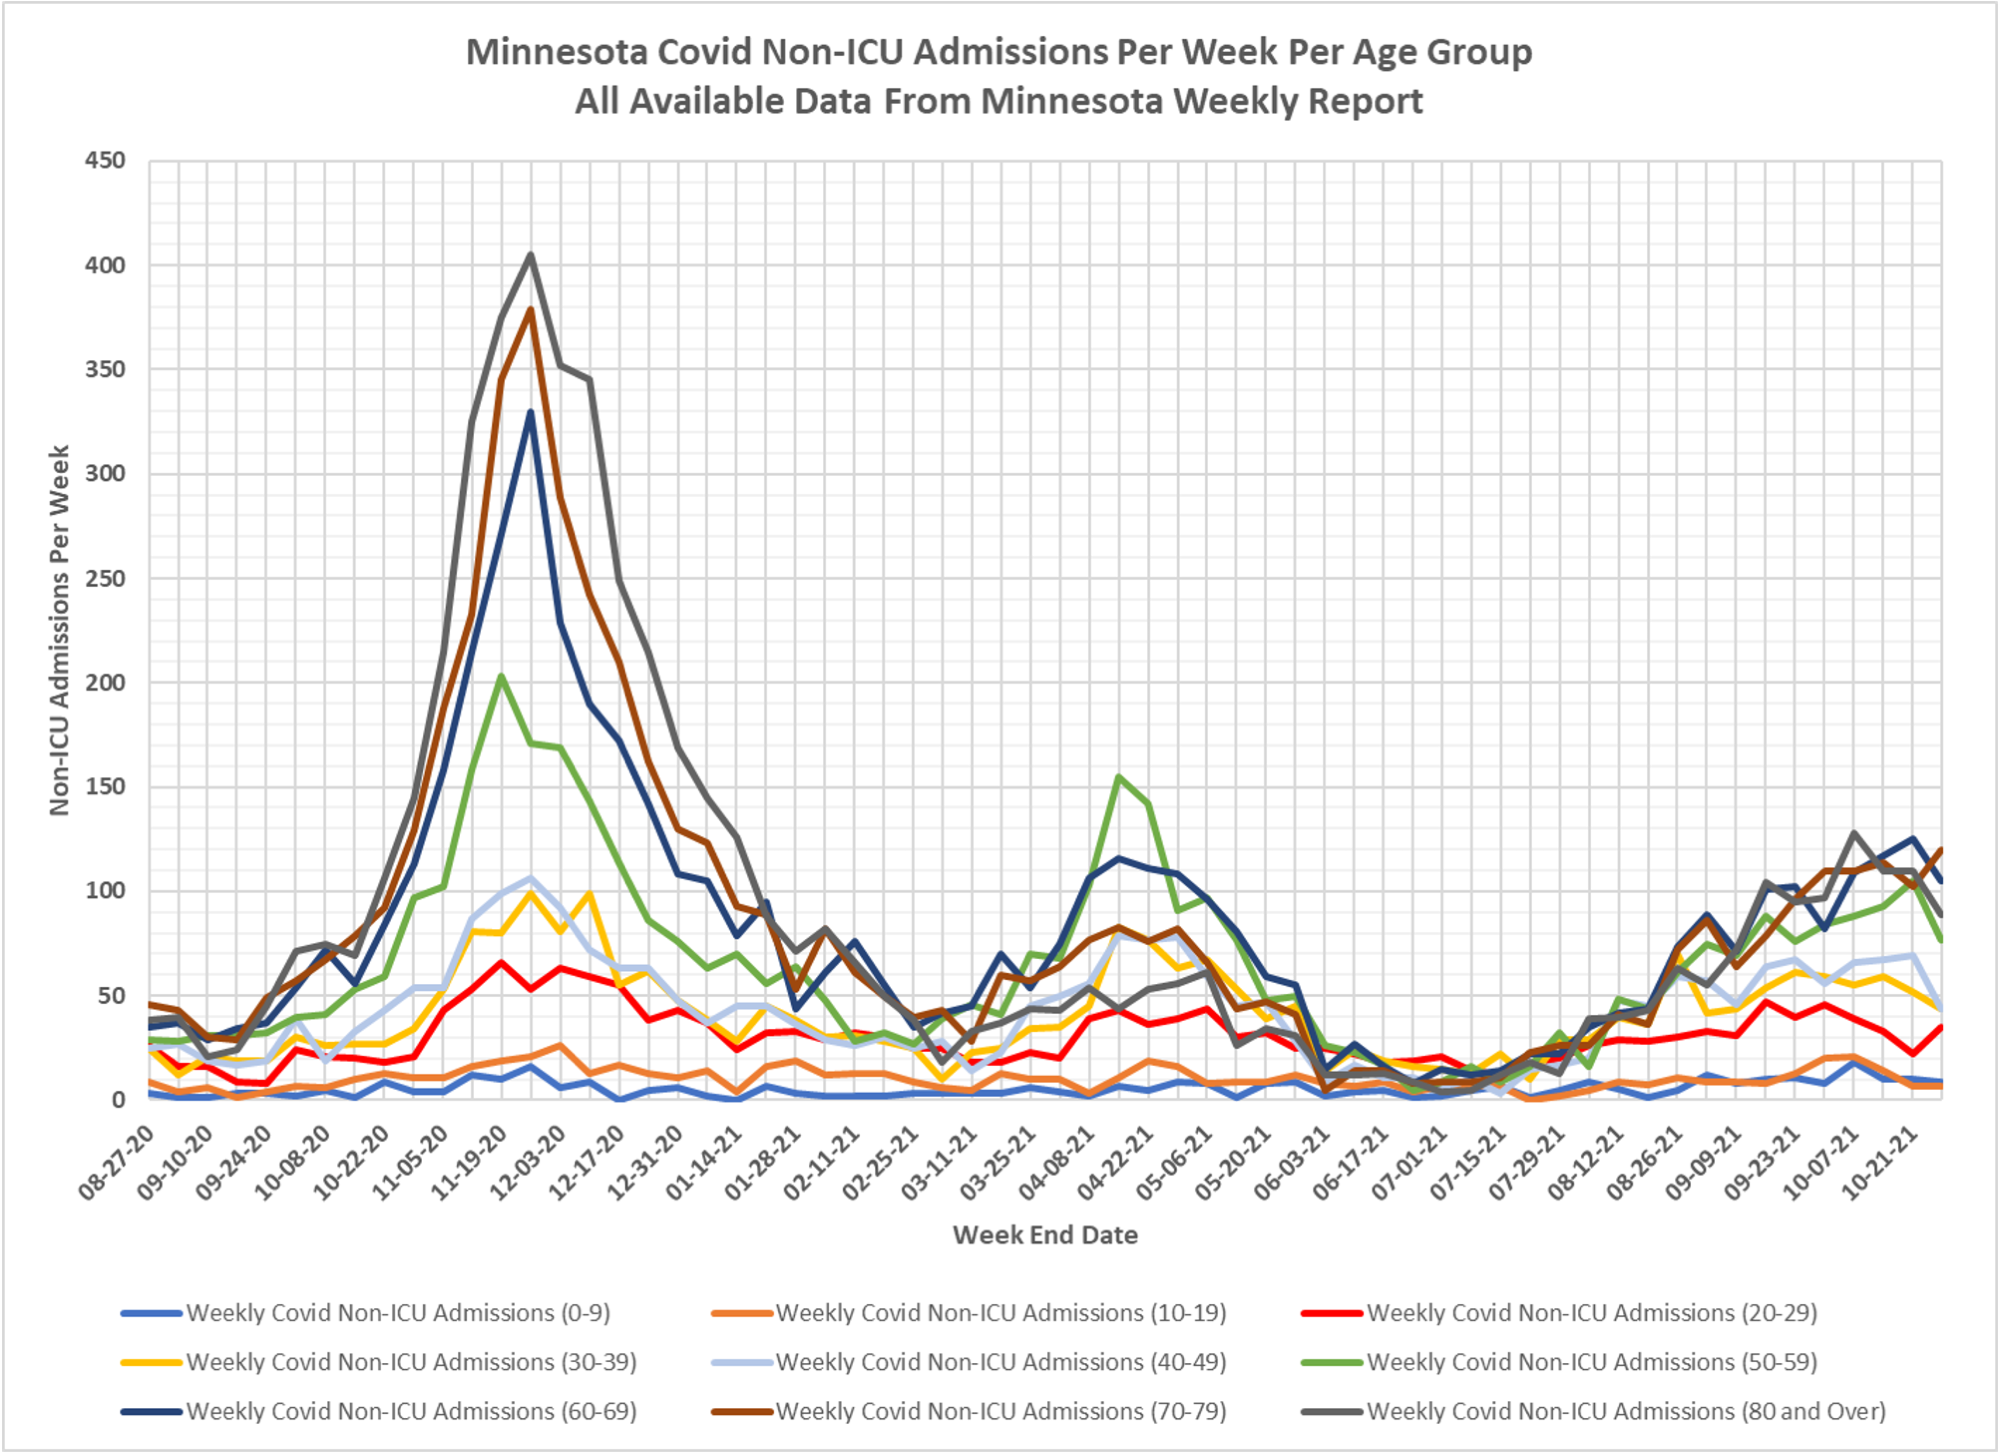
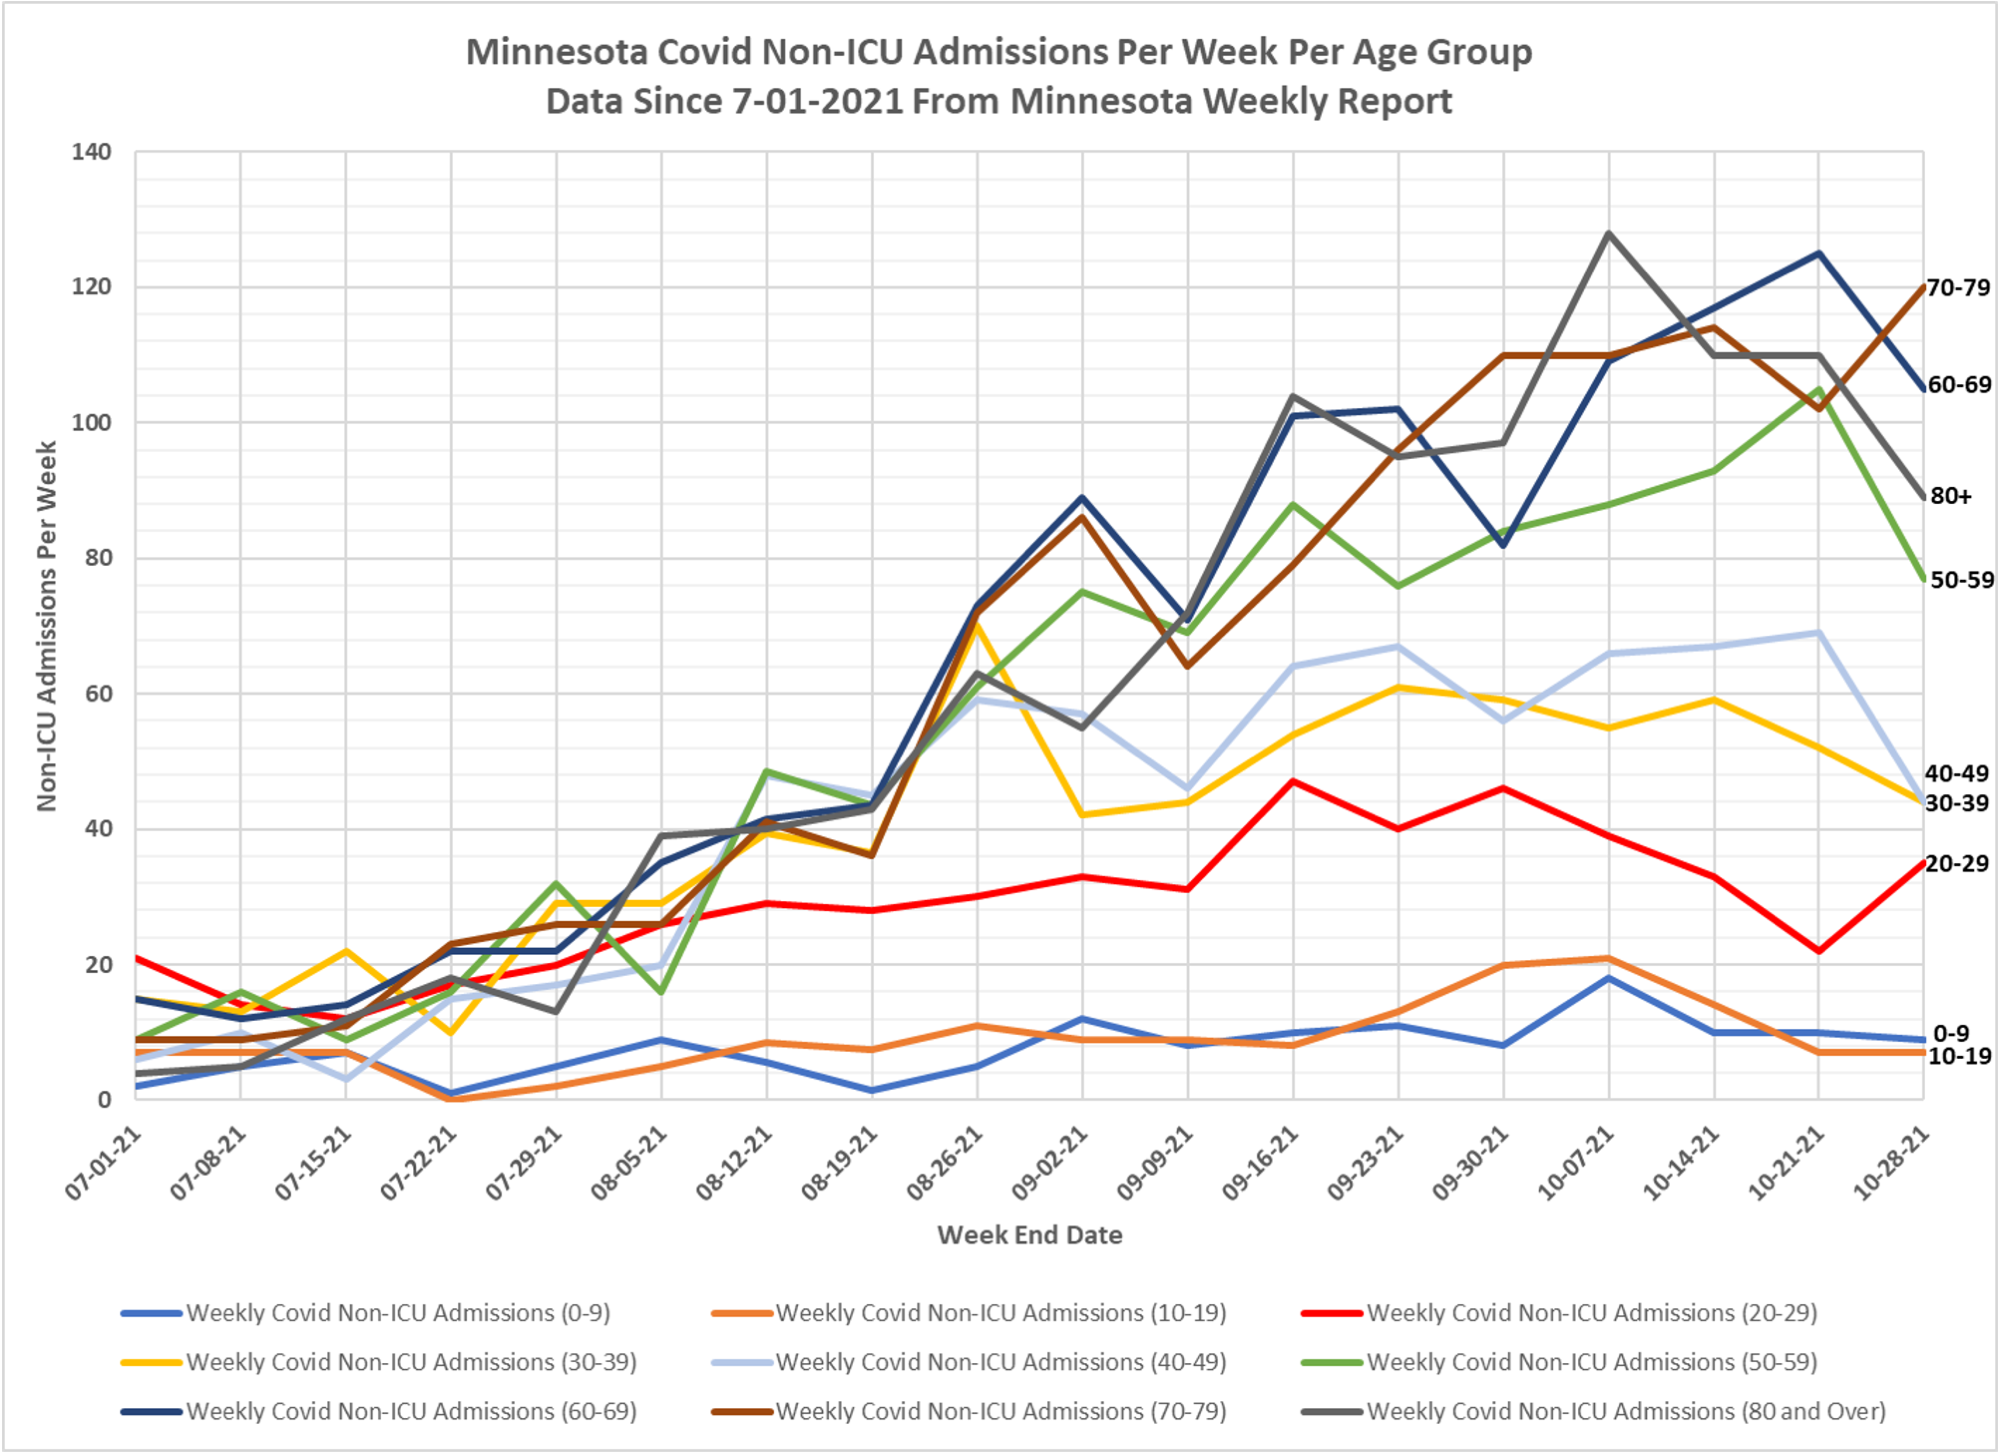
Slides 7 and 8: Non-ICU Admissions Per Week:
Non-ICU admissions were lower this week for all age groups except 20-29 and 70-79.
Total Non-ICU admissions for the week were 530, a 12% reduction compared to last week.
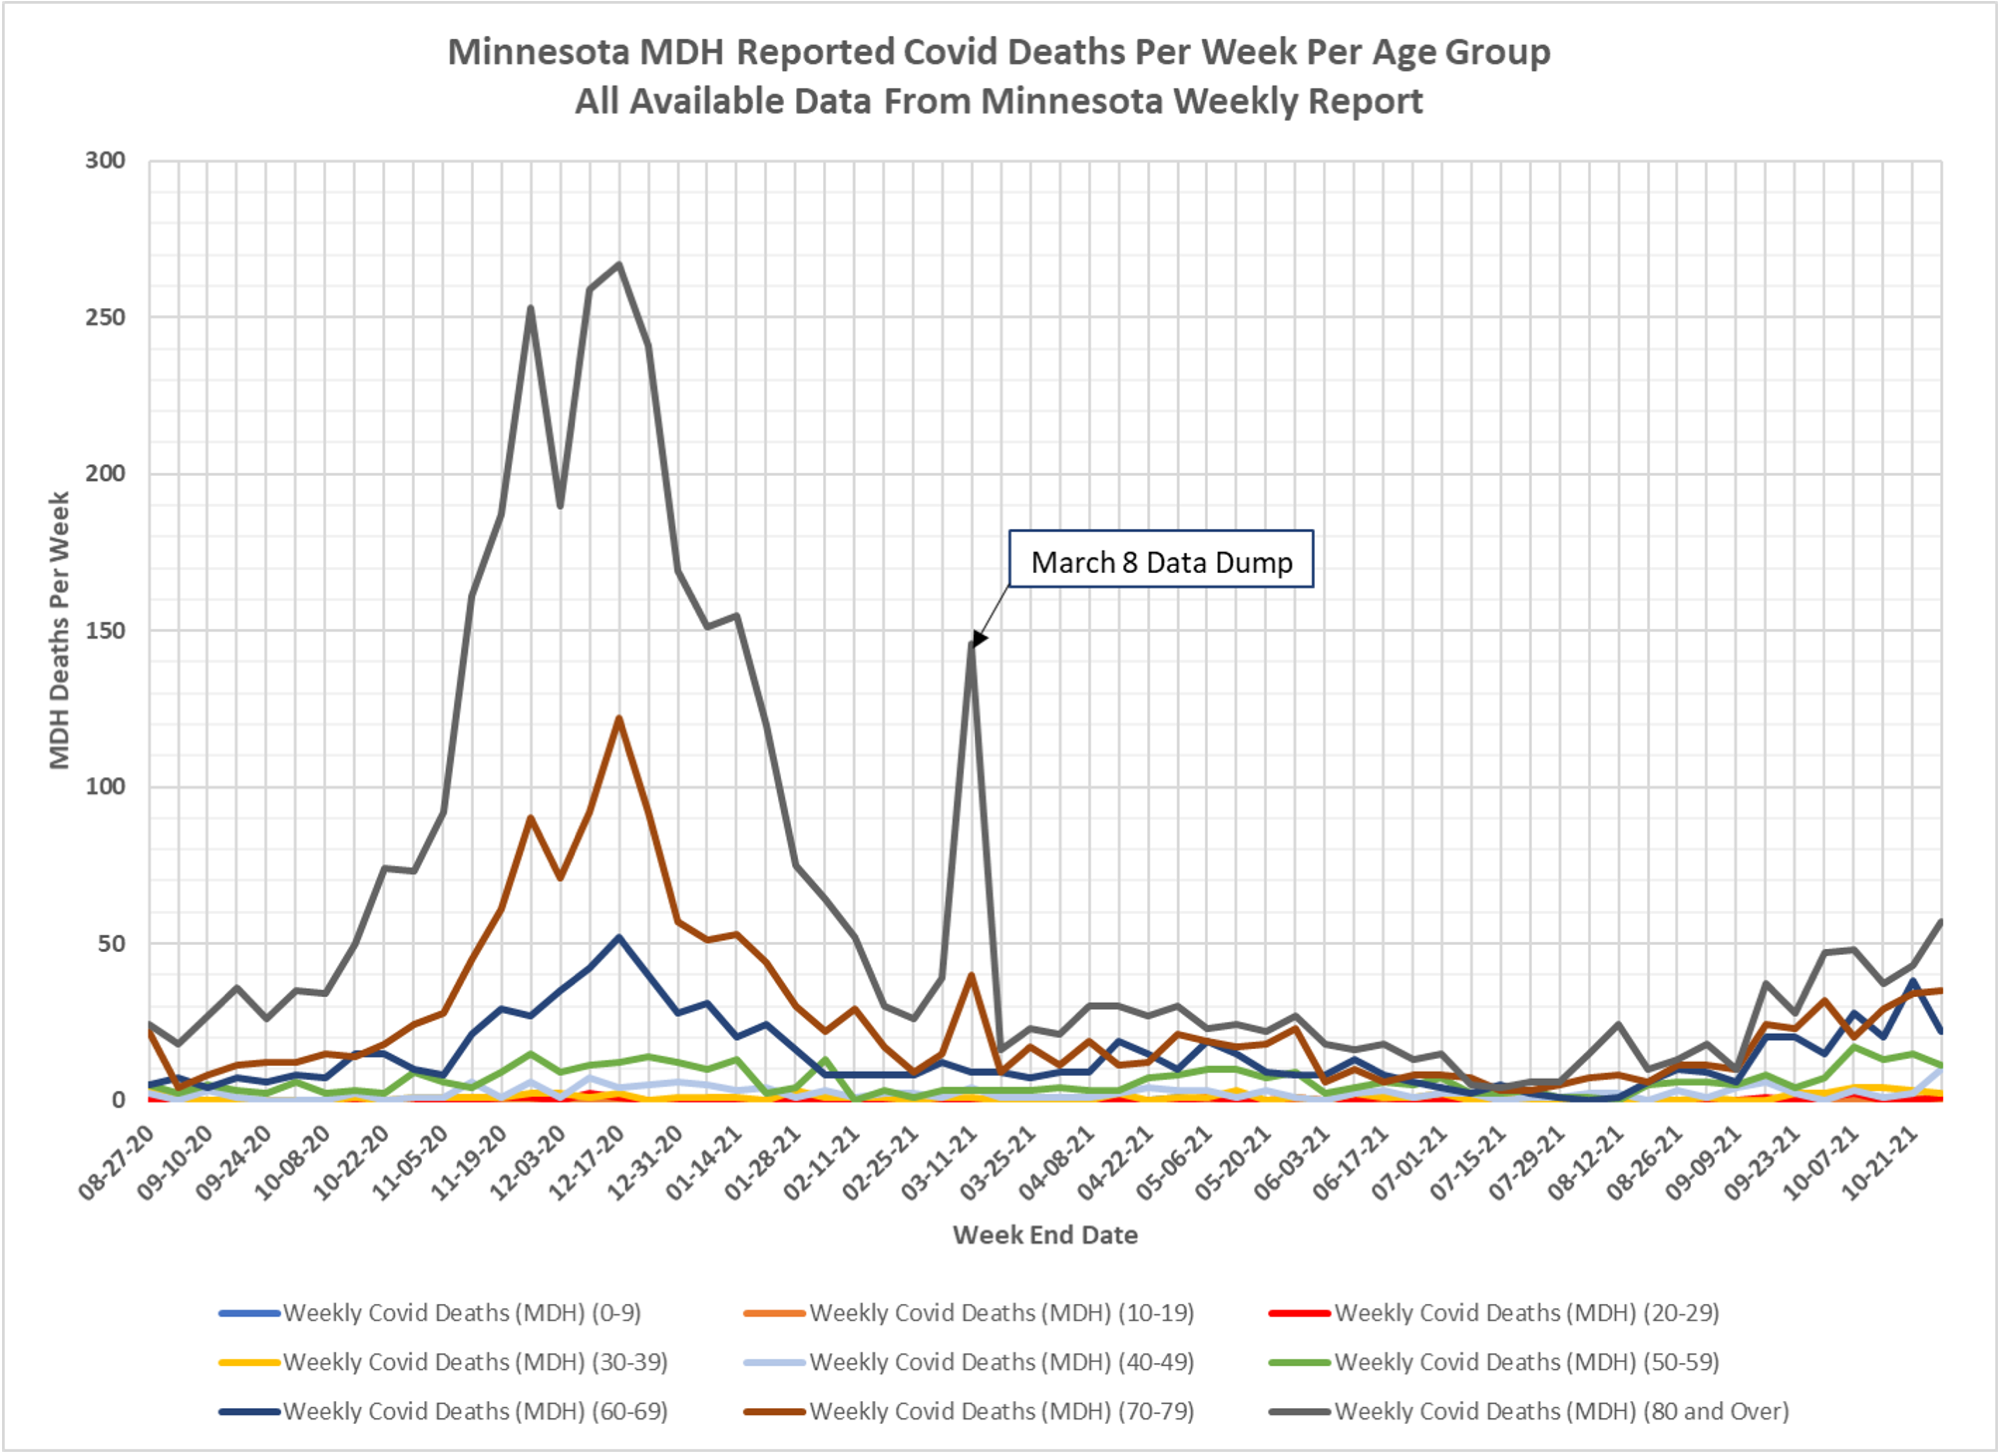
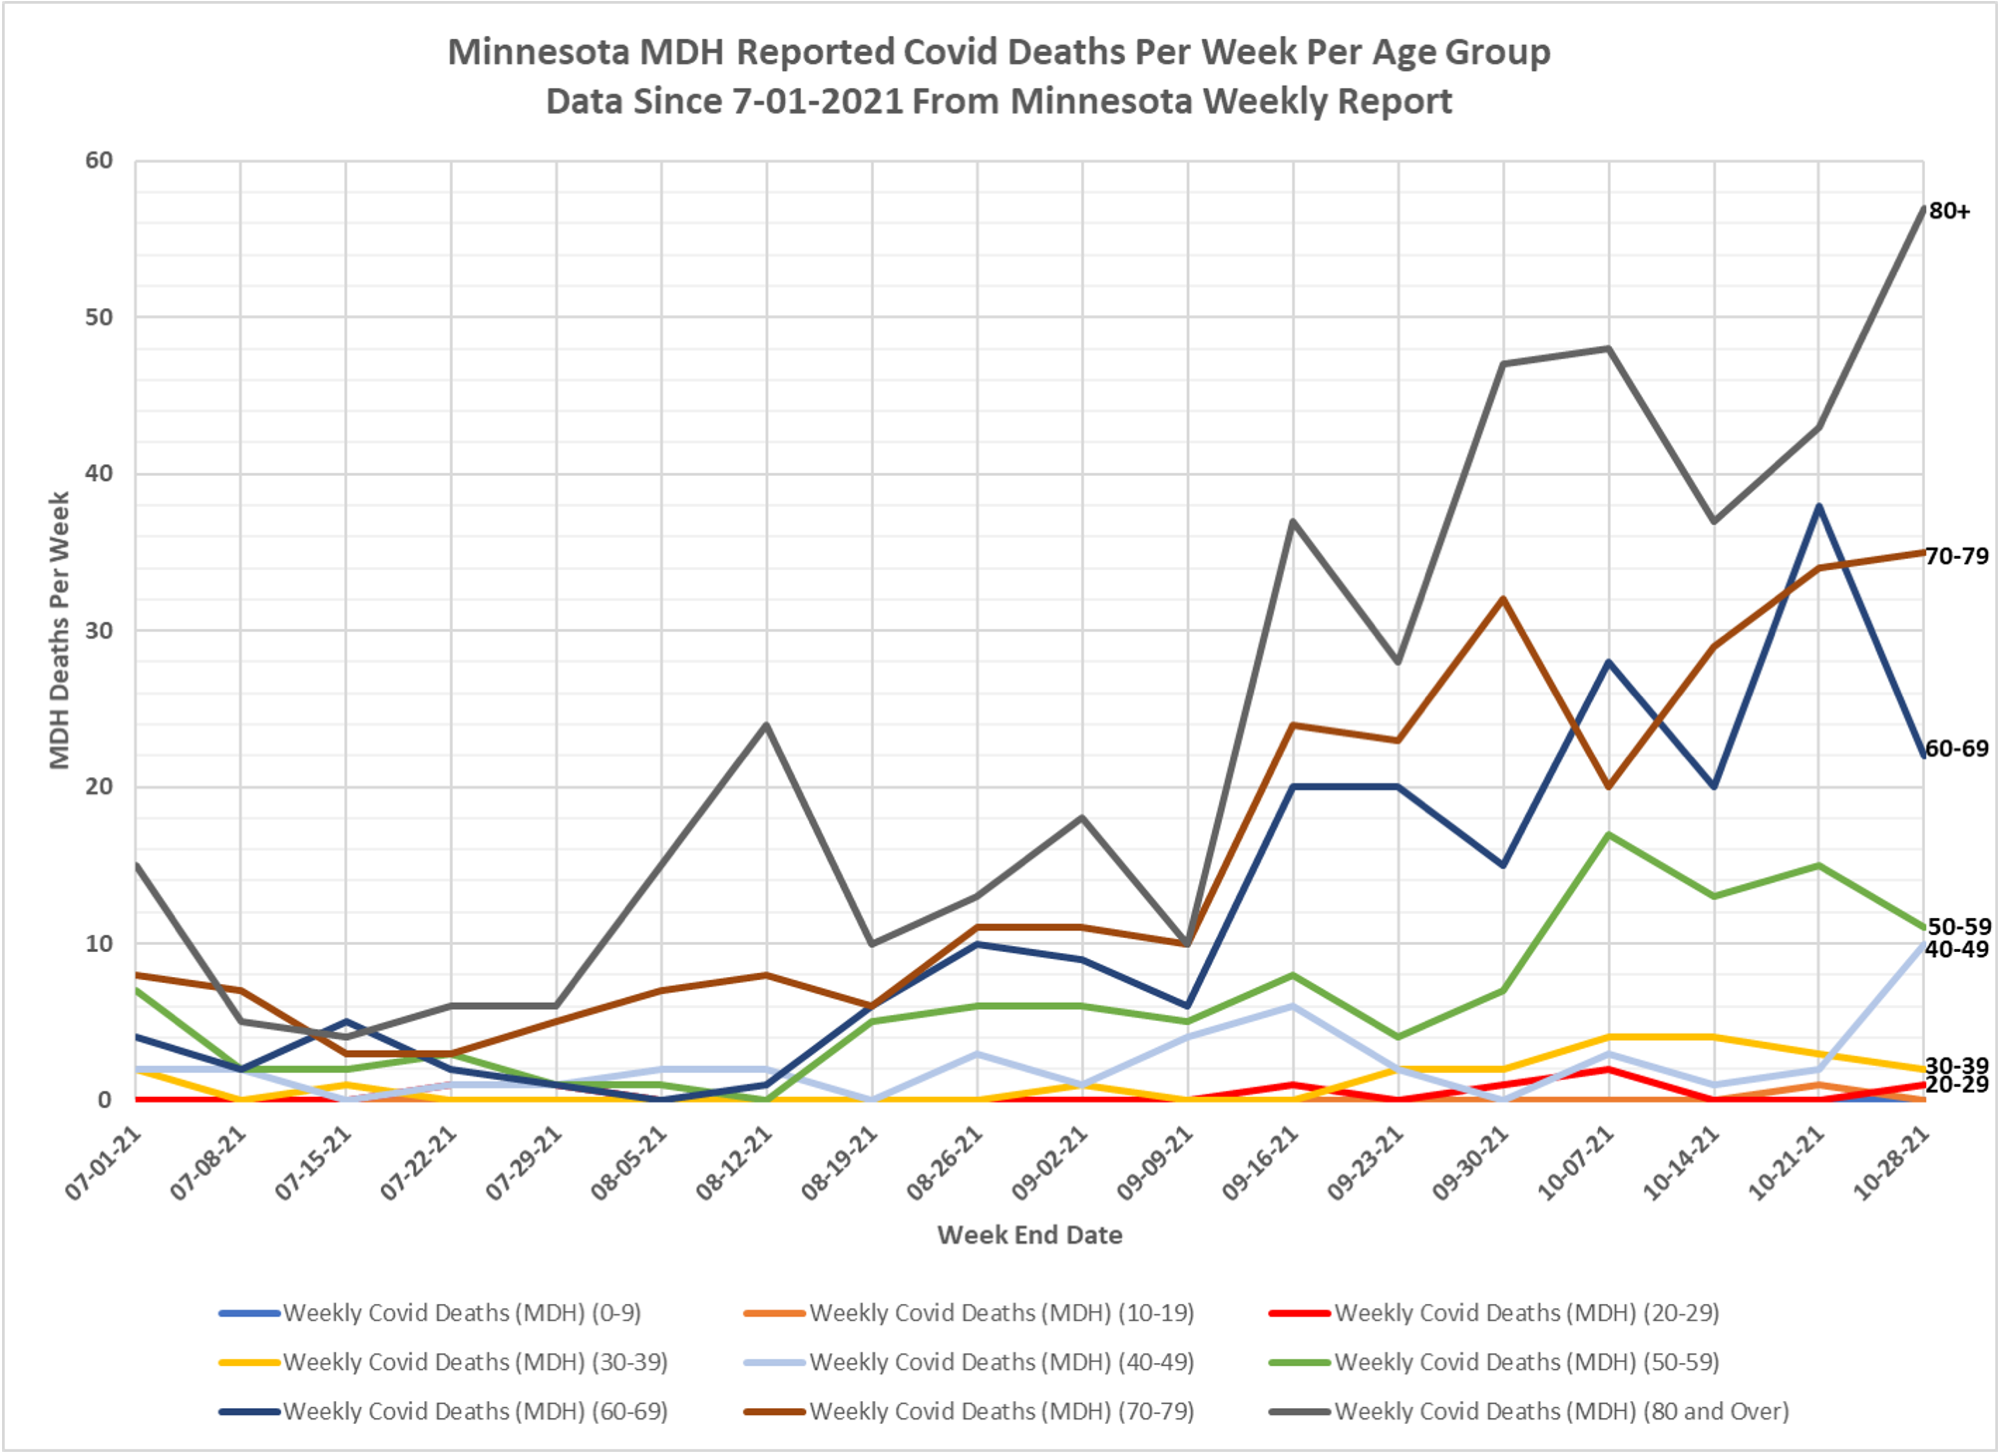
Slides 9 and 10: Deaths Per Week:
Deaths per week are trending higher, led by the 80+ and 70-79 age groups.
Total reported deaths for the week were 138, only a slight increase over 136 deaths the week before.
Bear in mind that these charts show reported deaths, and not deaths by date of death. Since July DOH has required 18 days on average to report 100% of the deaths that occurred on a given date, but there can be a wide range on the time required for any particular day.

Is there any way to get a chart of total deaths by week for each of the last 10 years? Nov-Feb are usually the highest death months so comparing a week to the same week over a ten year span would be more helpful and show excess death better. There is too much $$ incentive right now for the DOH to exaggerate COVID deaths and play up the terror. So going back ten years would show if the stories the DOH et al are exaggerations of normalcy or an anomaly. Ivor Cummins did this for a few European countries and showed 2019 was an unusually small number of total deaths – the increase in 2020 pretty much just made up for the “shortfall” of 2019 deaths.
Both the CDC and DOH have information on deaths by cause. I am not sure how far they go back.
Wow! The graphs say it all. If you live long enough you will die and Covid will get the blame. Some of us had it right from the beginning. Covid specializes in killing the elderly and medically frail. Try to protect them and let the rest get natural immunity.