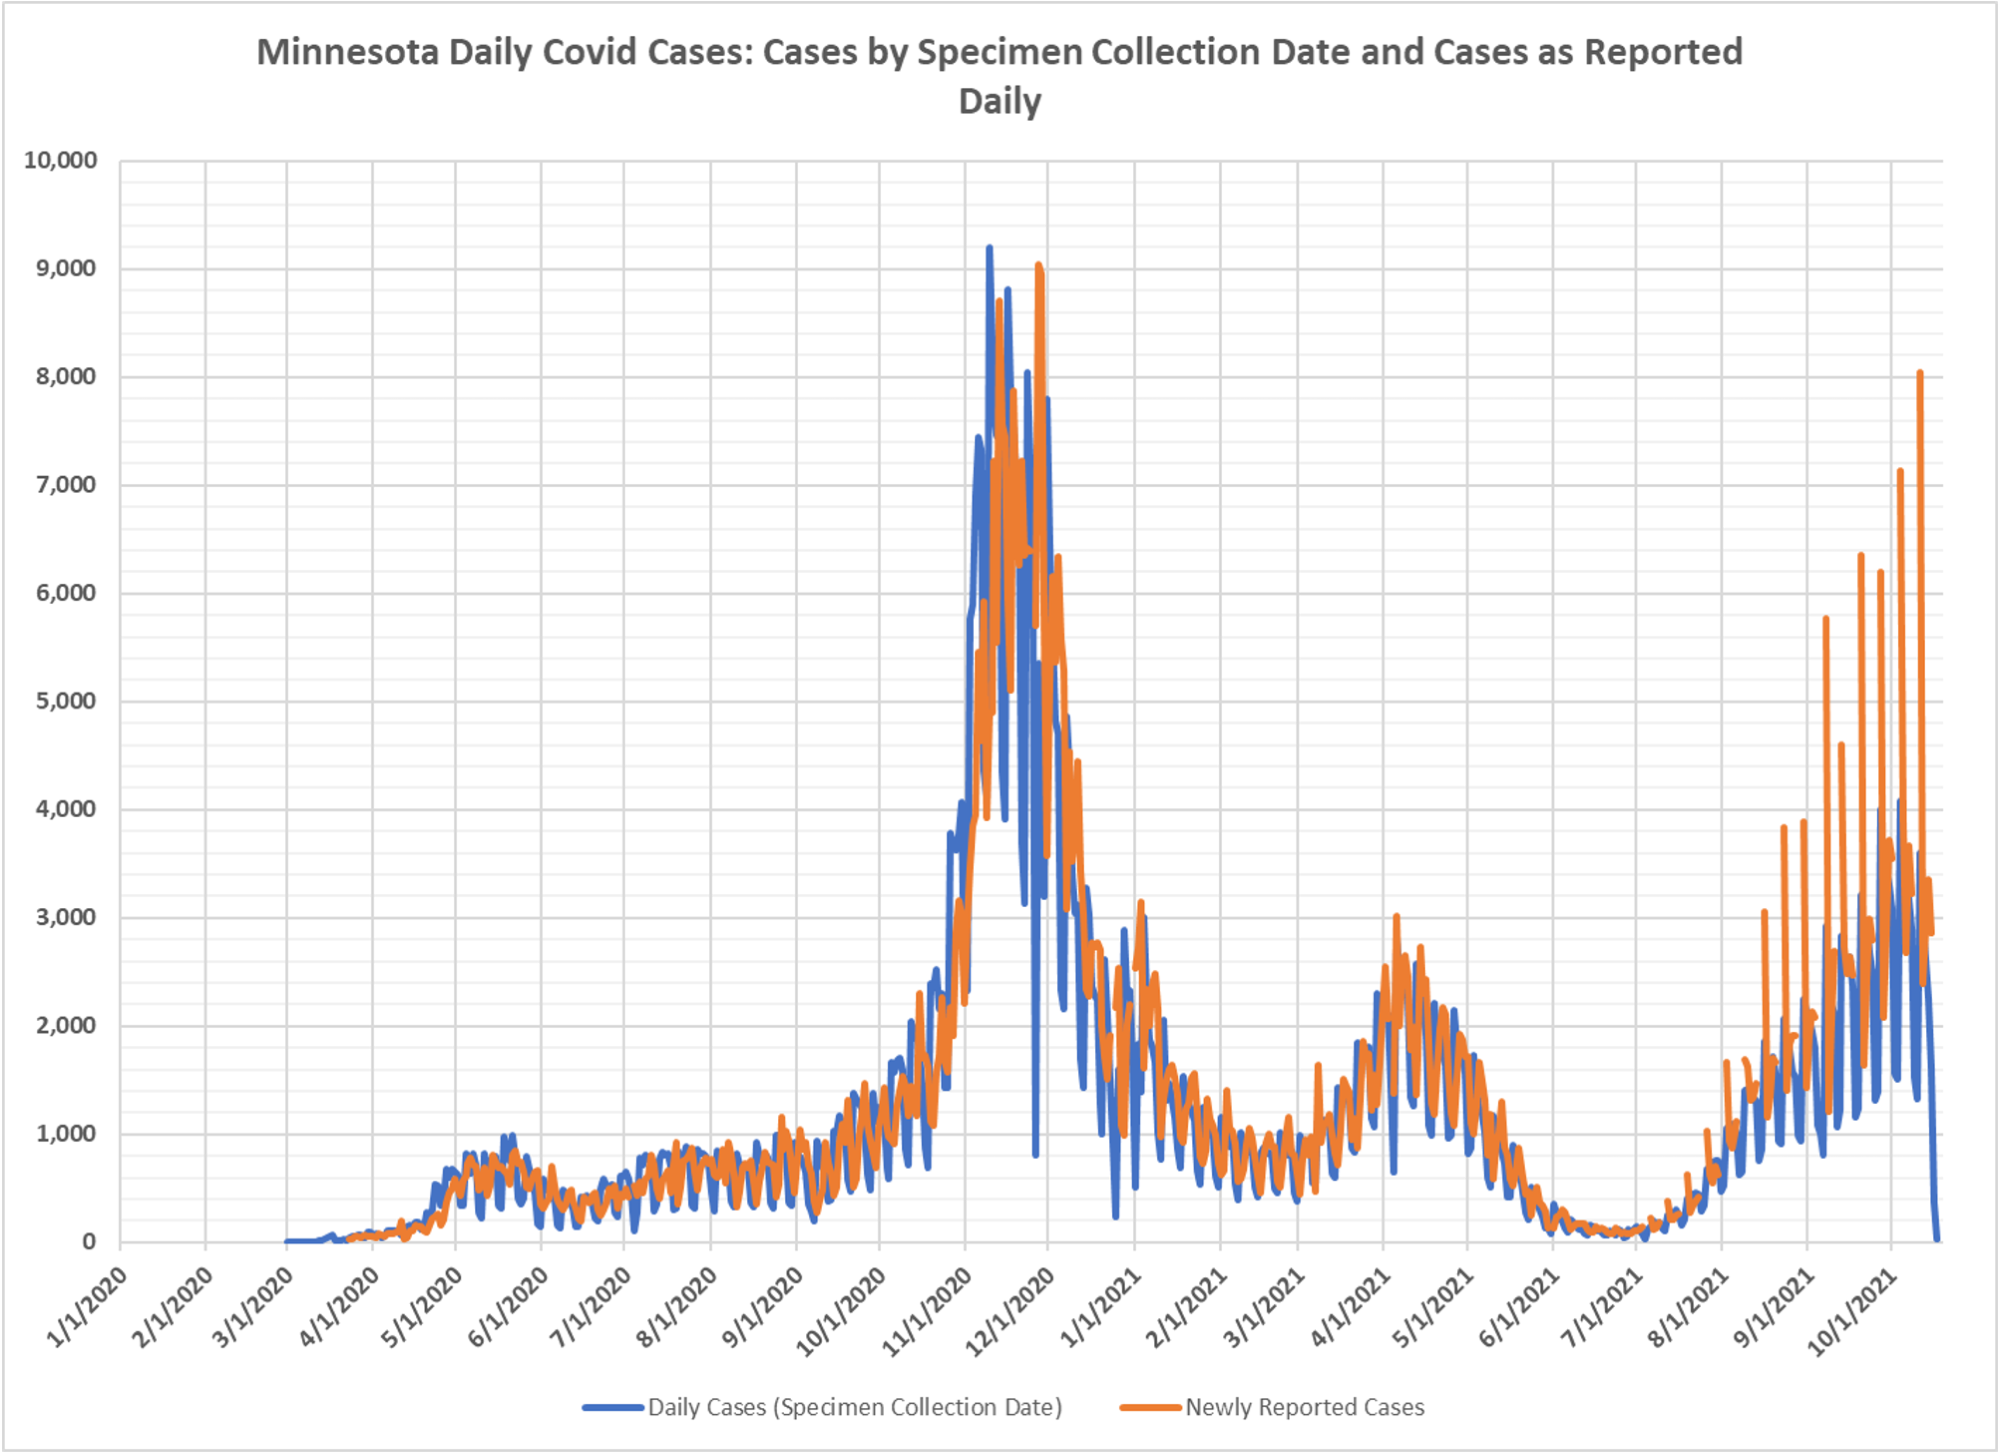
Dave Dixon and I are always trying to figure out how to create more meaningful data and get a better sense of trends. Cases are now reported only on weekdays, but the cases reported on any given day are actually spread over a large number of days in terms of when the specimen was collected. You can see the cases by date of specimen collection in the table of cases. Dave and I have tended to use that table for our analyses because it is more accurate but it takes a few days for 95% of a day’s cases to be reported. So we have wondered if just looking at the trend in reported cases would be informative and a little more timely. We wondered if the reported trend was much different than the date of trend. That analysis is screwed up because of no weekend reporting, so Monday and Tuesday’s reports are extra heavy. But this chart compares the two over the course of the epidemic and you can see that indeed there is a pretty good correlation, with reported cases leading date of by a few days, but with the same shape. Try to ignore the spikes and just watch the shape in the last few months. Just watching reported cases can have some predictive value in terms of epidemic trend. Based on that, we did roll over in the last week or so. Please note too, that on average even that table of cases by specimen collection date has a couple of days lag, since people don’t get tested on the first day they are infected.


 RSS - Posts