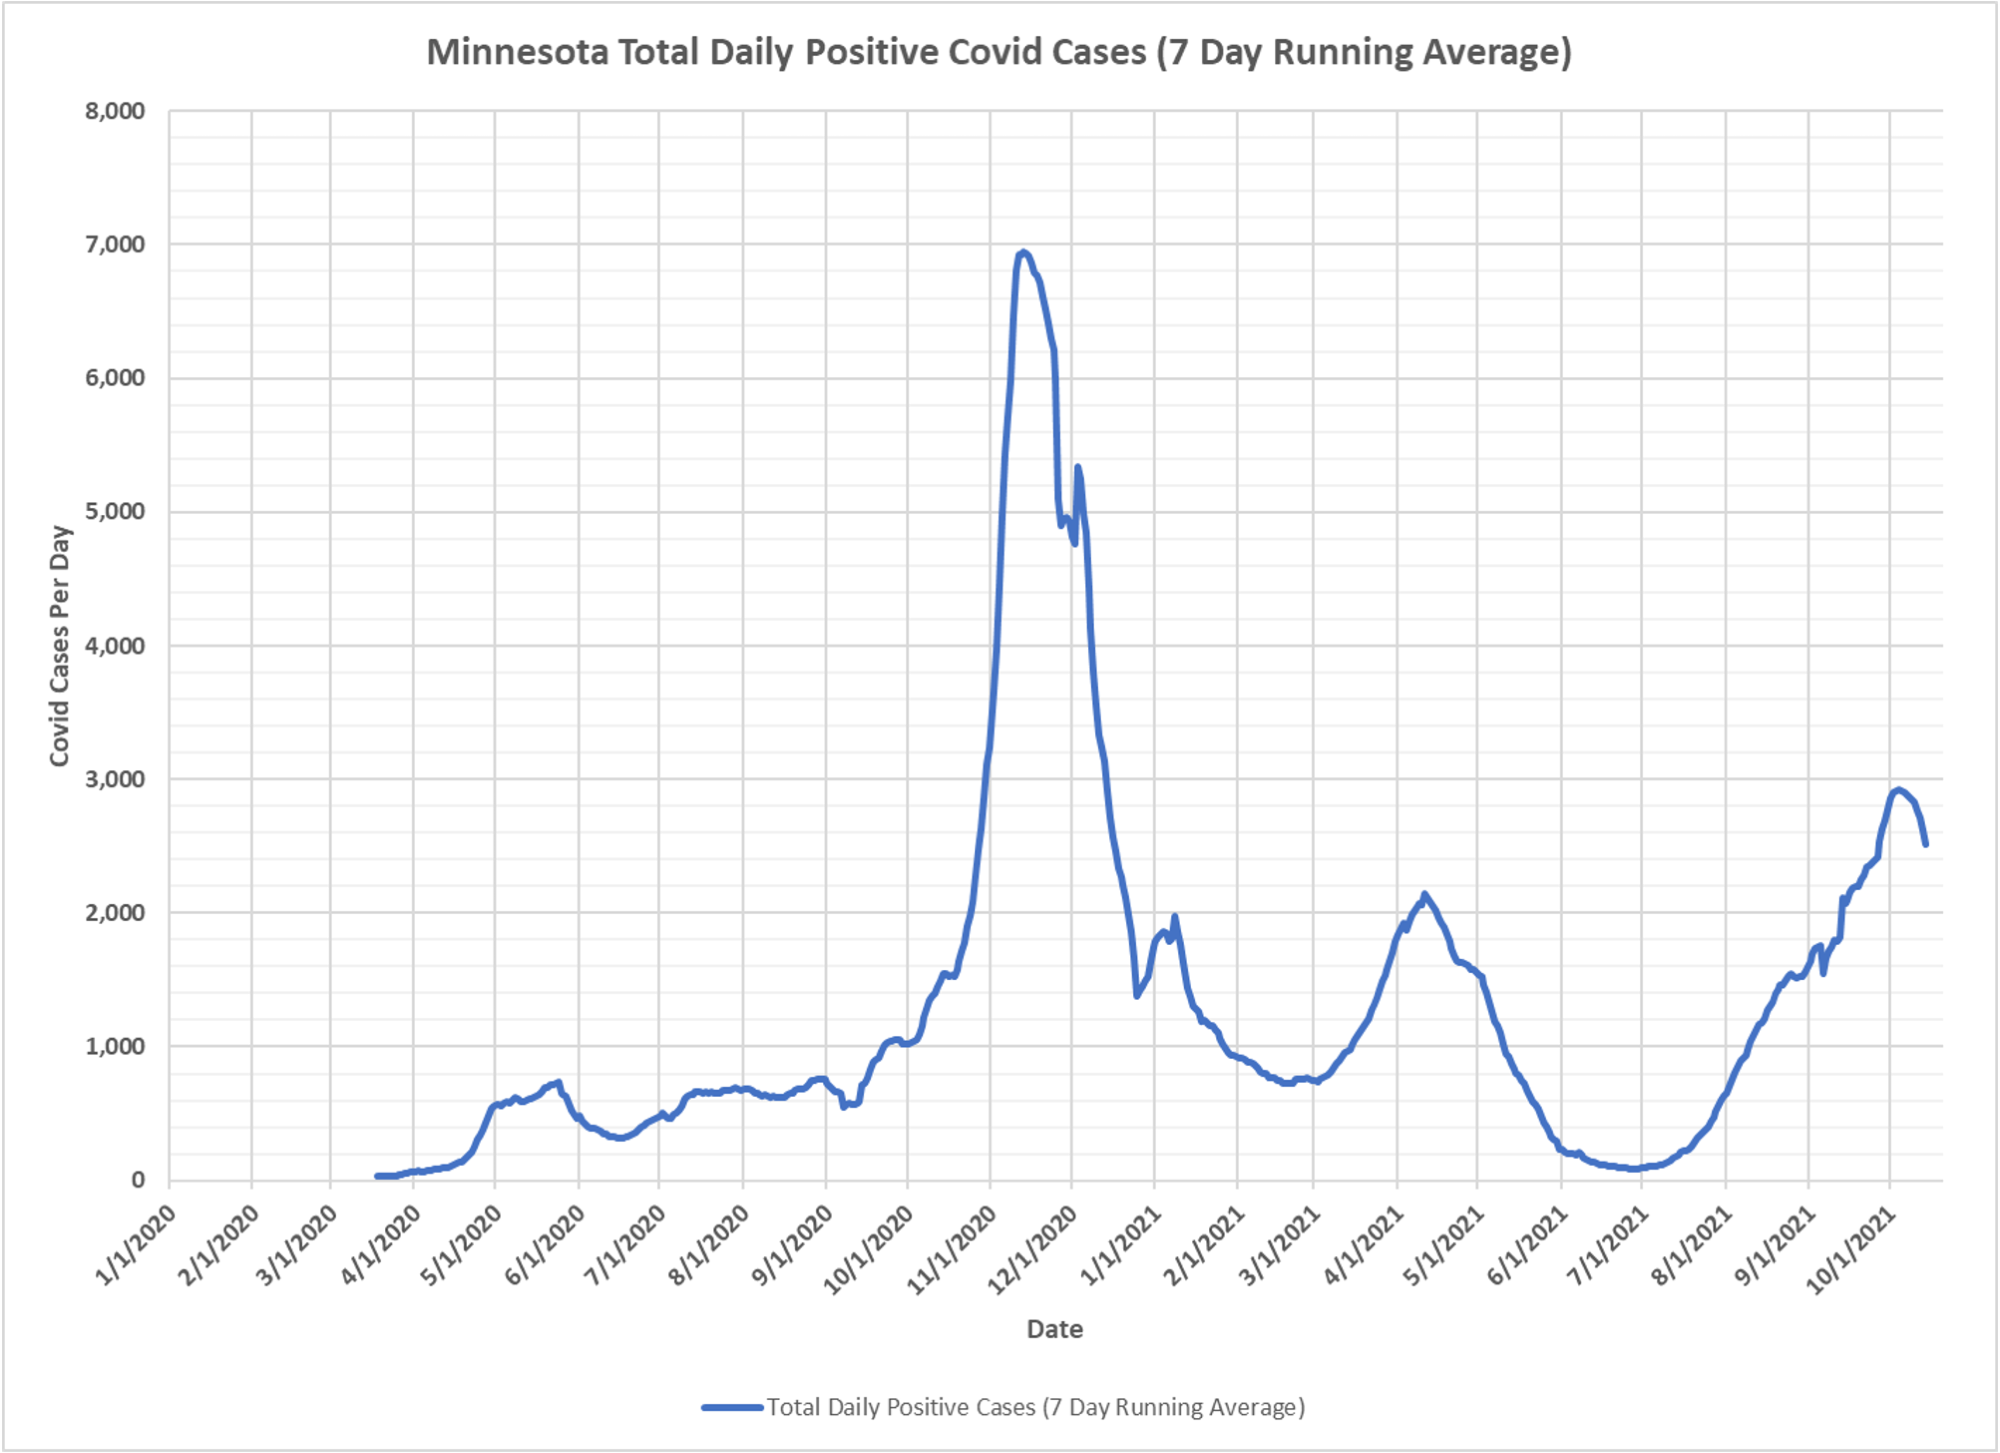
Dave Dixon’s latest version of just cases, date of specimen collection, seven day running average to correct somewhat for testing variation, lagged a week to allow for completeness of a day. What fascinates me, if this is the peak for this wave, is that the rollover looks just as sharp as the prior wave. I had expected vaccines to result in a somewhat blunter shape. One explanation is that there really is a 20/80 rule at work–20%, or fewer, of people who get infected cause the vast majority (look, Jan, vast majority meaning 80% or more) of transmission. When you run low on those “superspreaders”, the level of transmission drops dramatically. Maybe there are other explanations as well, but something is up. And while I think meteorological factors must play some role, the timing of the waves in Minnesota is just odd, so that they can’t be dominant factors.