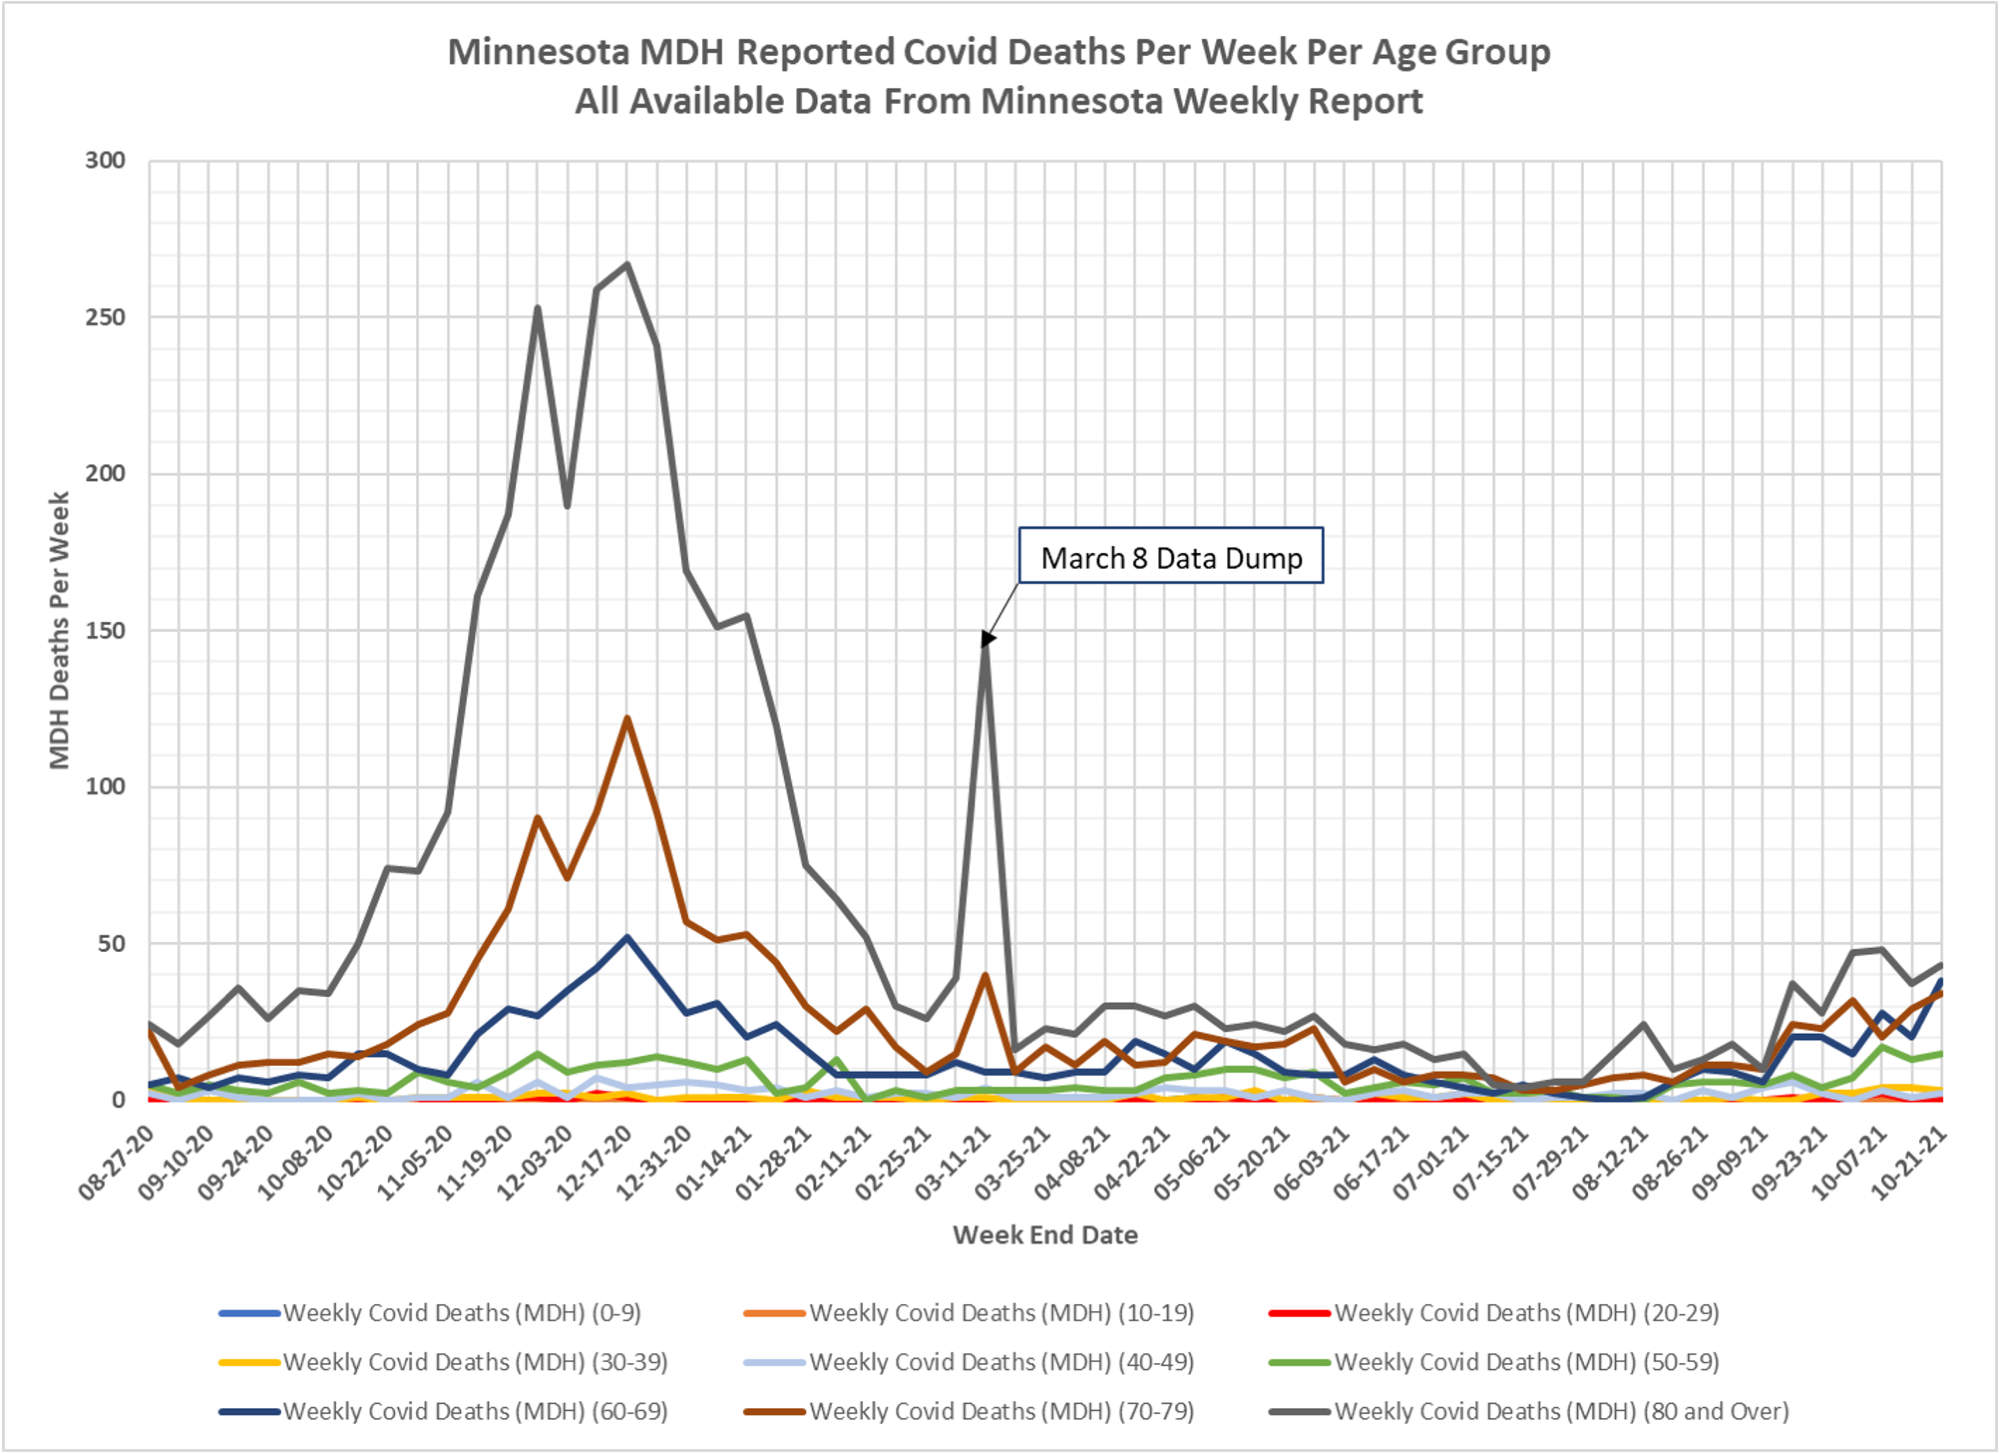
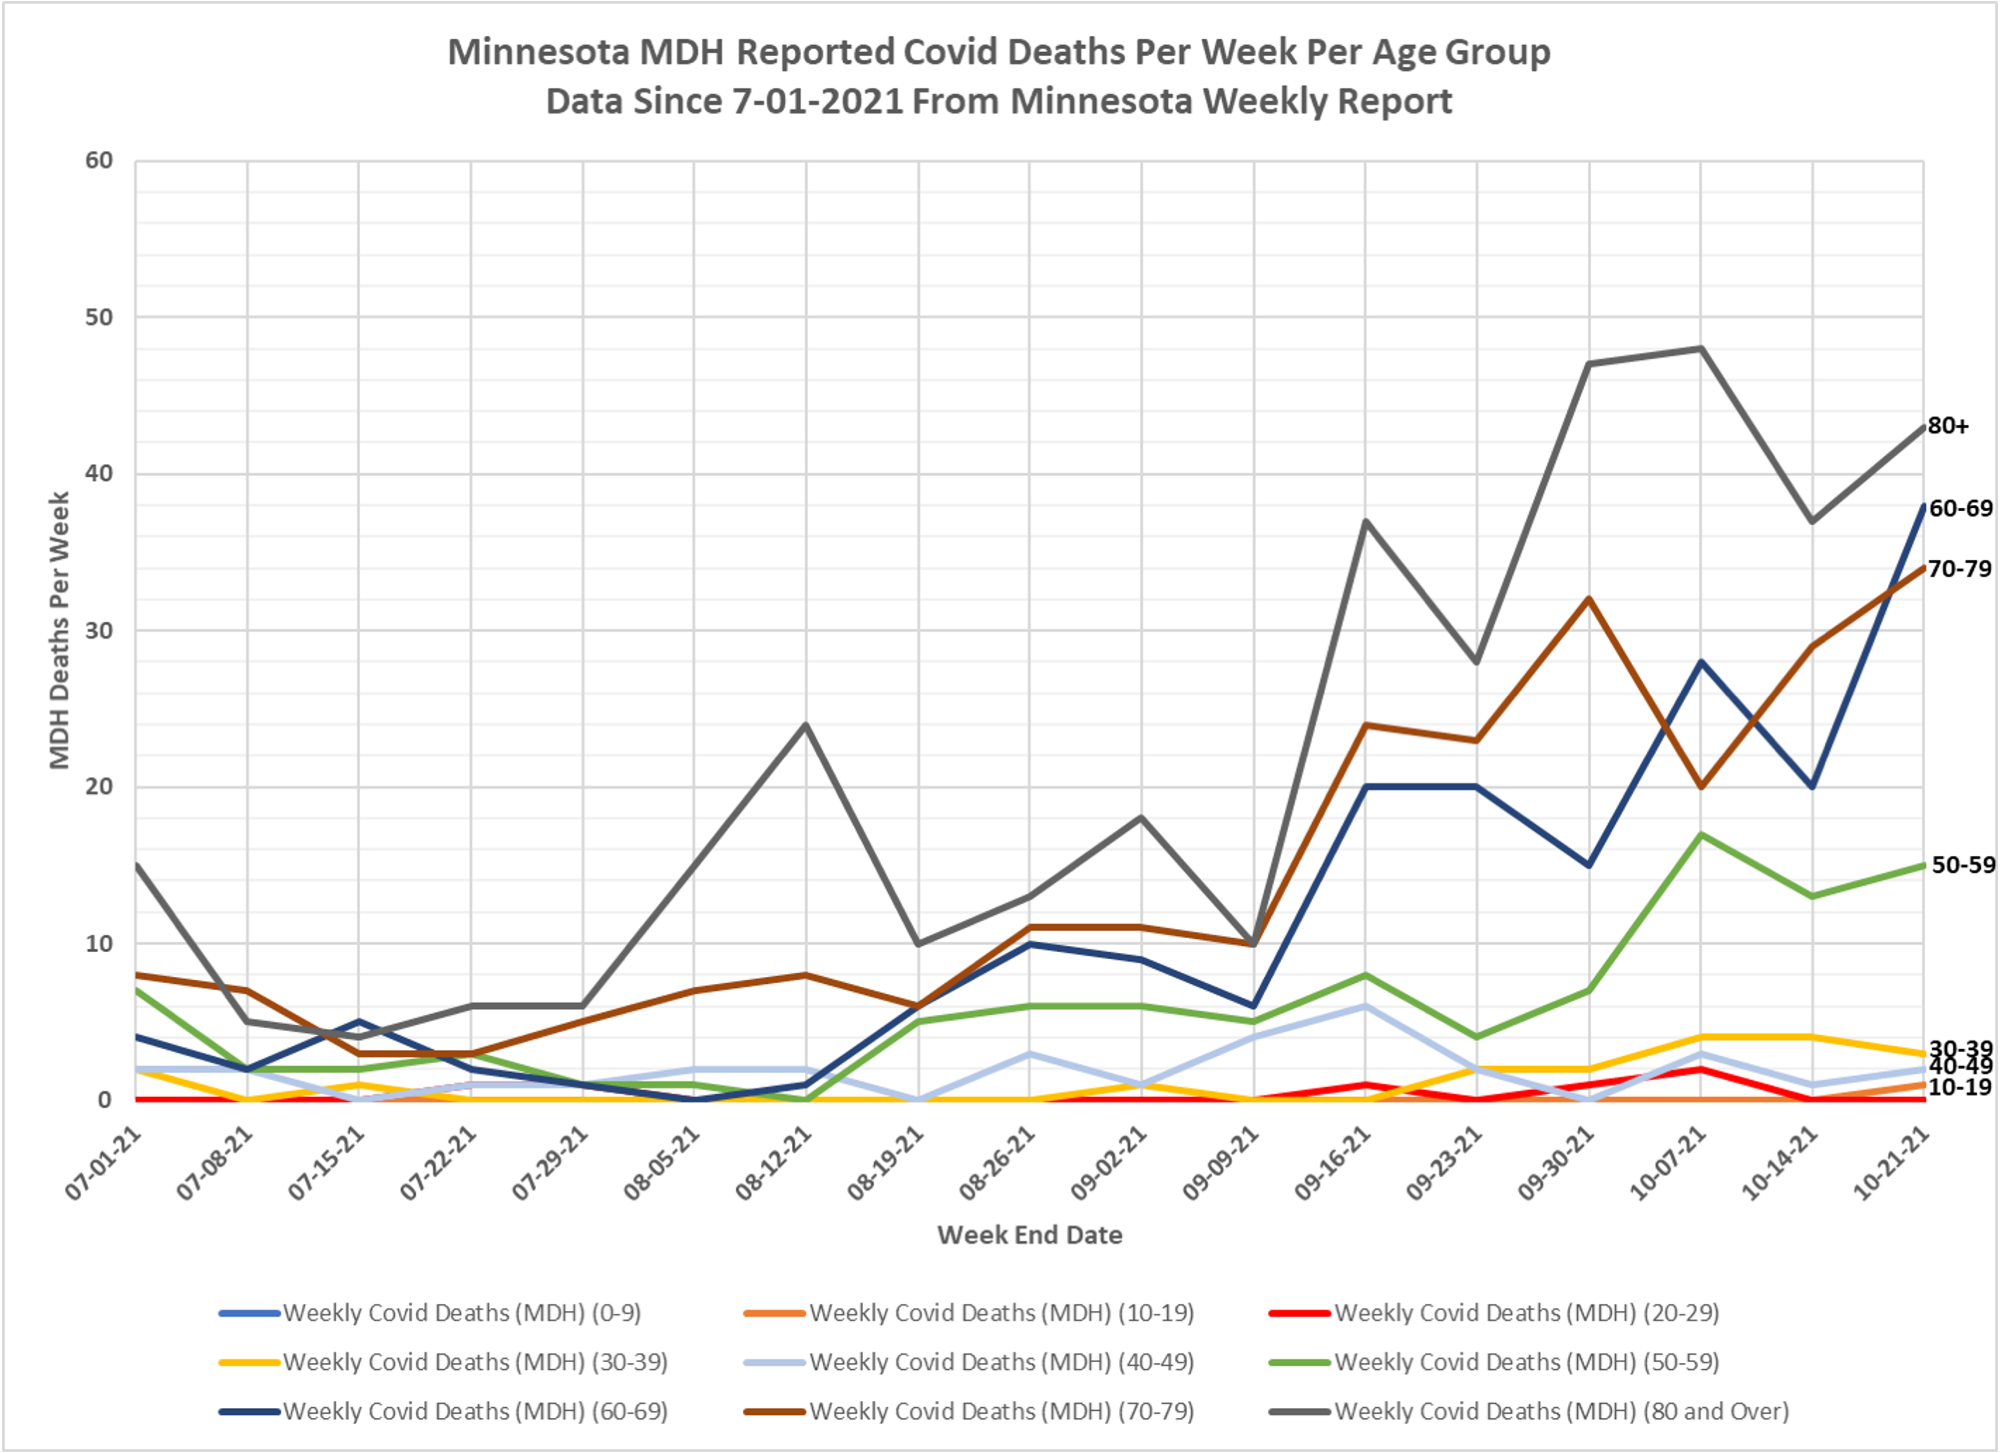
The update look at events by age group. We continue to see no special impact of Delta on younger age groups. We continue to see serious disease mostly in the elderly. The one young death mentioned by Dave below occurred on a day when a non-LTC group residential health facility death was reported and I suspect it was this person. Such residents typically have multiple health issues. Please note most carefully that after being suppressed in the first few weeks after vaccinations began, deaths in the oldest age groups, those with very vax rates, have climbed back up, significantly above where they were in the April period wave. These deaths are substantially among the vaxed, no matter how many lies the Governor tells about that.
Dave Dixon’s comments:
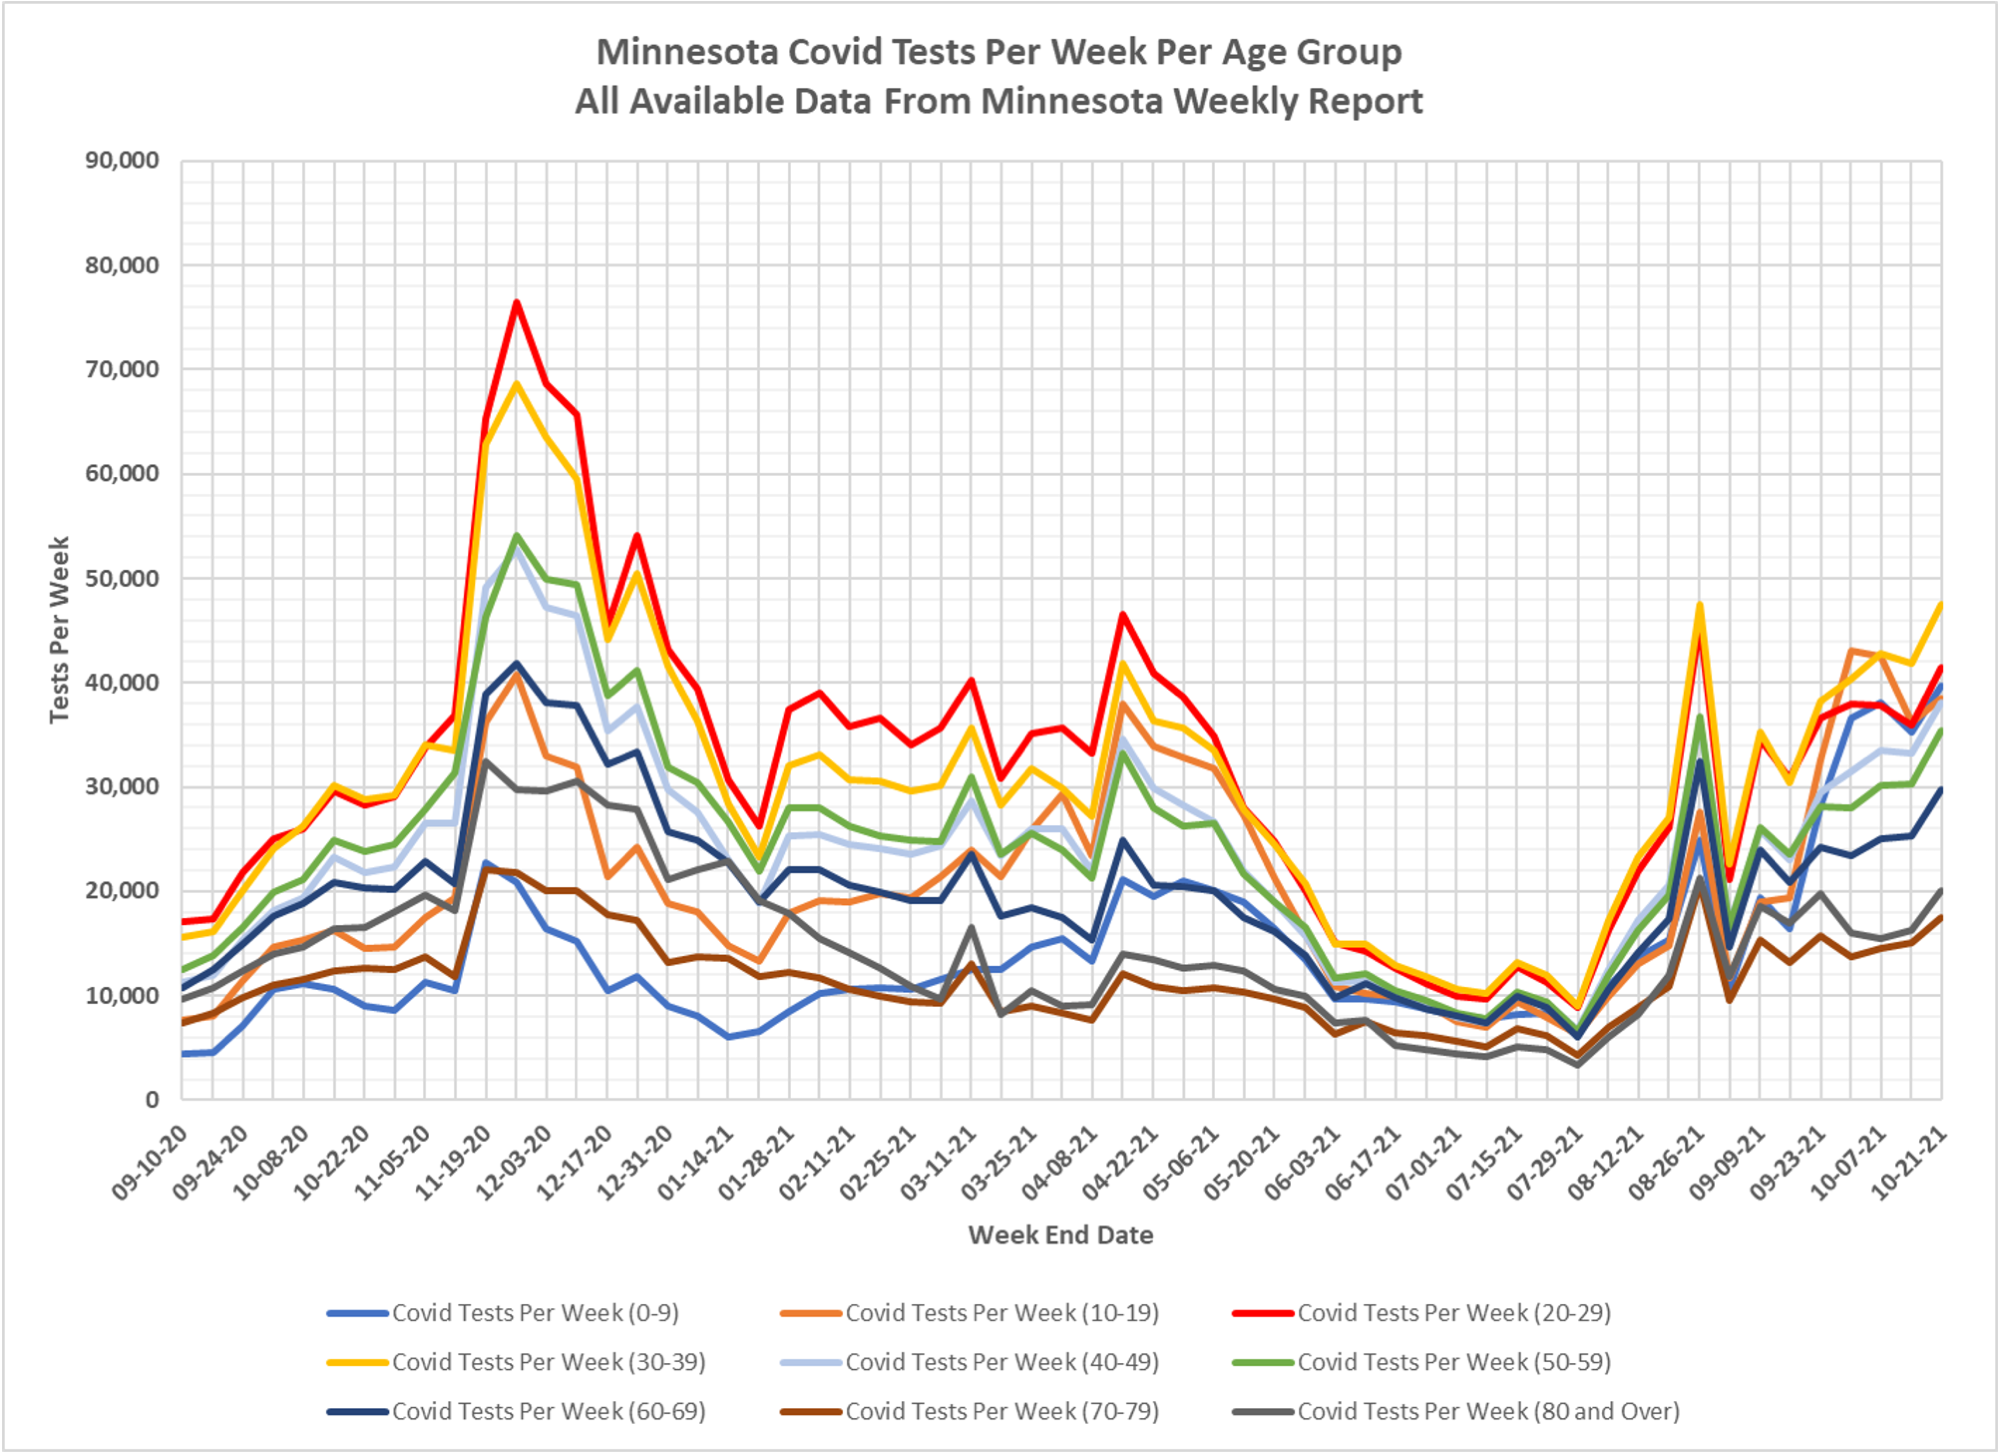
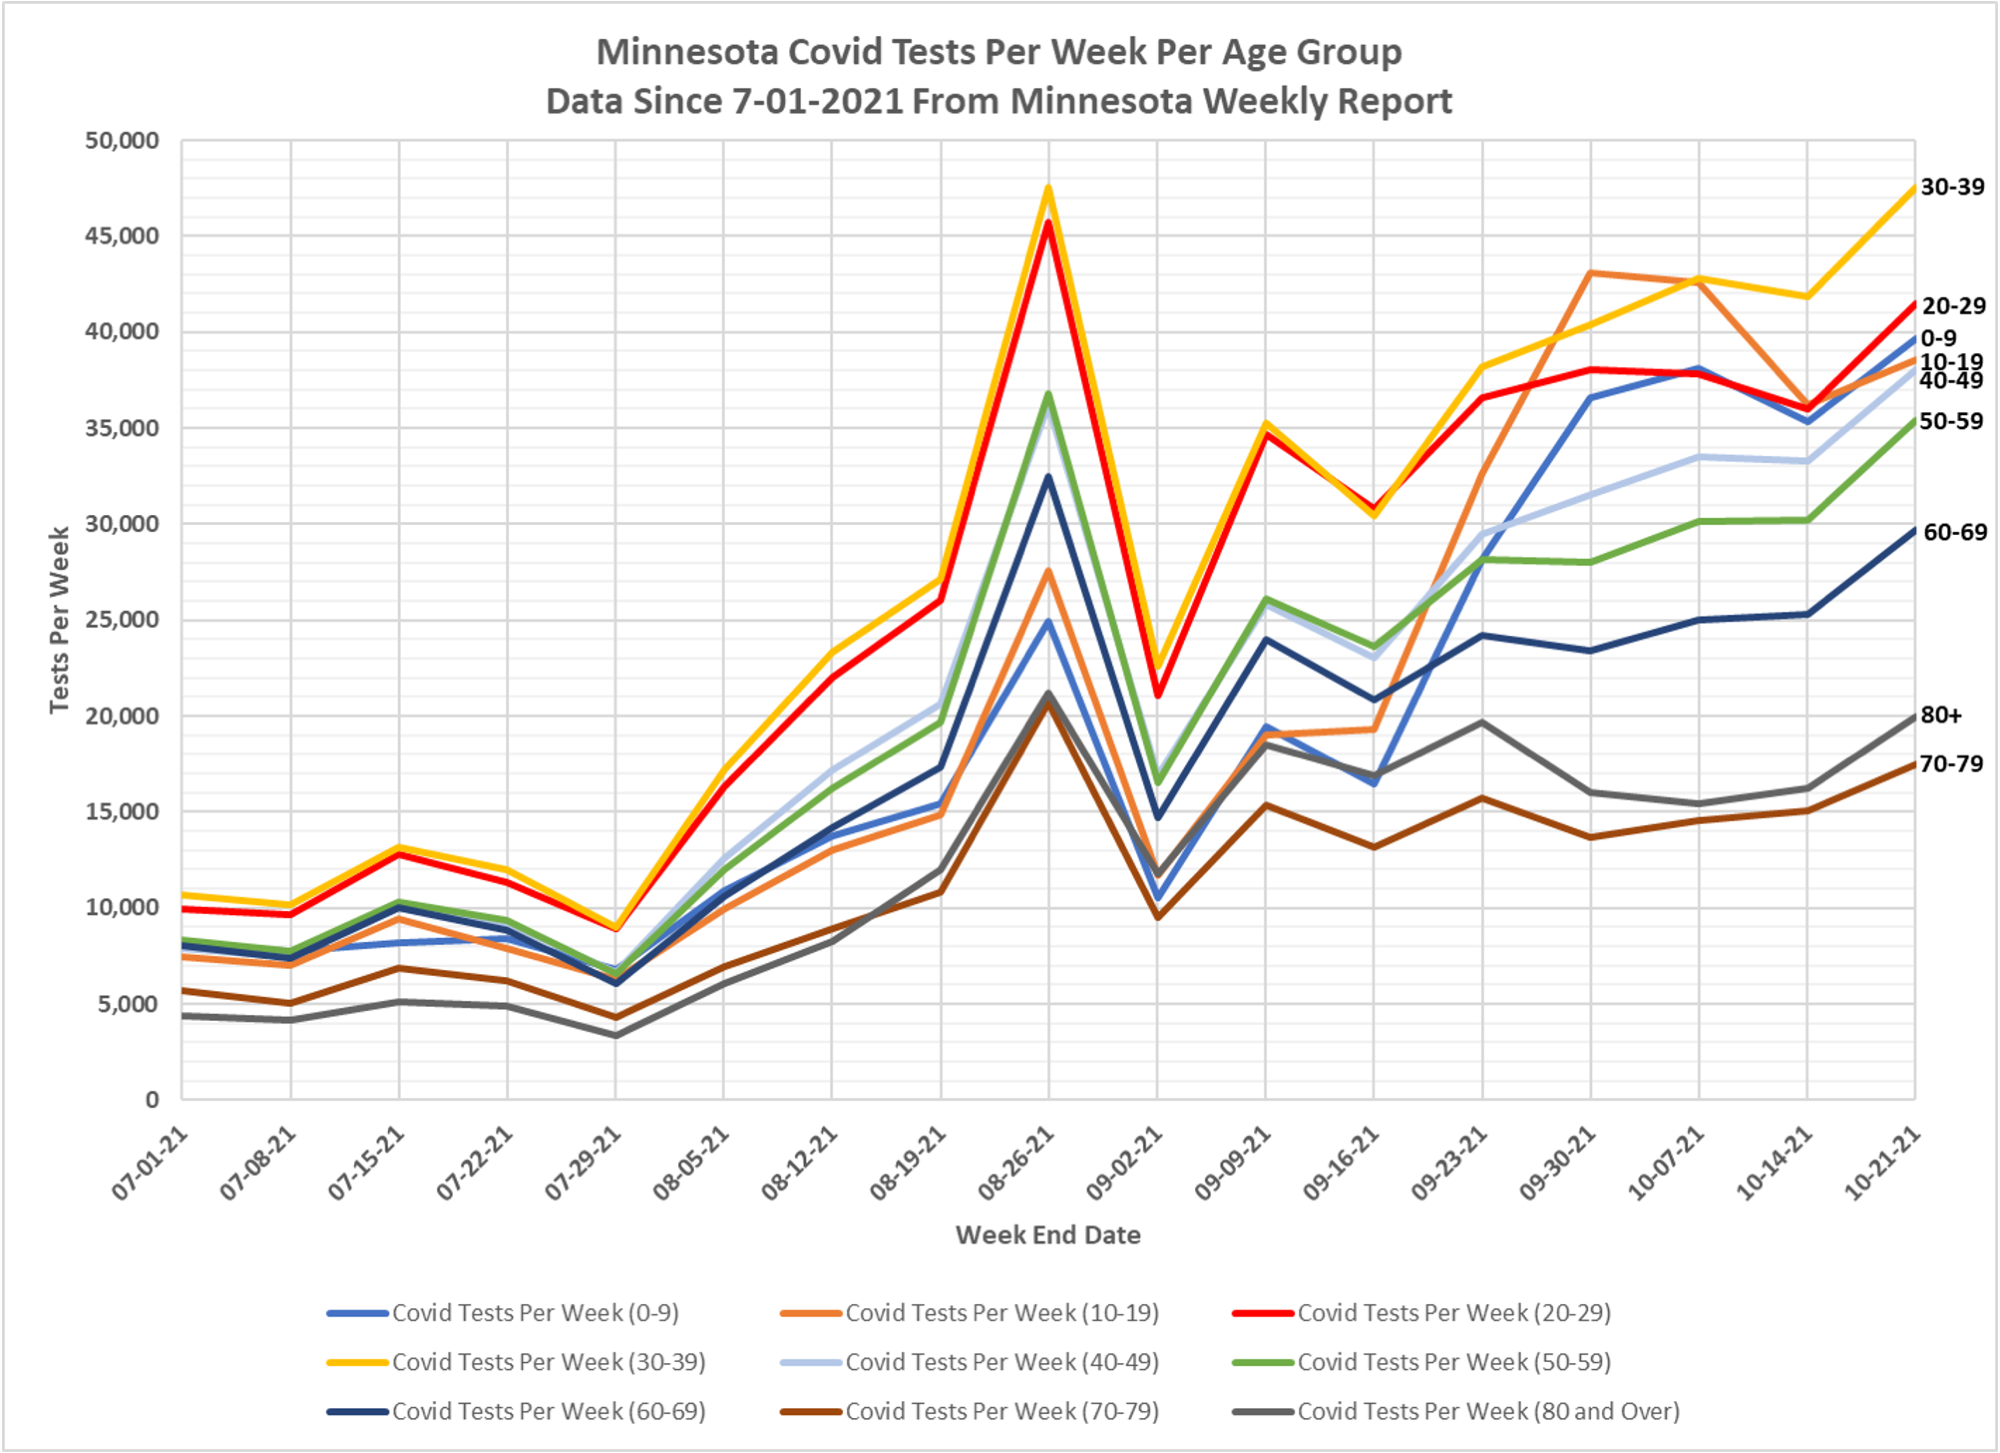
Slide 2, Tests Per Week:
Testing in all age groups was higher this week than the week before.
Total tests for the week were 307,755, vs. 269,424 the week before, an increase of 14.2%.
Increases in testing of school age kids appears to be roughly equivalent to the increase in the other age groups.
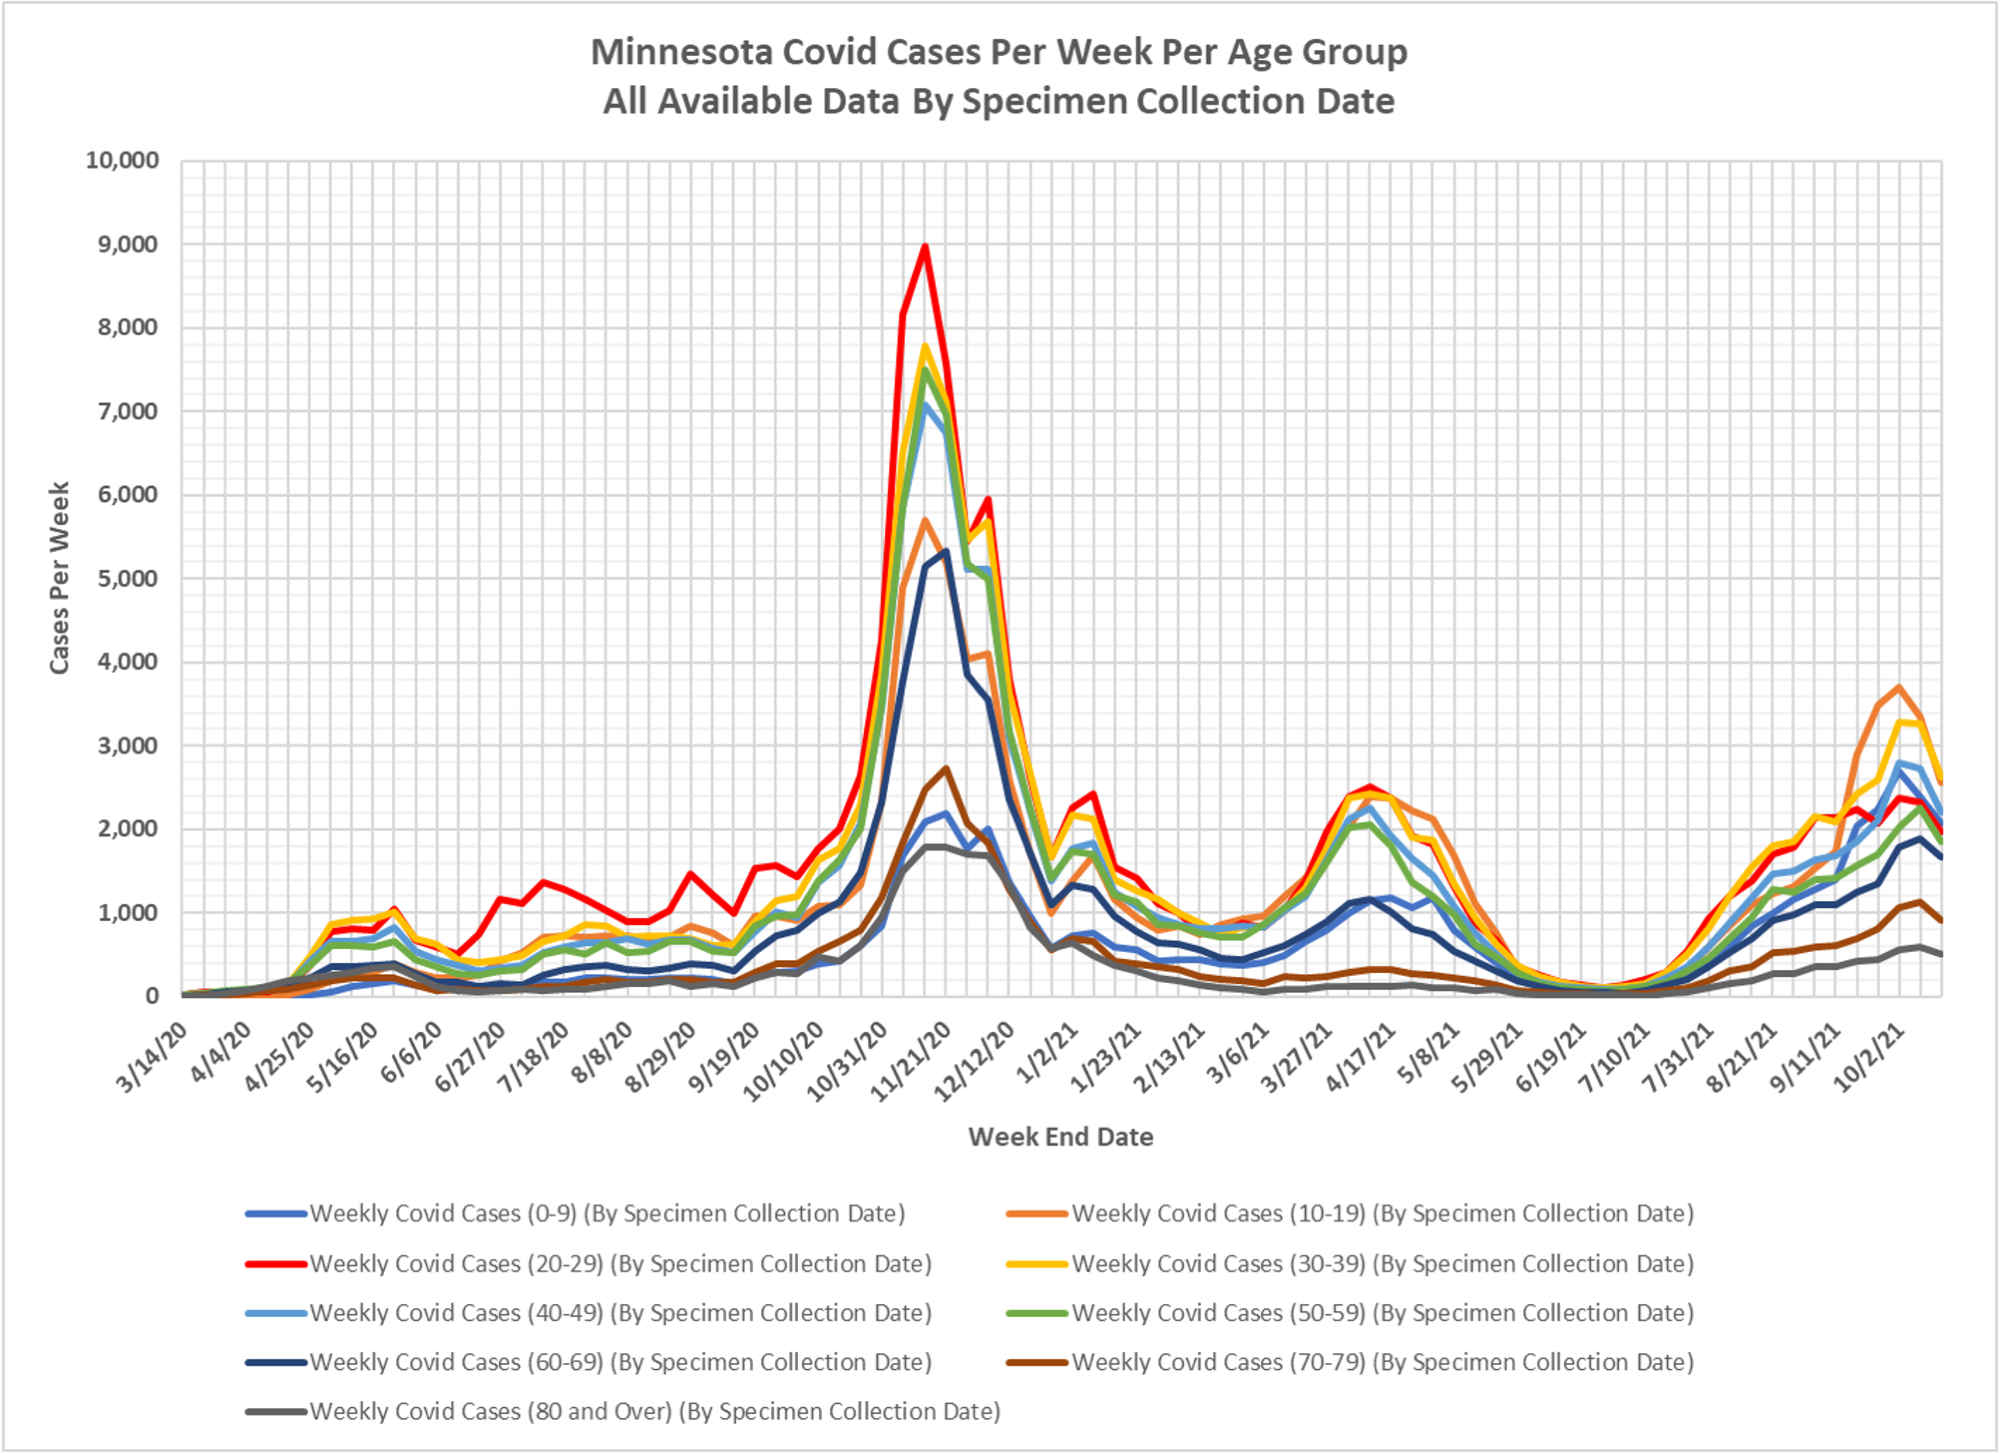
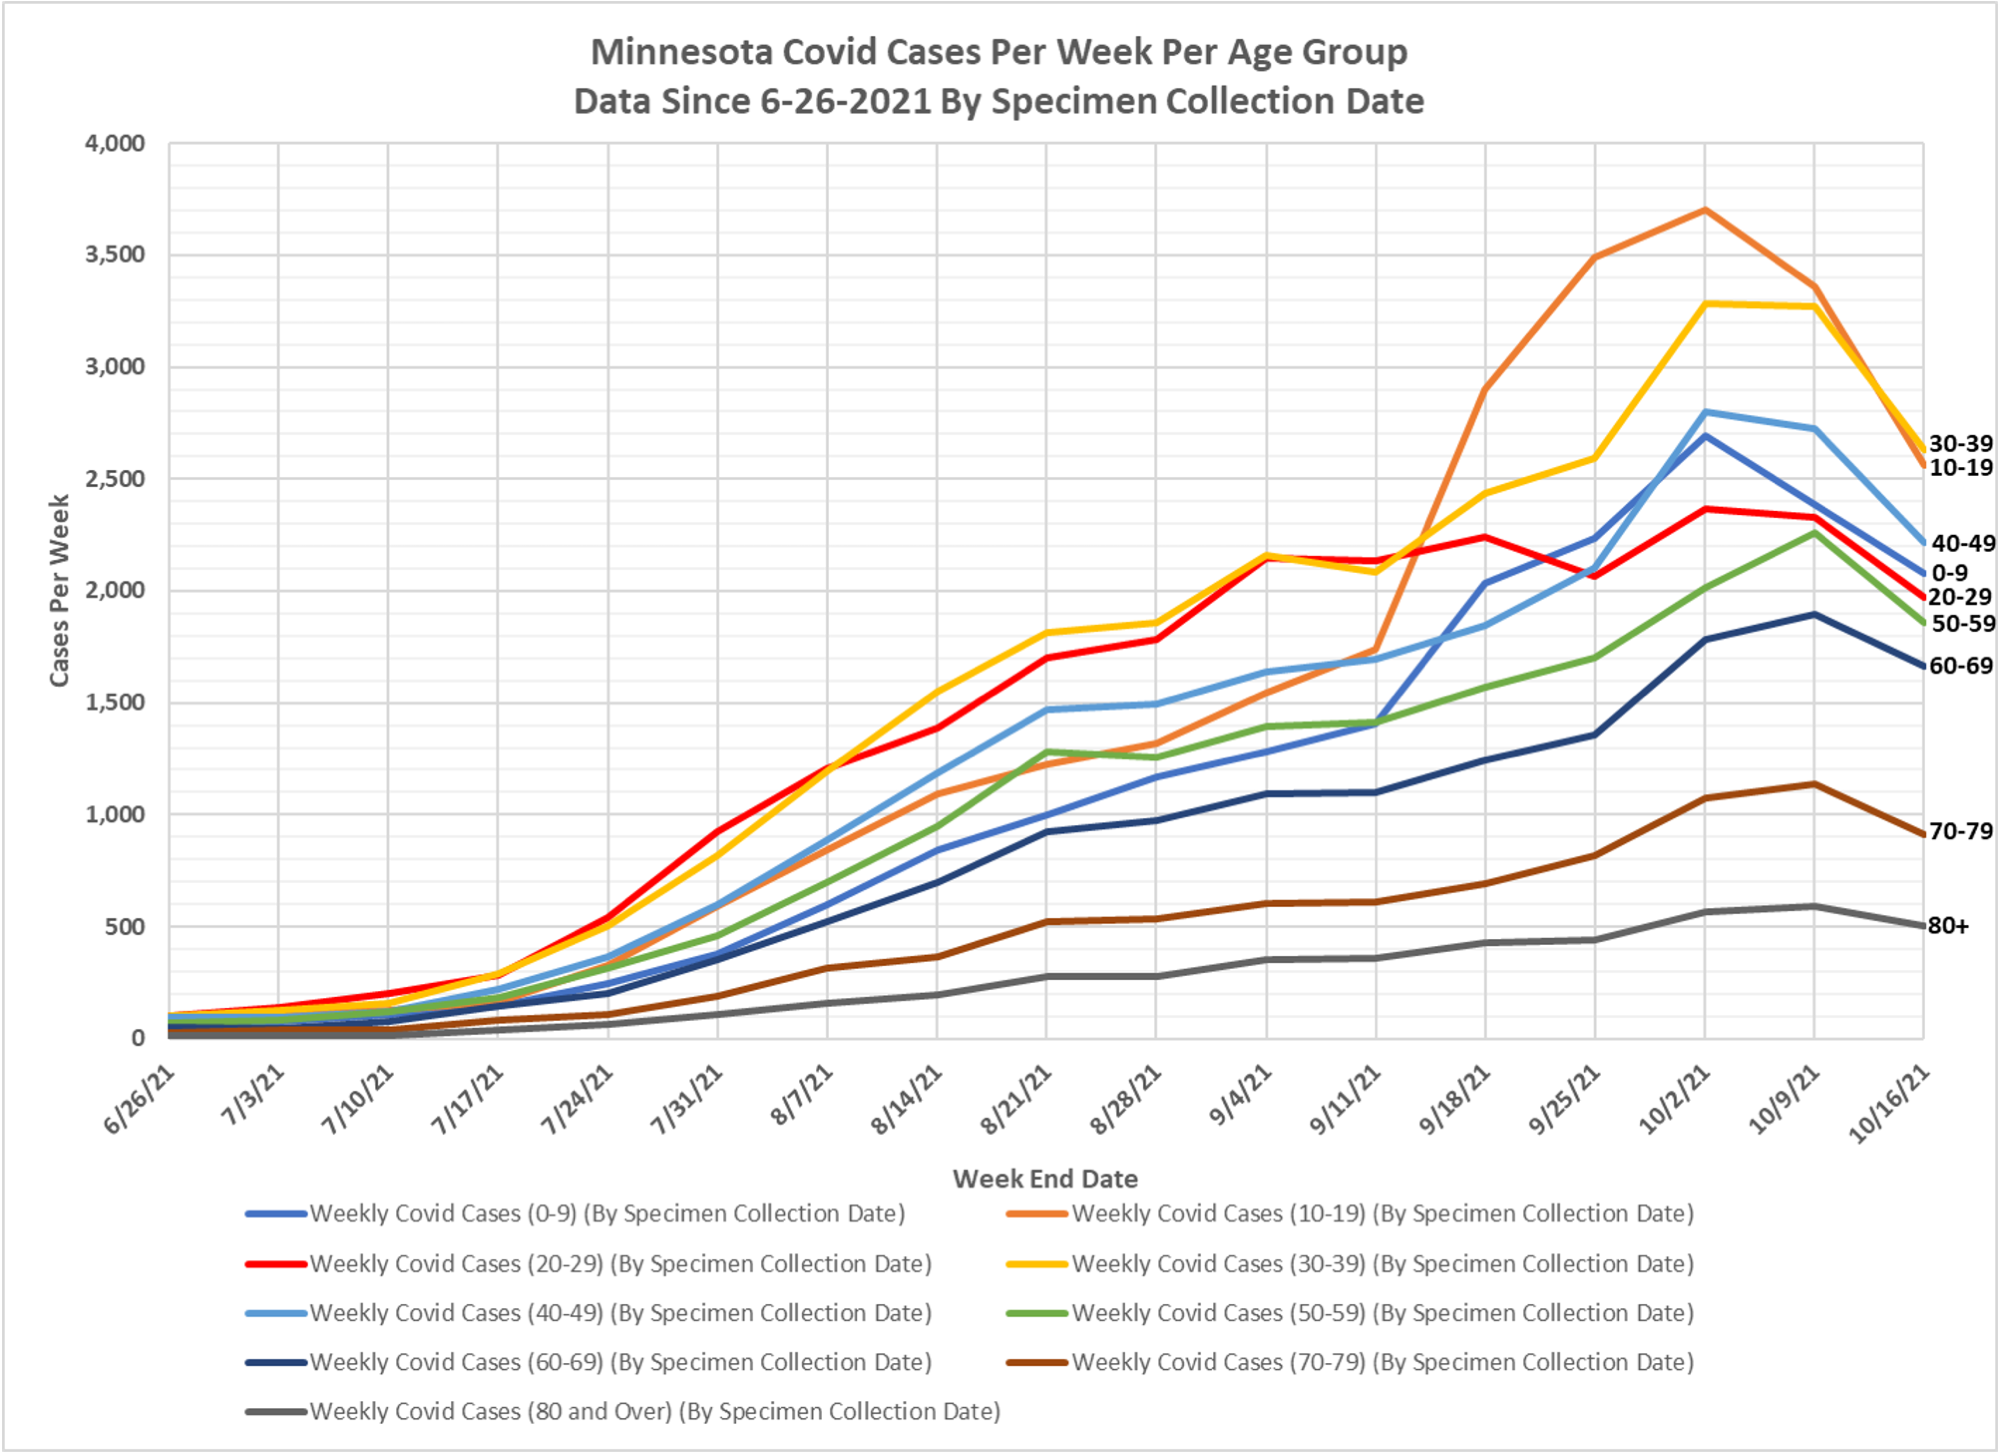
Slide 4, Cases Per Week:
Despite the increased testing this week, Covid cases in all age groups were lower. The 80+ was slightly lower and all other groups were sharply lower.
Covid cases for the week were 16,051, vs. 20,057 the week before, a decrease of 20%.
It increasingly looks like the current surge in cases has peaked in Minnesota on October 4 (on a 7 day running average basis).
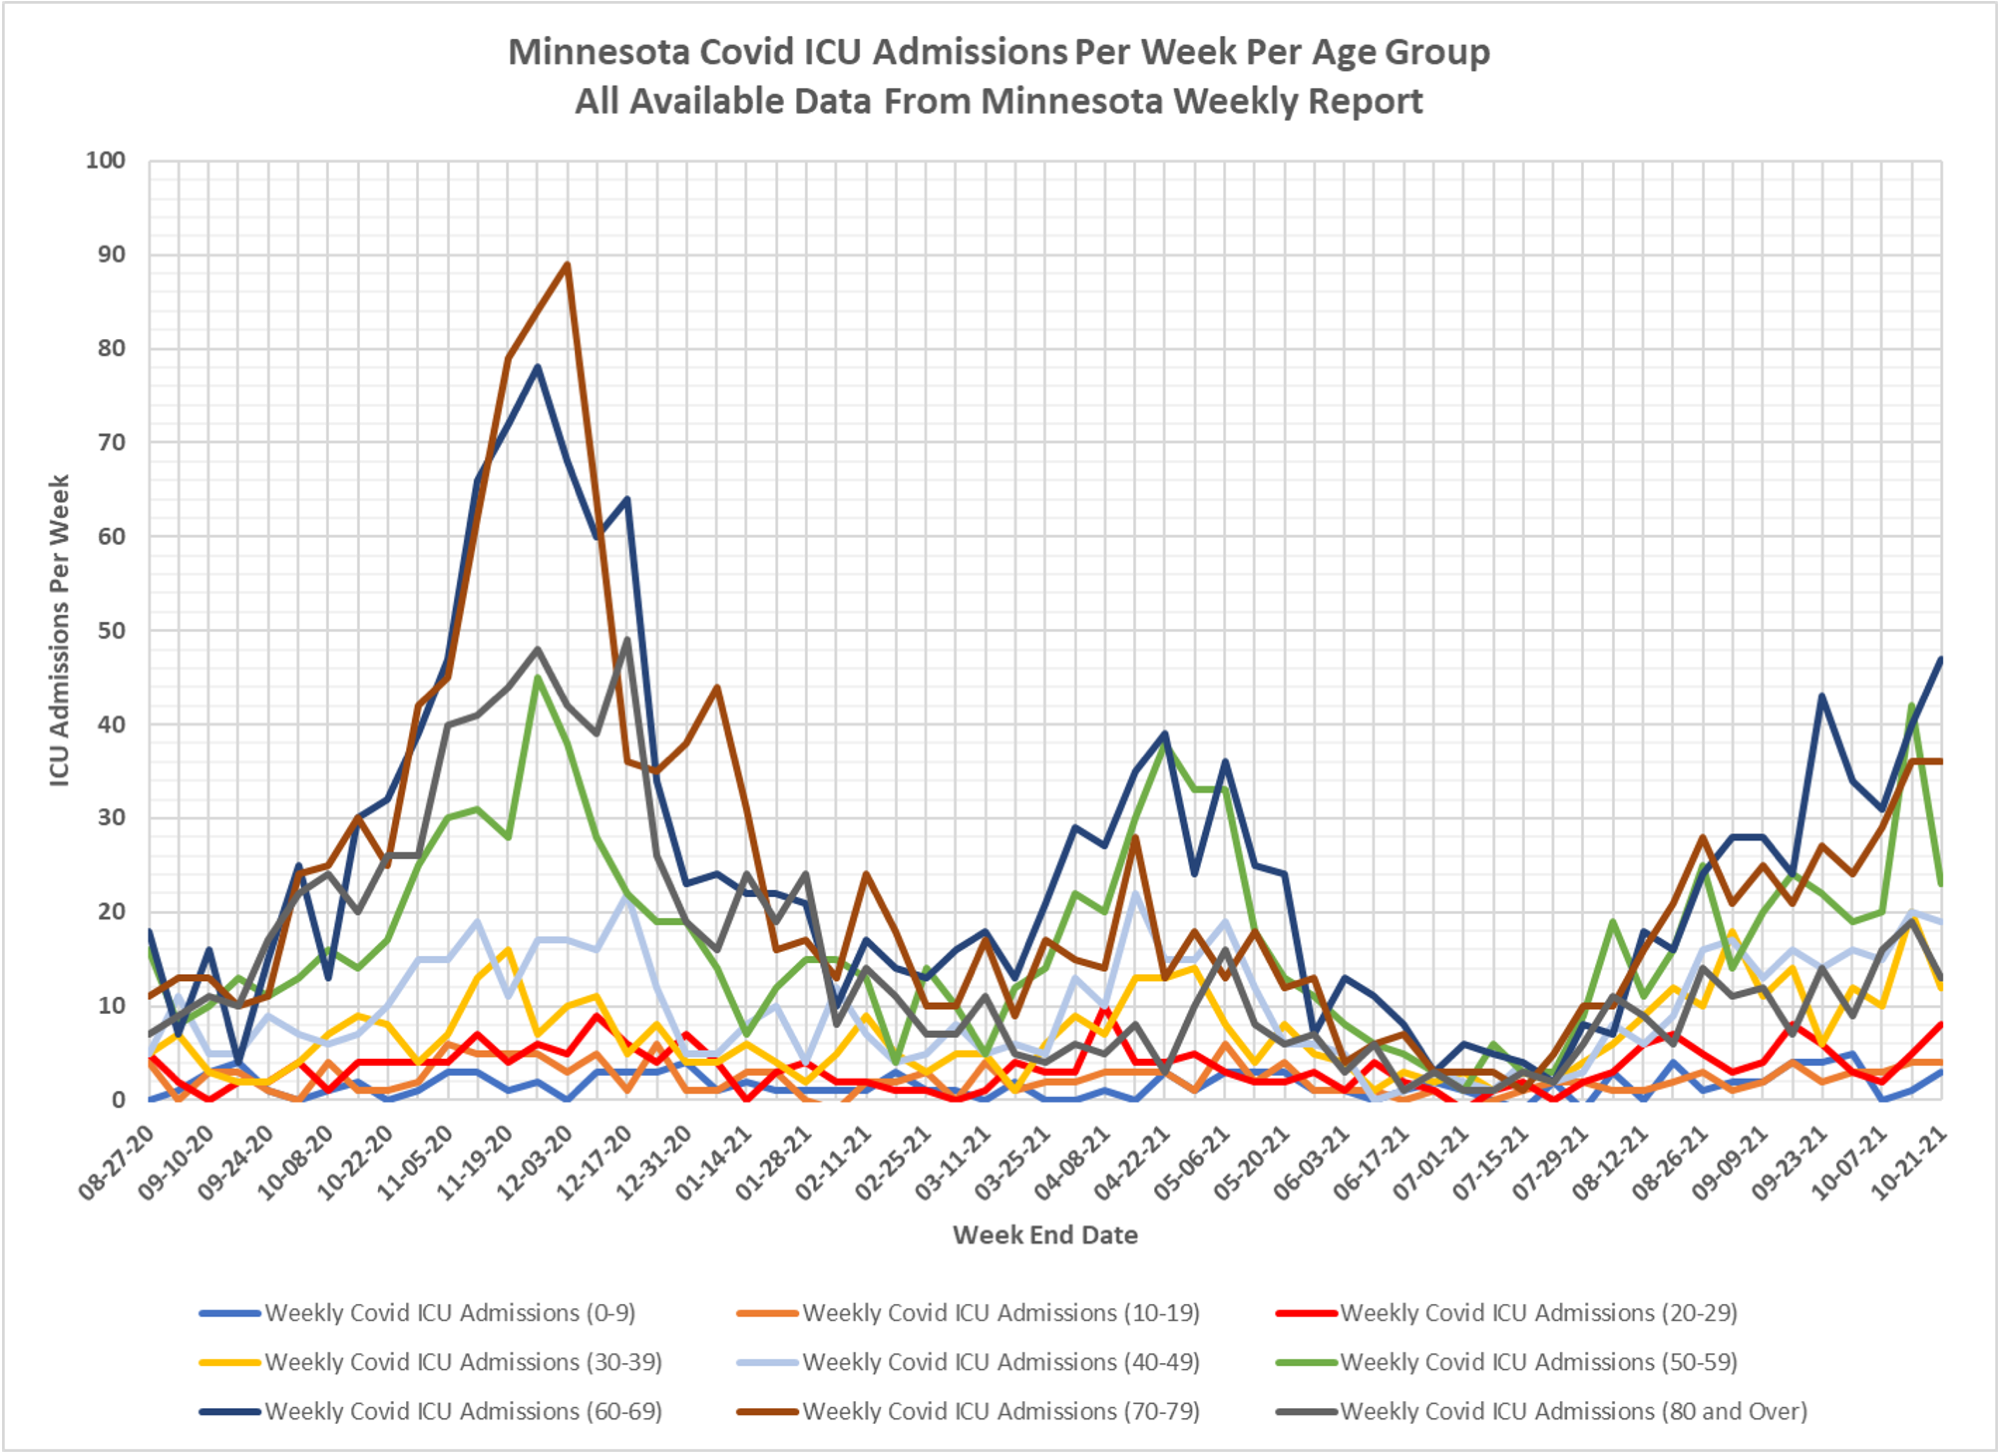
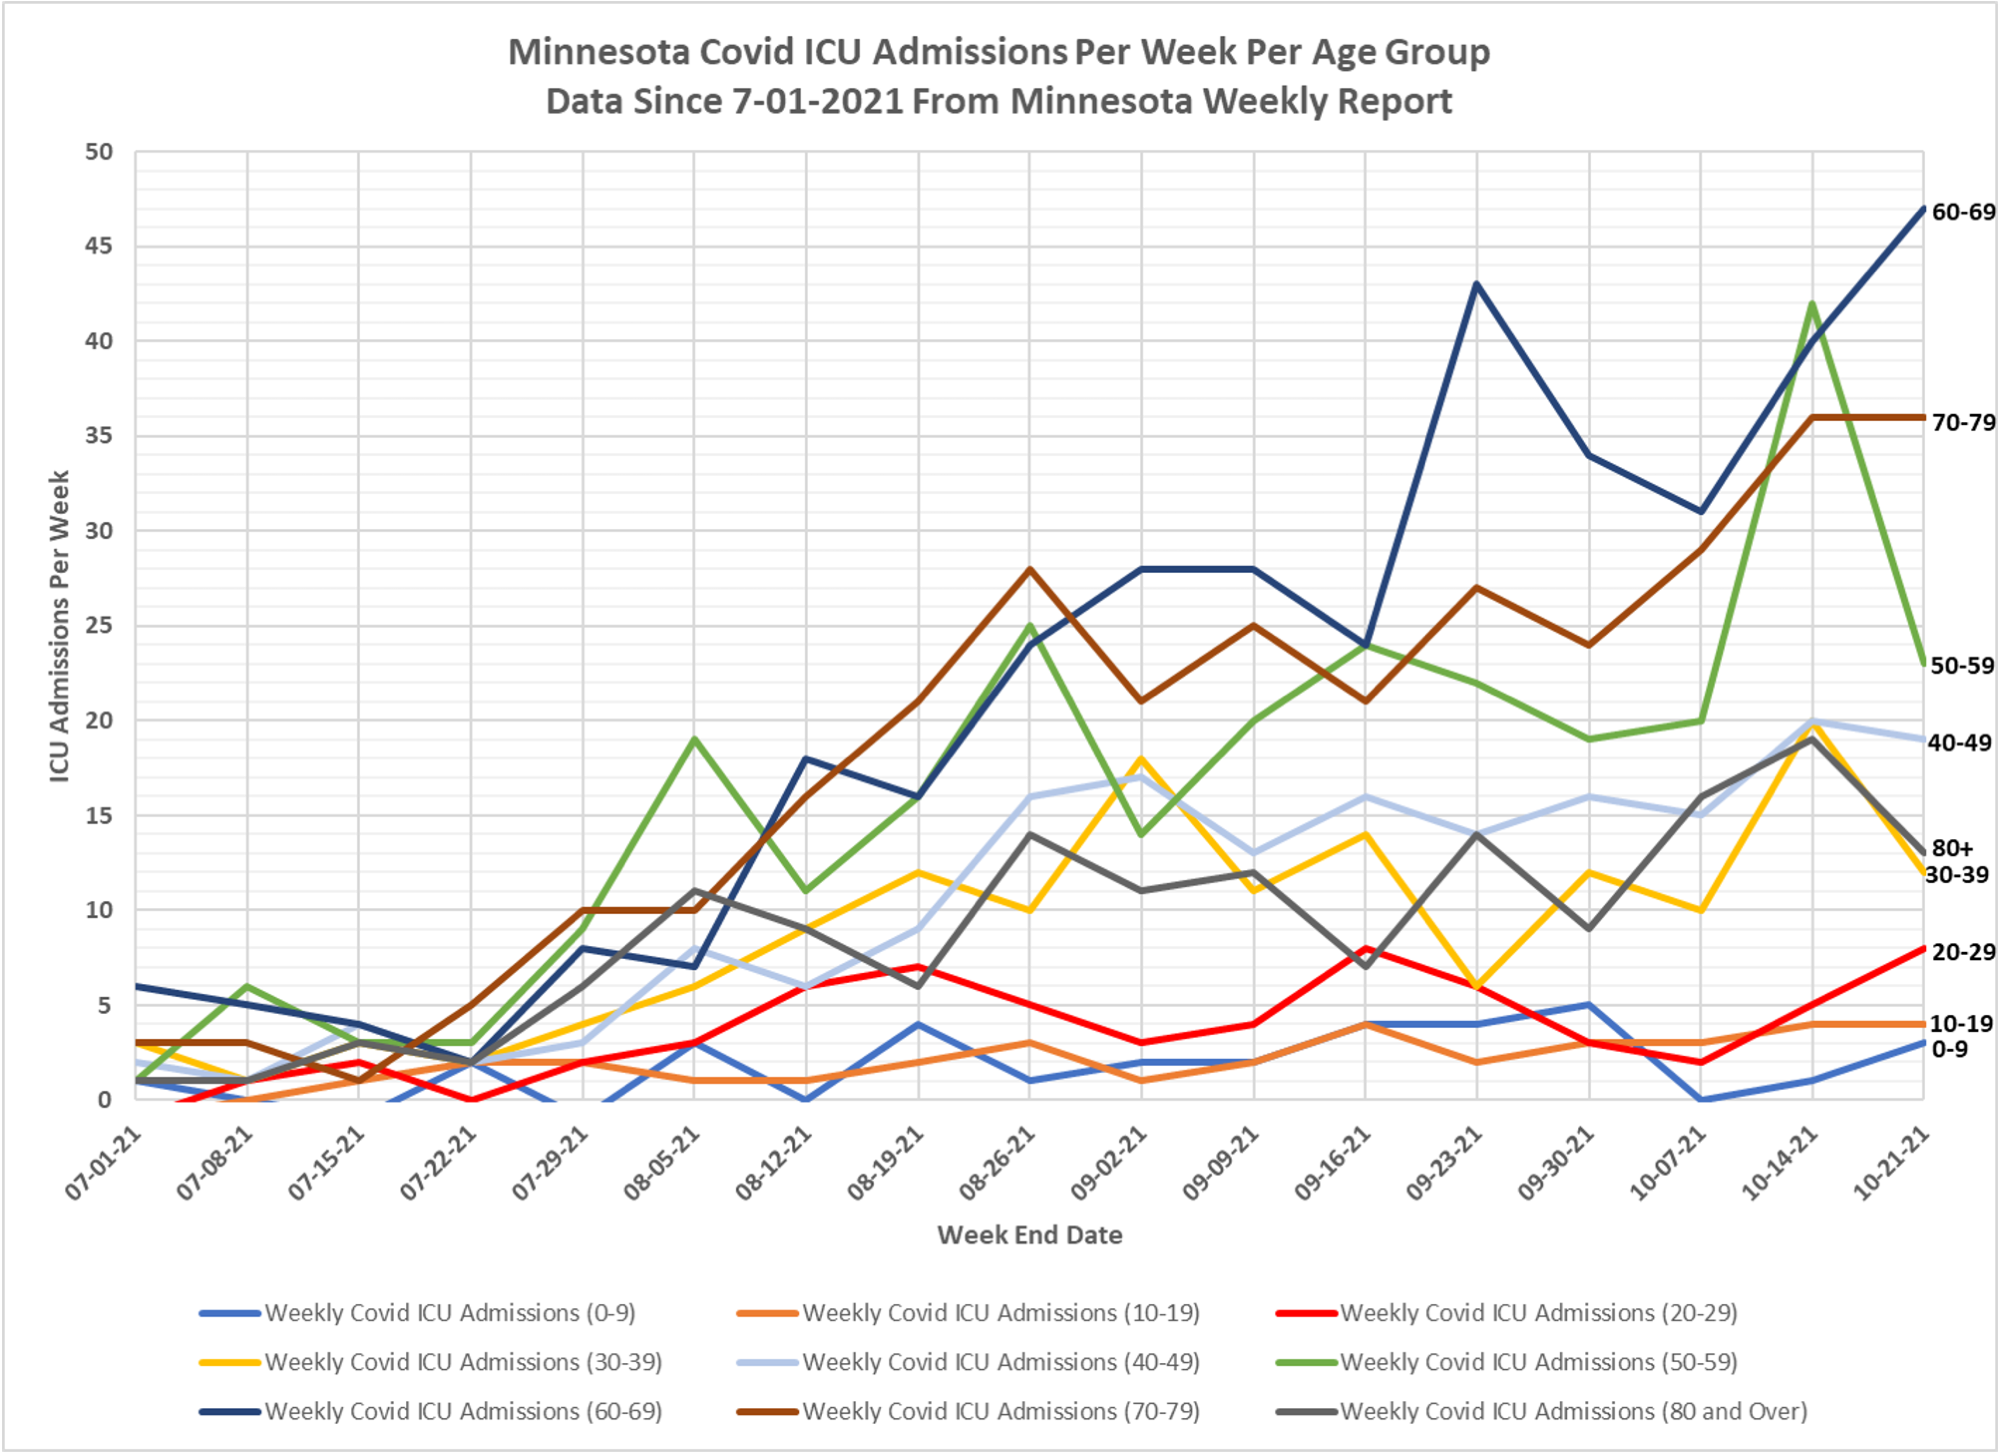
Slide 6, ICU Admissions Per Week:
ICU admissions in the 0-9 age group increased from 1 to 3 for the week, the 10-19 age group was level at 4 admissions, and the 20-29 age group increased from 5 to 8. These admissions were in line with the typical range in the last 2 months.
The ICU admissions for the 30-39, 40-49, and 80+ age groups were all lower for the week, with values between 13 and 19.
The 50-59 age group dropped markedly after more than doubling last week.
The 60-69 age group rose again (from 40 to 47 admissions) and 70-79 age group was flat at 36 ICU admissions.
The total ICU admissions for all ages decreased from 187 last week to 165 this week.
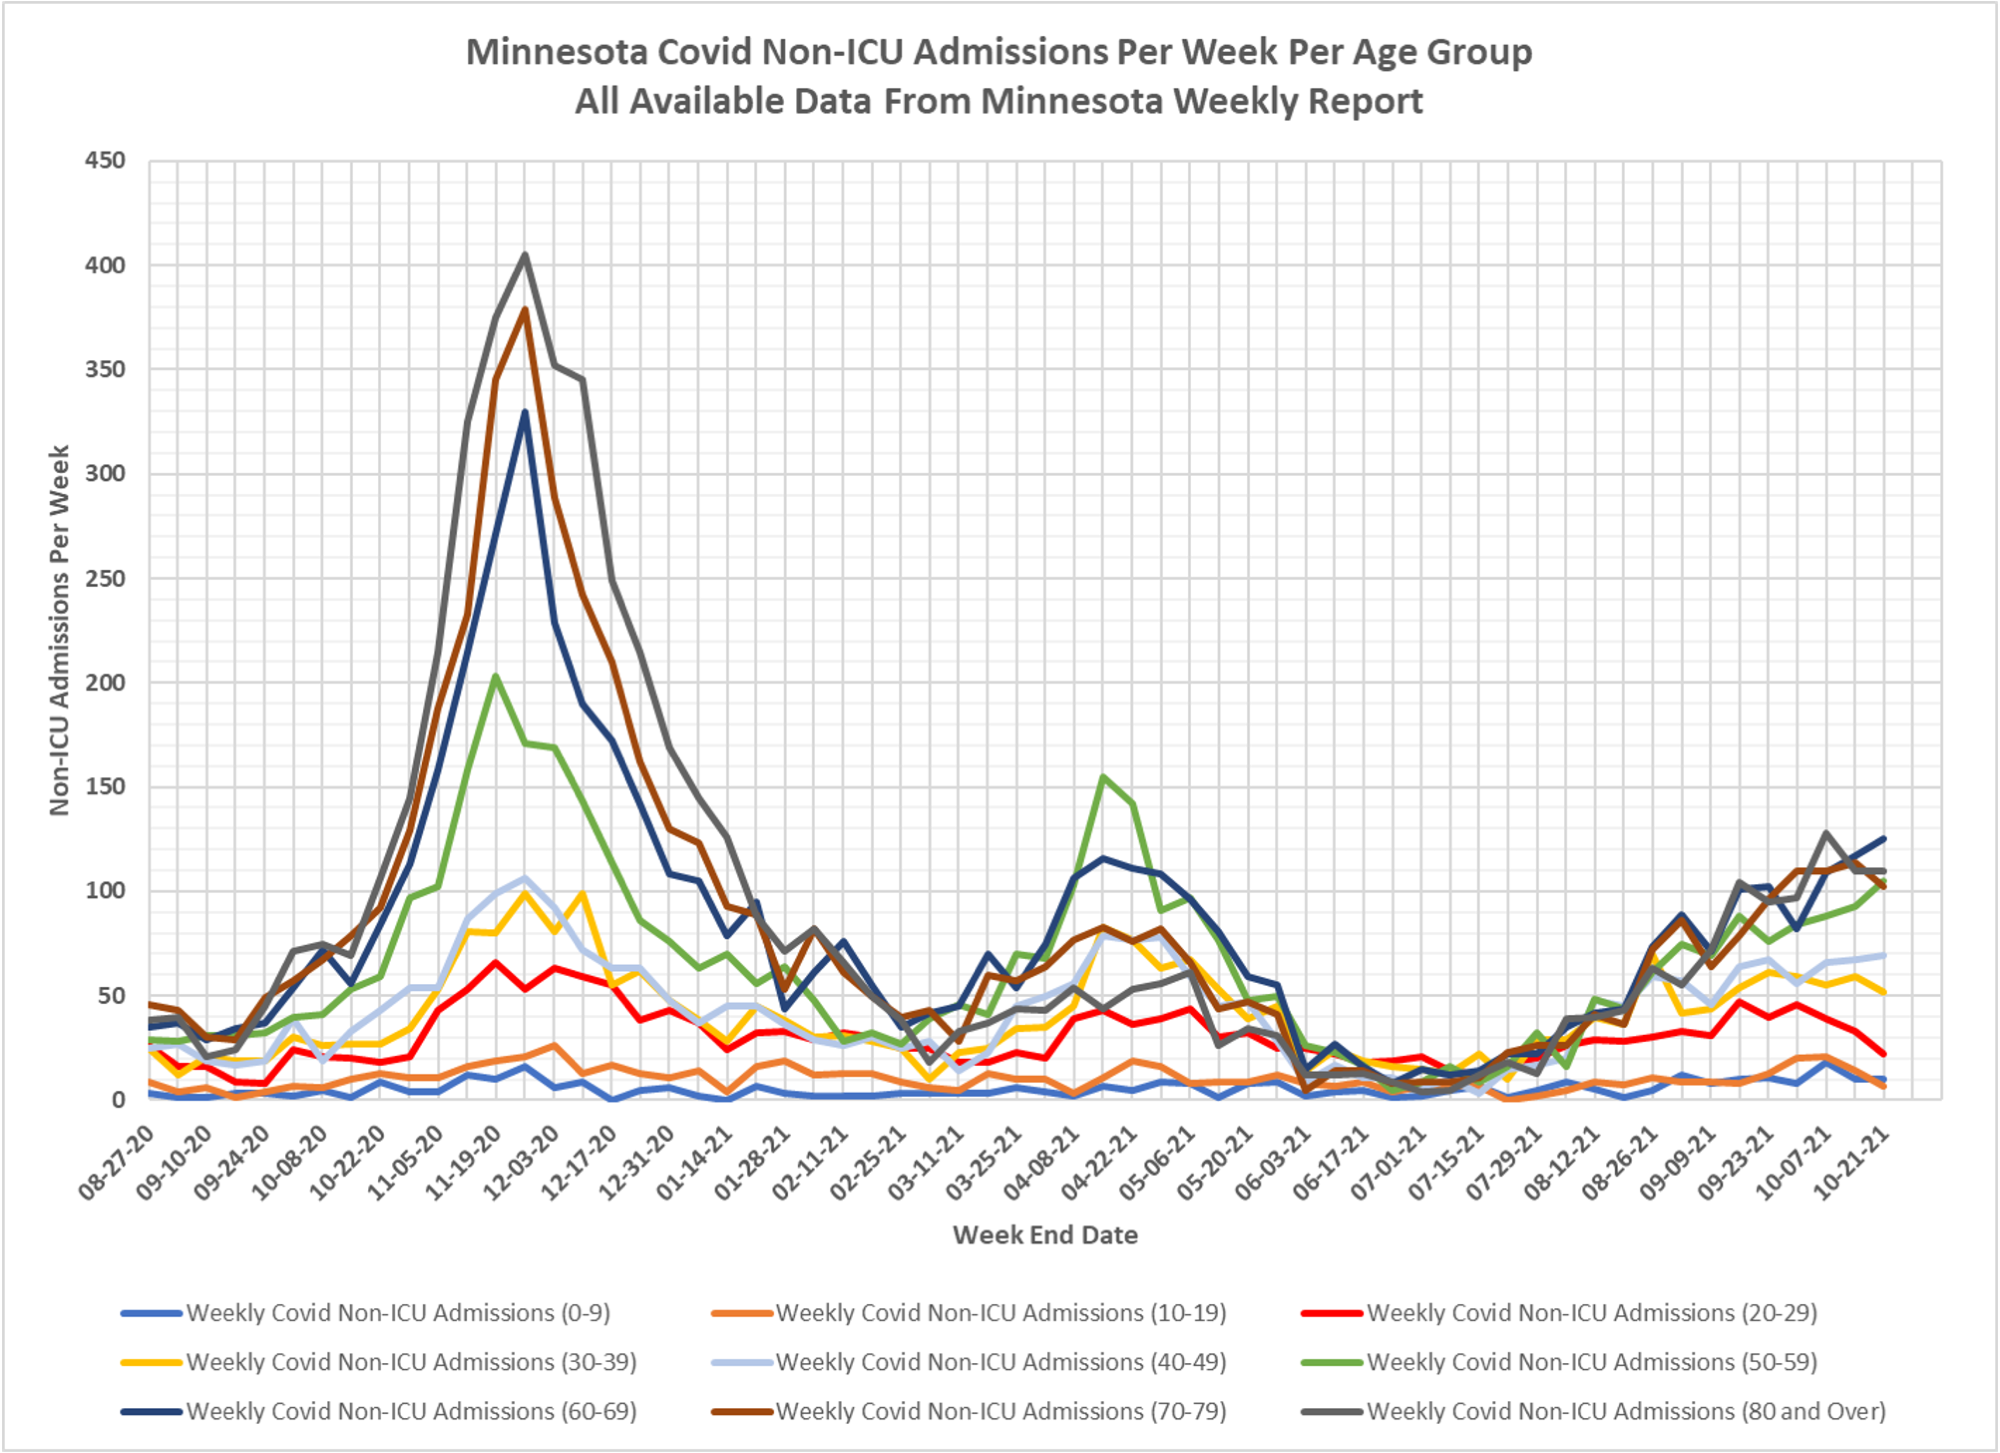
Slide 8, Non-ICU Admissions Per Week:
The 0-9 age group was unchanged at 10 admissions, while the 10-19 age group (7 admissions), 20-29 age group (22 admissions), and 30-39 age group (52 admissions) were lower than the week before.
The 50-59 and 60-69 age groups were all higher week over week, while the 70-79 age group was lower and the 80+ age group was unchanged..
The total Non-ICU admissions for all ages decreased slightly from 617 last week to 602 this week, the second week in a row in which Non-ICU admissions declined.
Slide 10, Reported Deaths Per Week:
One death was reported in the 10-19 age group. I do not recall seeing any news coverage, so I am unaware of any special circumstances.
There were 3 deaths in the 30-39 and 2 death in the 40-49 age groups reported.
All age groups 50-59 and older had more deaths last week than the week before.
Reported deaths for ages totaled 136 last week, the highest since the tail end of last winter’s surge in covid (excluding the March 8 data dump).