Okay after the DOH finally figured out how to read and write, here is Dave Dixon’s chart on the breakthrough event reporting over the weeks, updated for this week. The state really has to improve on this. You will note that 100% of the WOW increase in cases is in the vaxed. Good growth in hospitalizations, although kind of odd that the same number is added to two consecutive weeks. And a few deaths. The DOH has promised us more detail this week, but I am guessing it will be slanted to support their messaging. We need an audit.
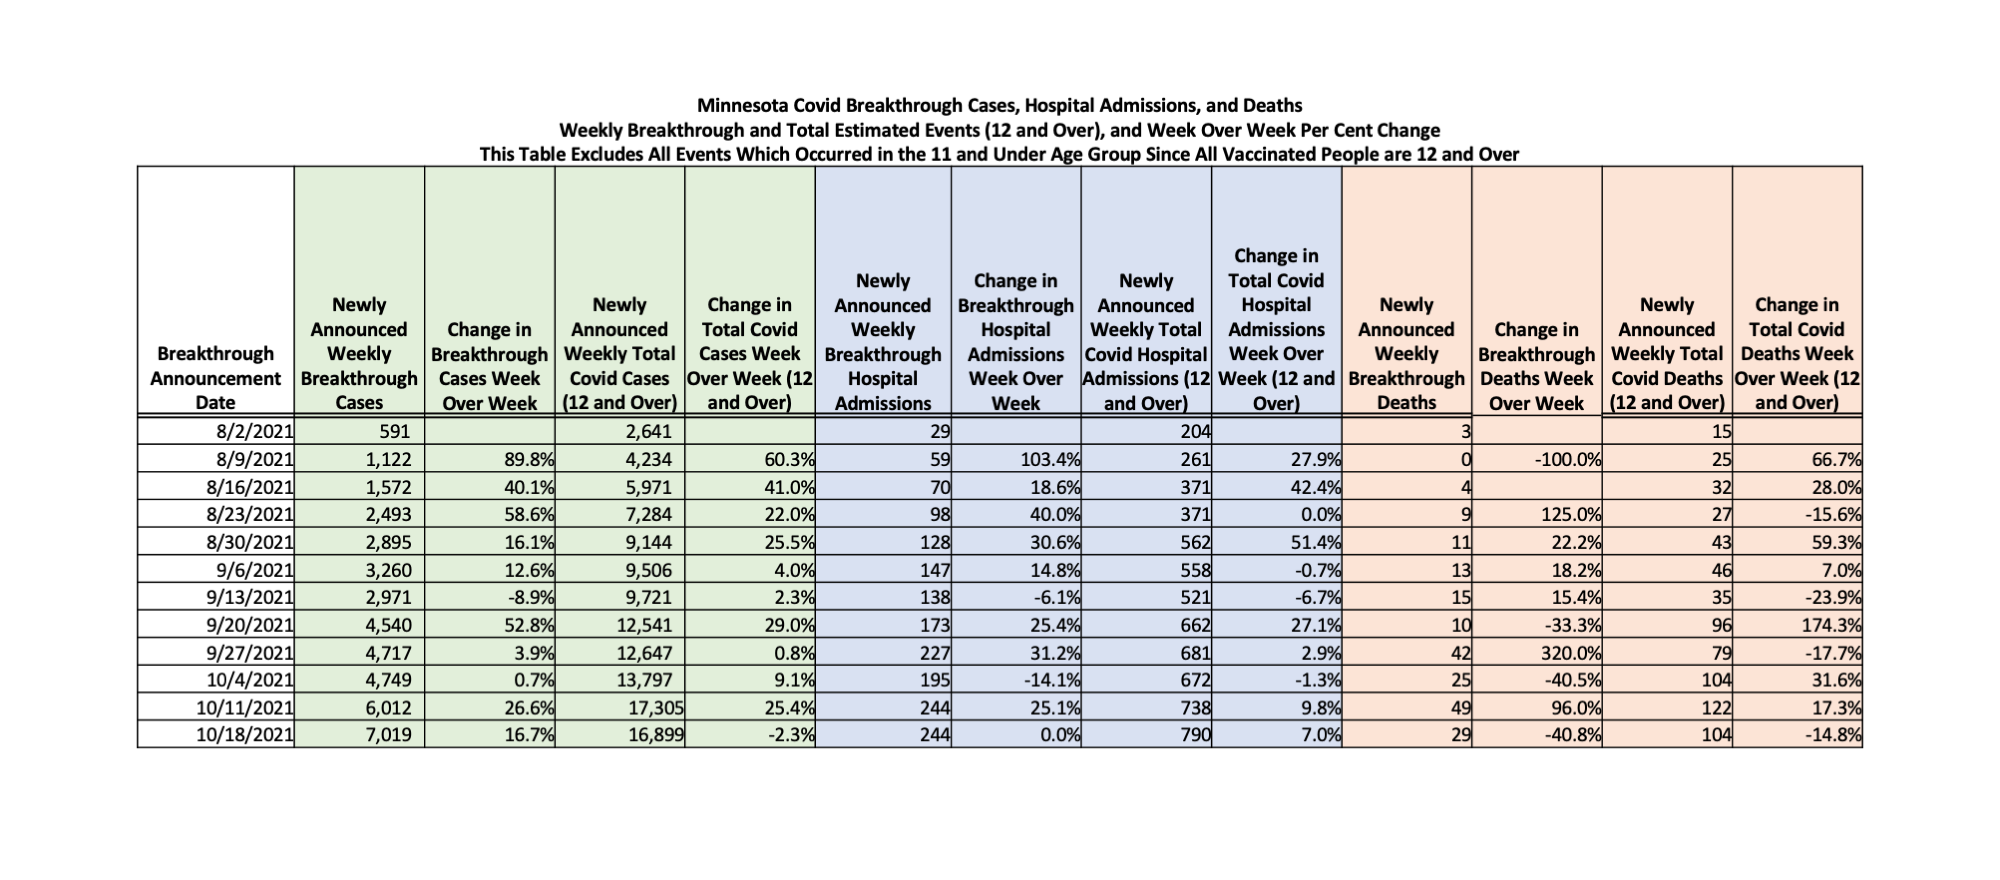

“Good growth in hospitalizations, although kind of odd that the same number is added to two consecutive weeks.”
I have noticed sequences of “same number added” or “recurring patterns” in the Daily ICU Admissions stats also. I’ve always felt that someone was just making up numbers when they had report deadlines to meet. Yes, with small data sets, number repetition is more common. Still, it just never looked right to me.
Some examples follow – and these are consecutive day numbers:
13-11-11-11-12-12
21-20-15-15-18-17-17
12-12-16-16-11-6-11
8-10-8-8-8-7-9-8
11-8-8-10-9-9-8
13-13-17-16-16
18-16-16-18-13-11-16-16
14-21-21-14-22-14
I will say in a sequence like the one you note, with a low range of possible values, you are pretty likely to see repeats frequently
Kevin I would like to see you breakdown the states numbers here https://bringmethenews.com/minnesota-news/new-charts-from-the-minnesota-department-of-health-compare-rates-of-covid-19-infection-hospitalization-and-death-based-on-vaccine-status.
They say you are 30 times more likely to die unvaccinated but it seems to me that vaccinated have somewhere around 25-40% of deaths at this point. Is this where they adjust for age somehow?
We are working on it, just posted some initial general observations. Dave Dixon thinks he is close to making the data meaningful and we will publish charts and tables as soon as we feel pretty good about it.