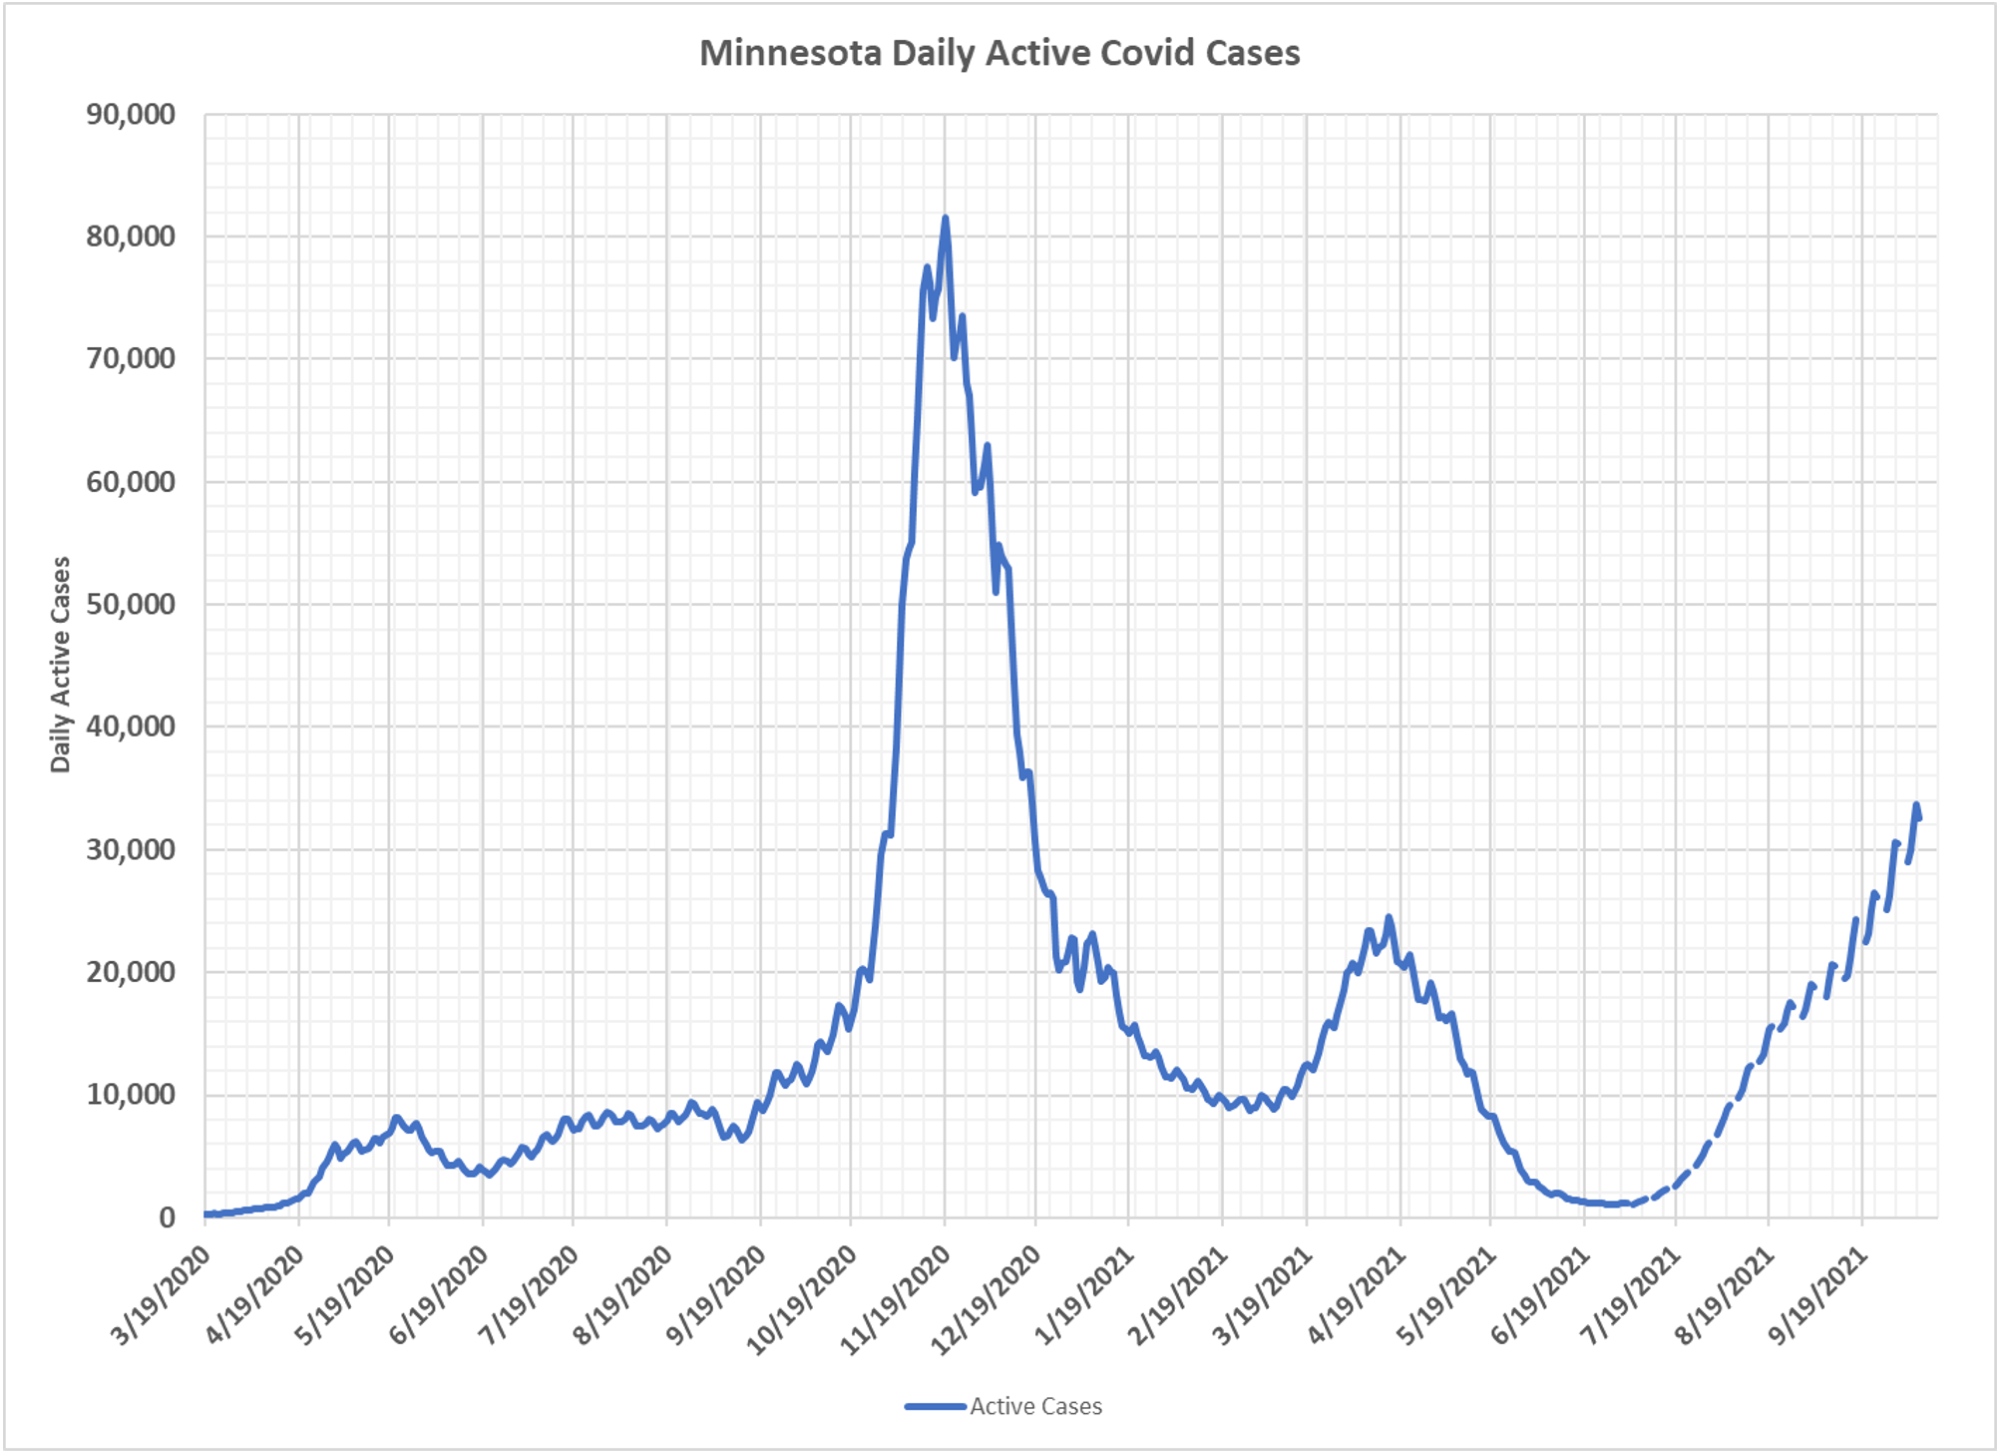
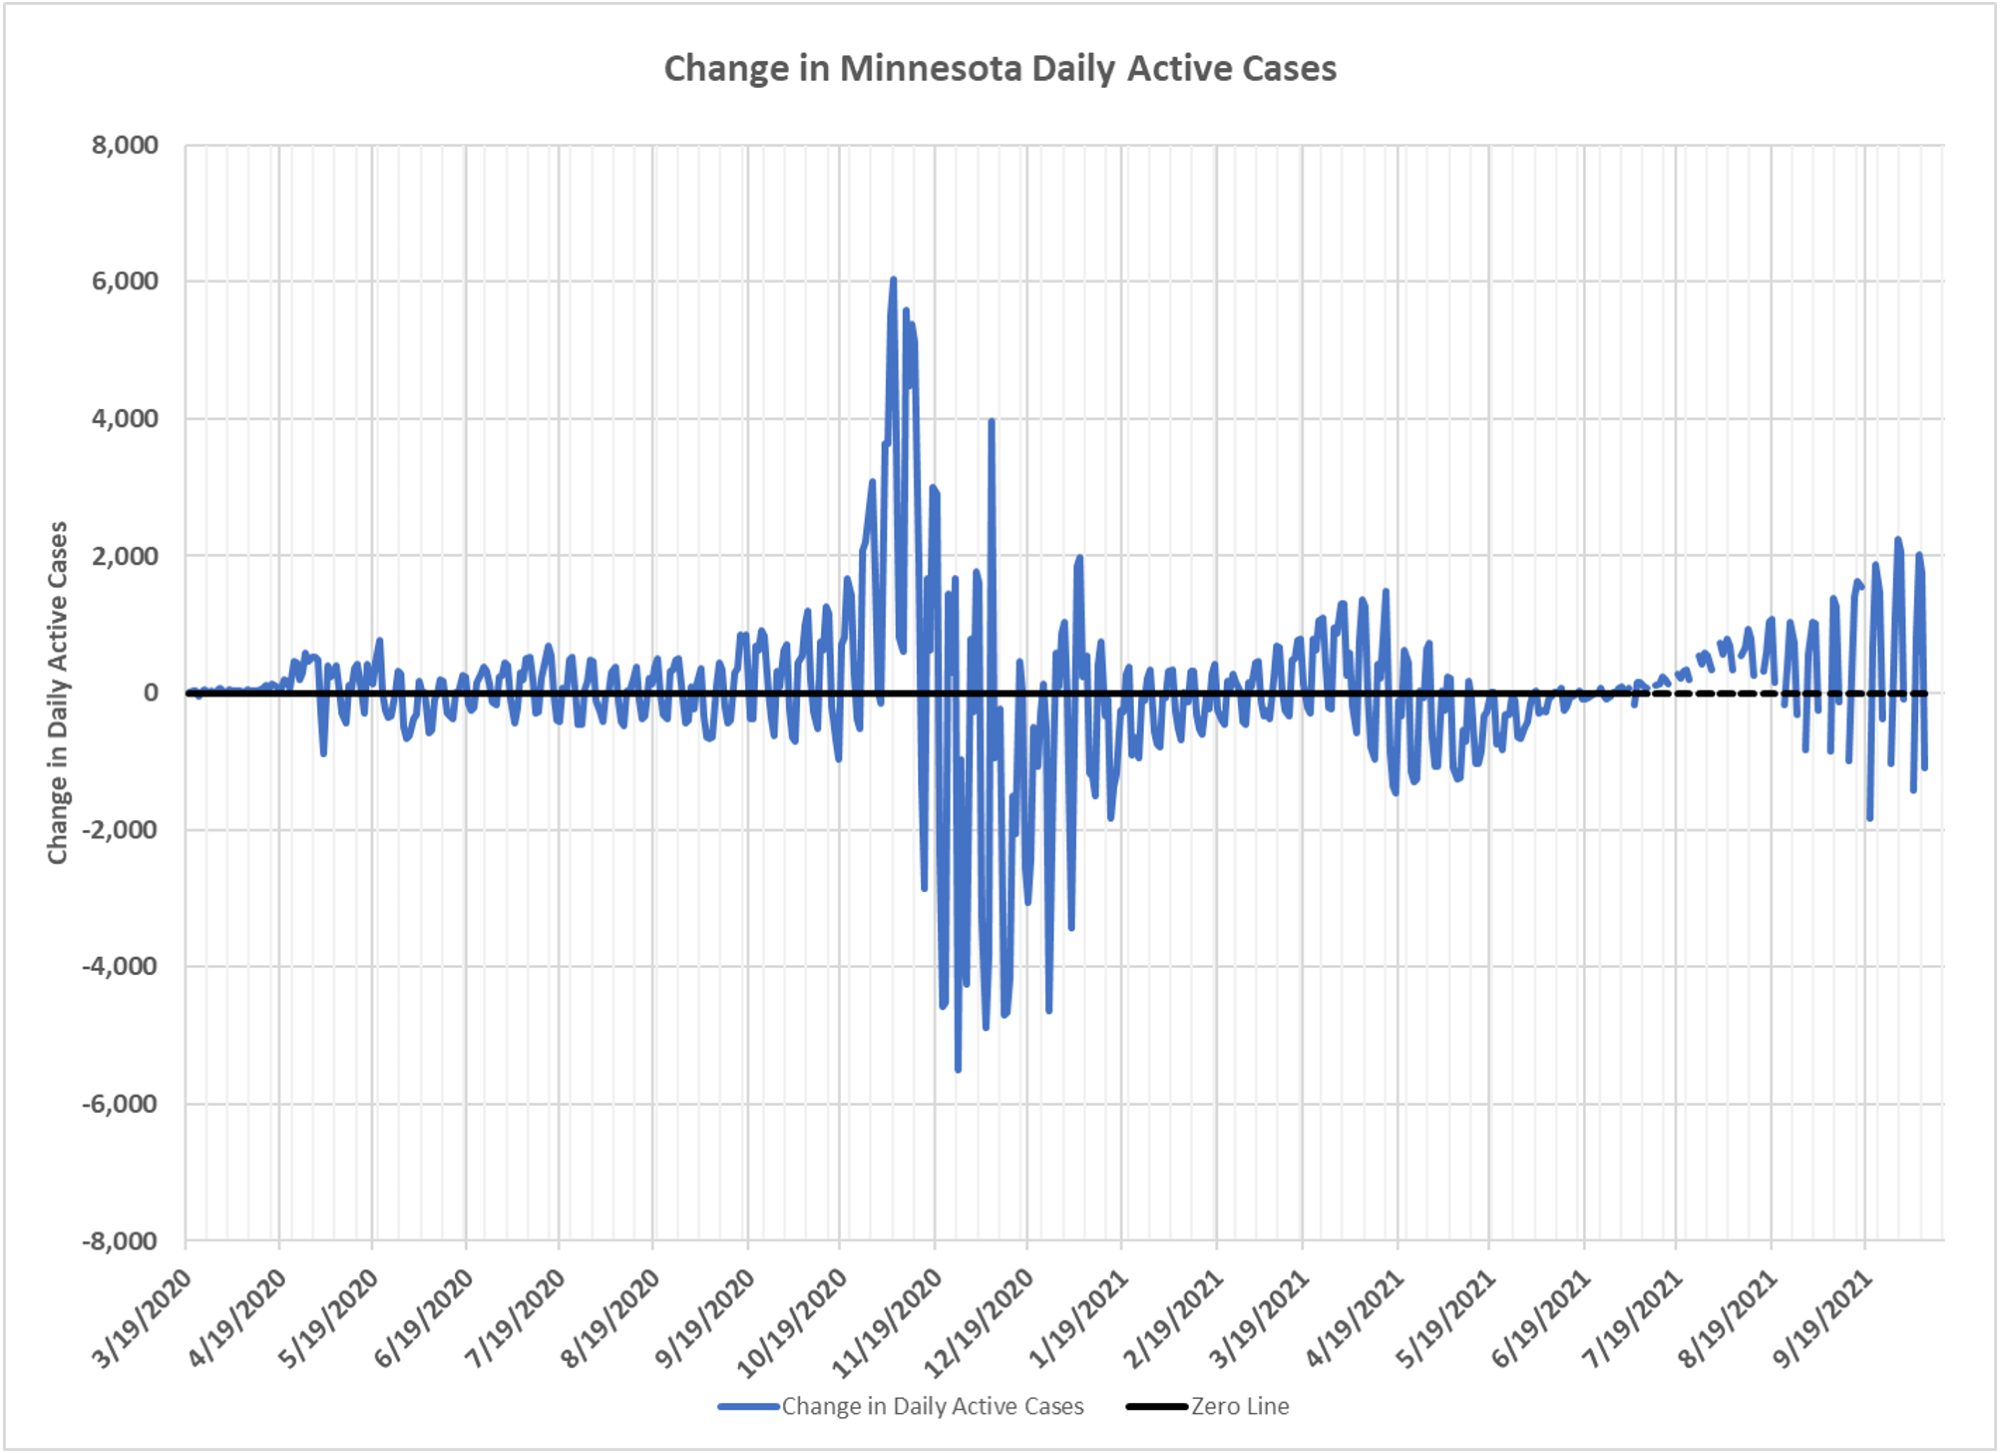
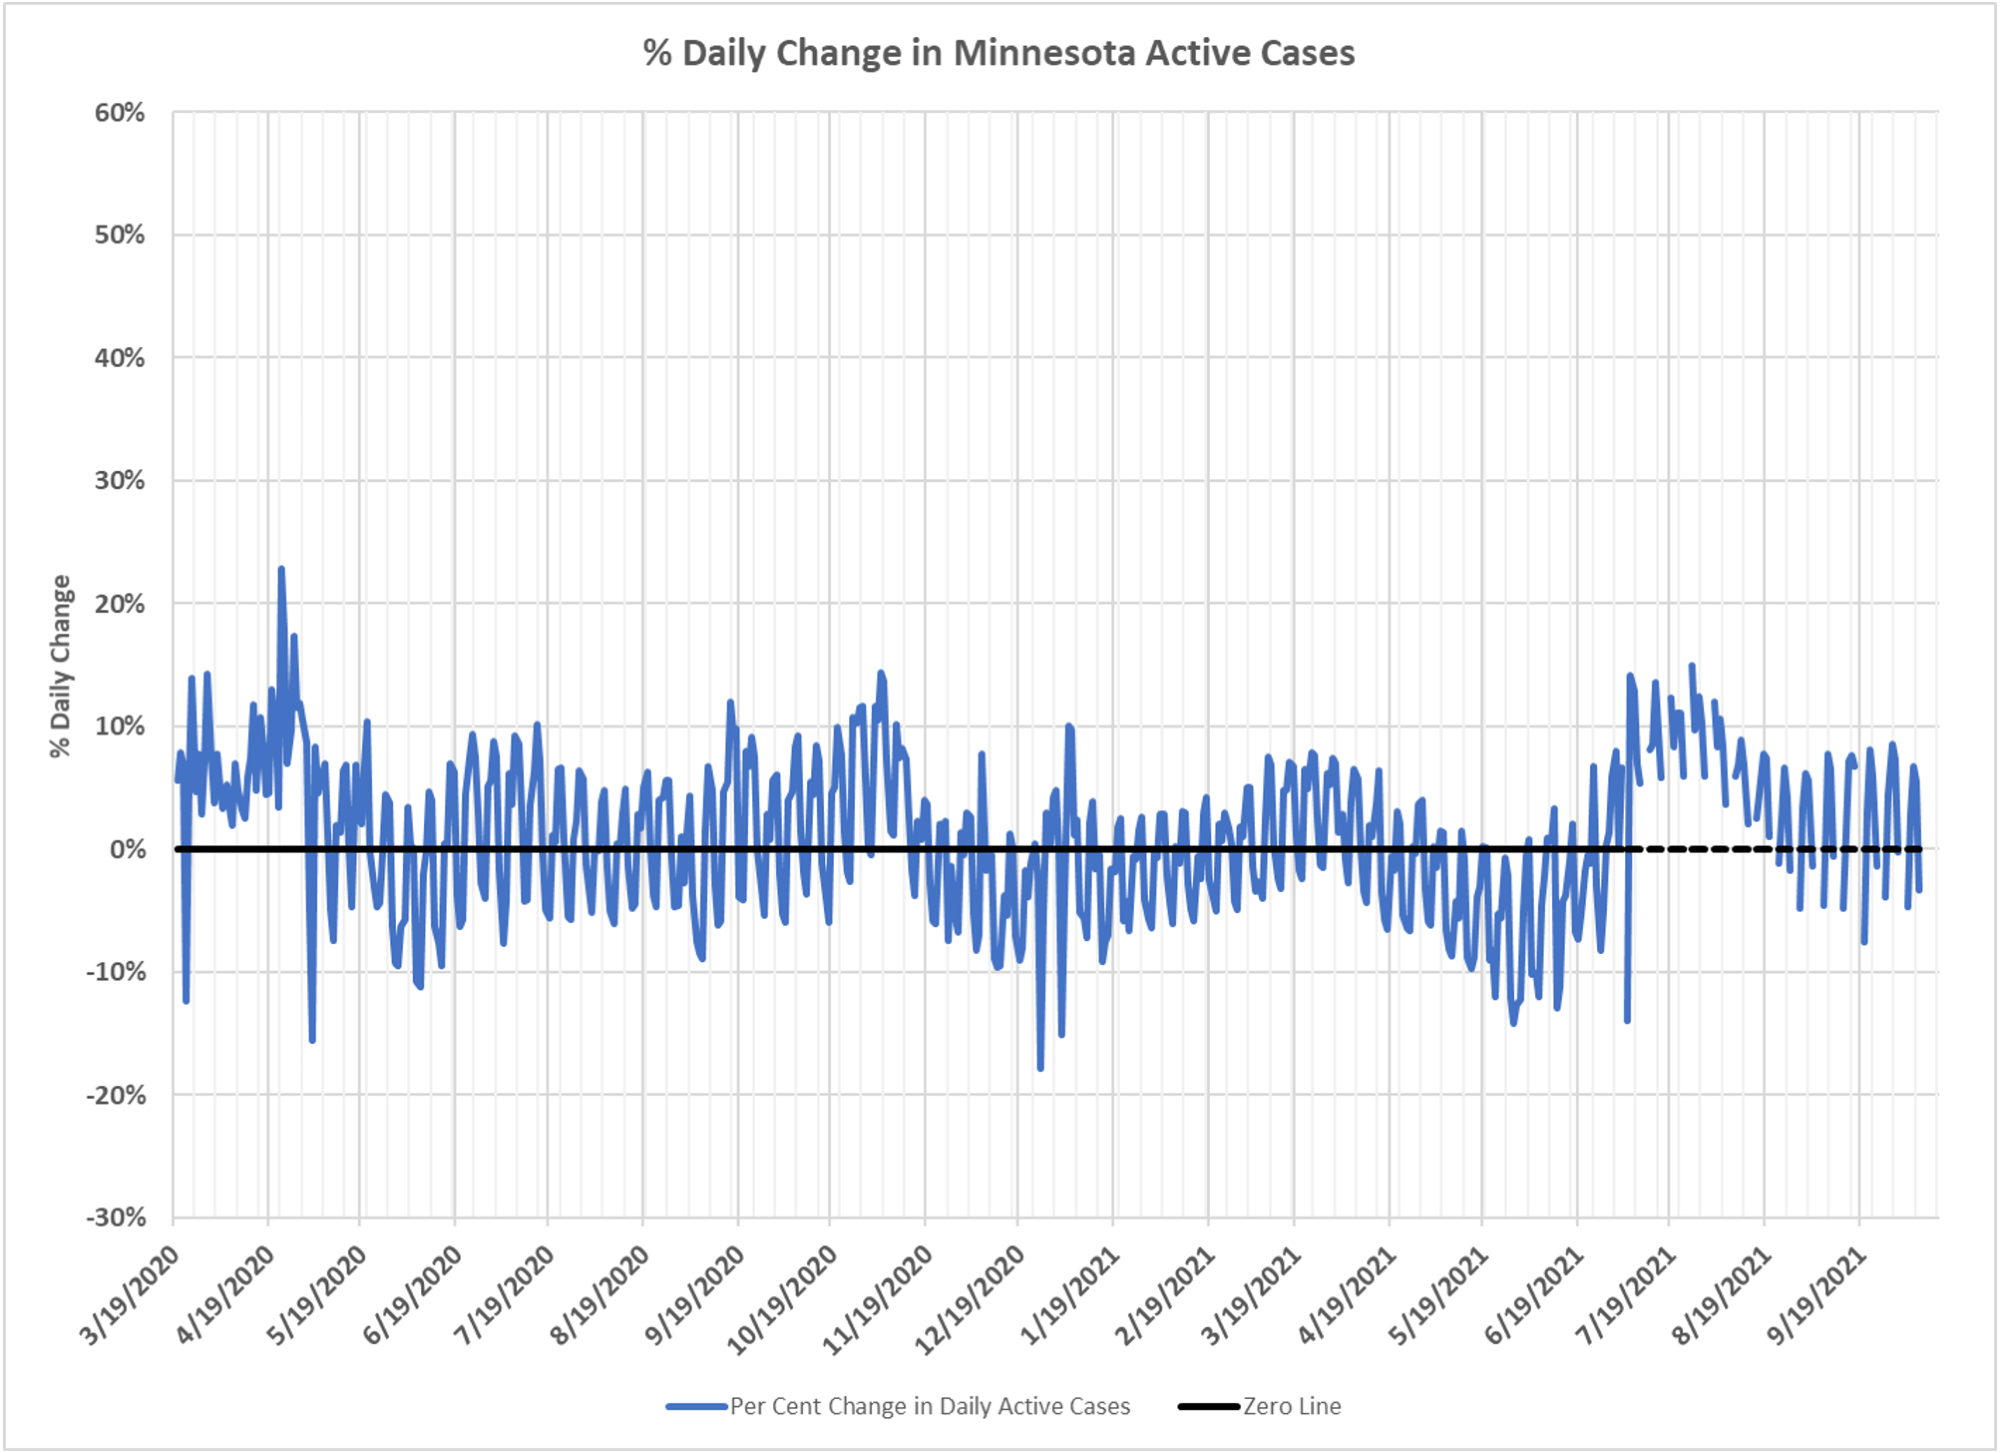
The latest on active cases, our best estimate for how many people are infectious. Charts show calculated number, absolute number change, and percent number change. Percent change is the leading indicator on trend. You can see why I am so ambivalent about that trend, we are just seesawing. The sawtooth pattern is due to the state’s testing and reporting mechanism, because you know, the virus can tell when weekends are. Once more, Dave Dixon’s chart work.