Trying to keep these regularly updated, thanks to Dave Dixon, because it is important to counter some potentially misleading stories, like one appearing in today’s Strib. No there is not a significant trend of higher deaths in younger groups. Not at all. The big picture is that we are pretty plateaued and steady as she goes, including among age groups, with the exception of parents potentially getting the message to stop letting their school-aged kids get tested, so we see a decline in both testing and cases in that group. Here are Dave’s observations on this week’s charts compared to last week.
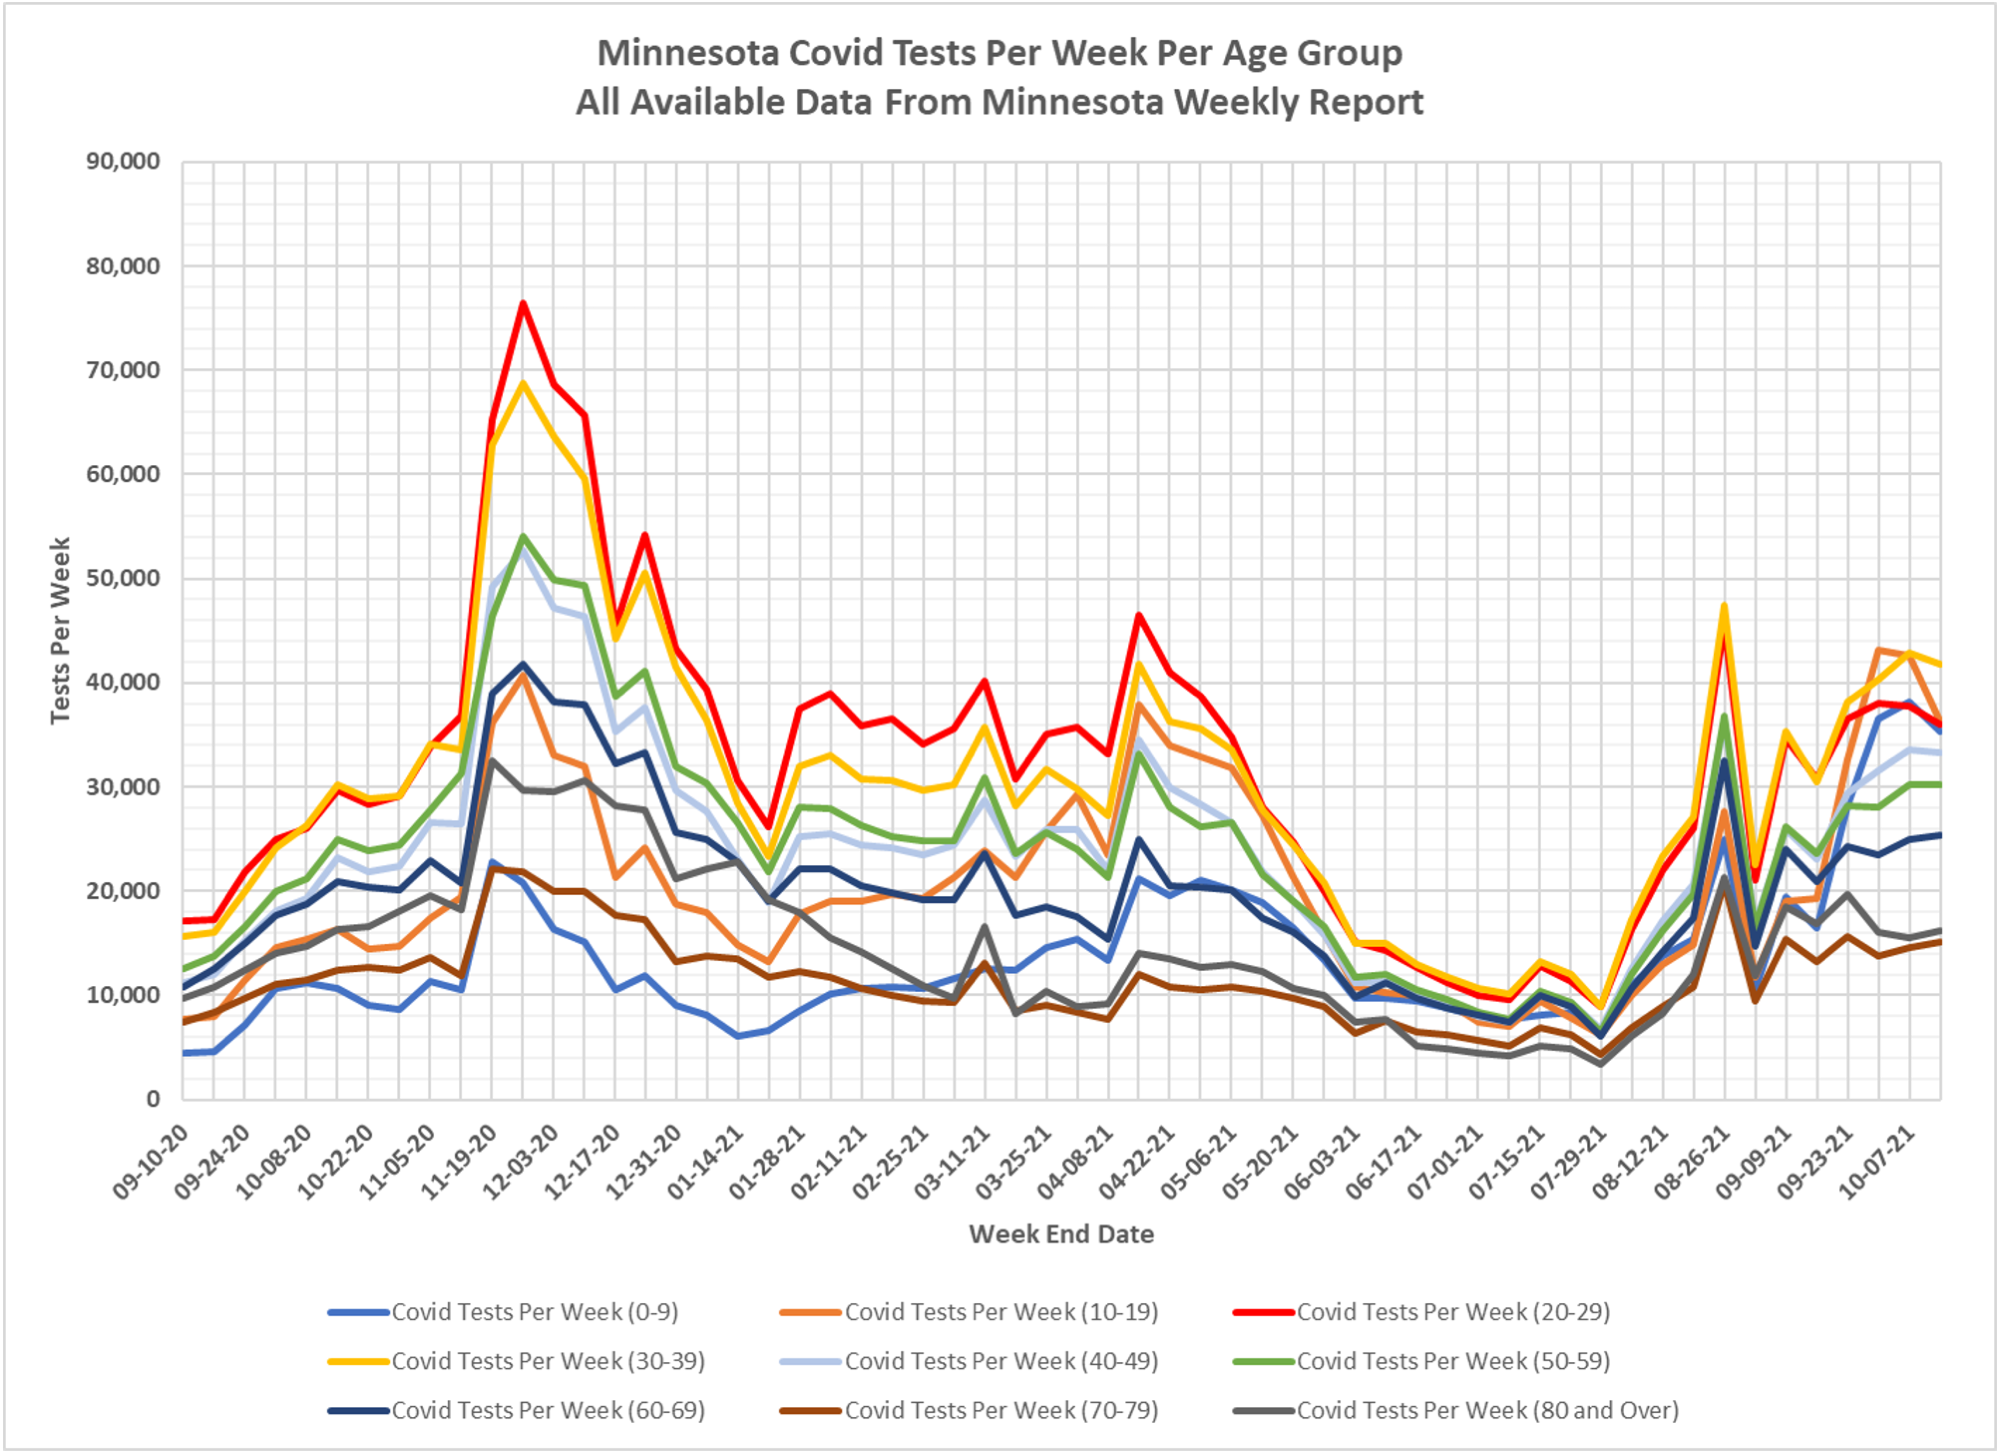
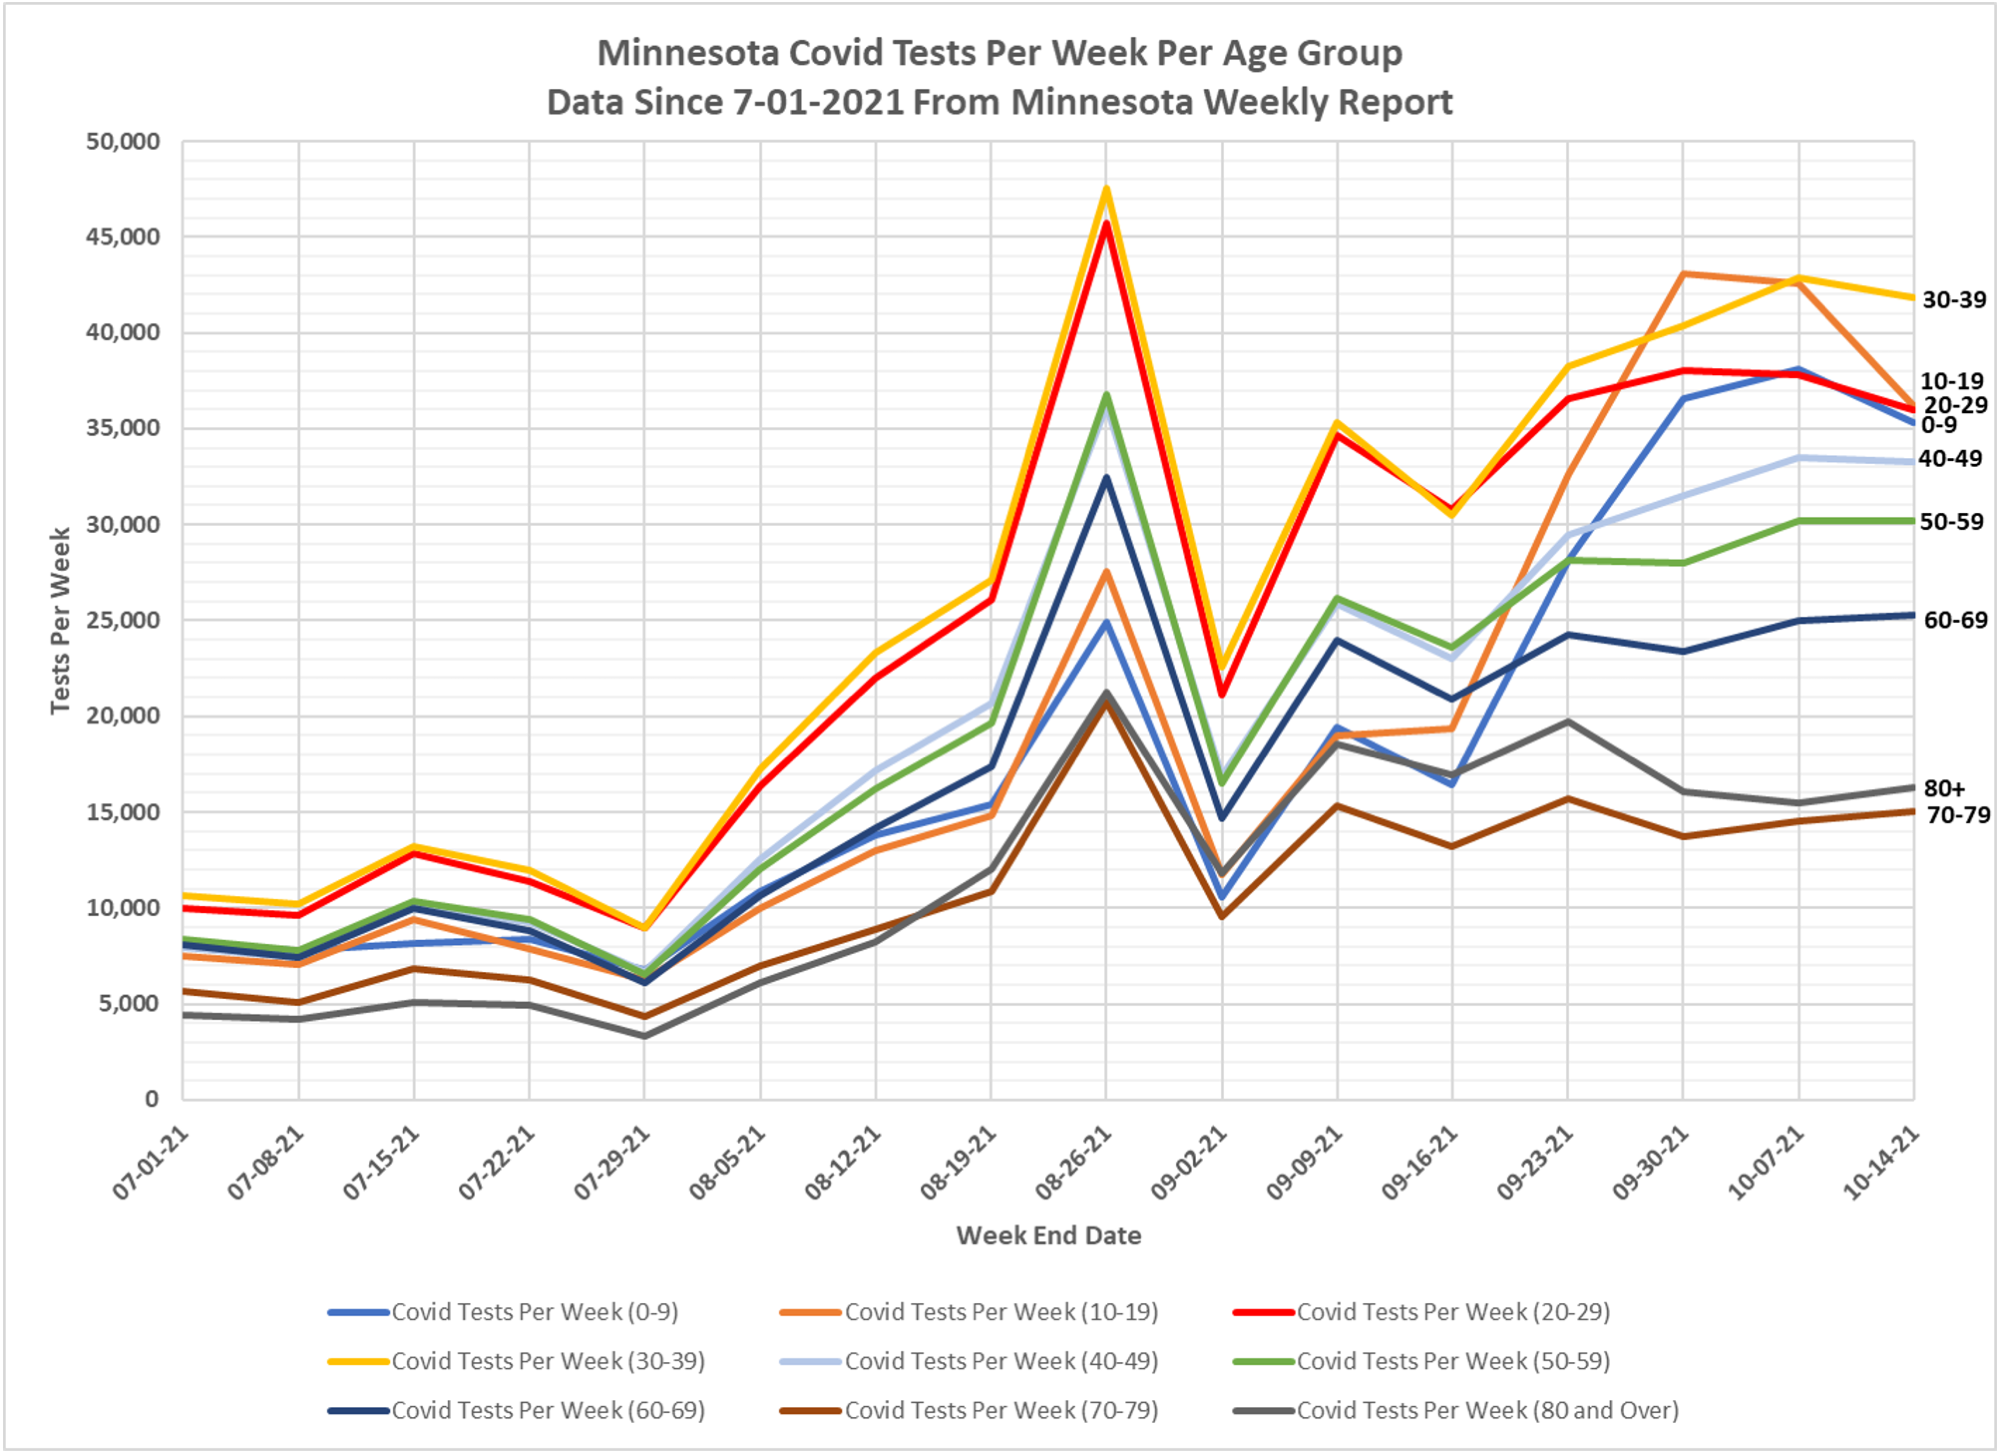
1. Slide 2, Tests Per Week:
Fairly sizeable reduction in tests for the 0-9 and 10-19 age groups.
Moderate reduction in tests for the 20-29 and 30-39 age groups.
Very slight reduction in tests for the 40-49 age group.
Slight increases in tests for the remaining older age groups.
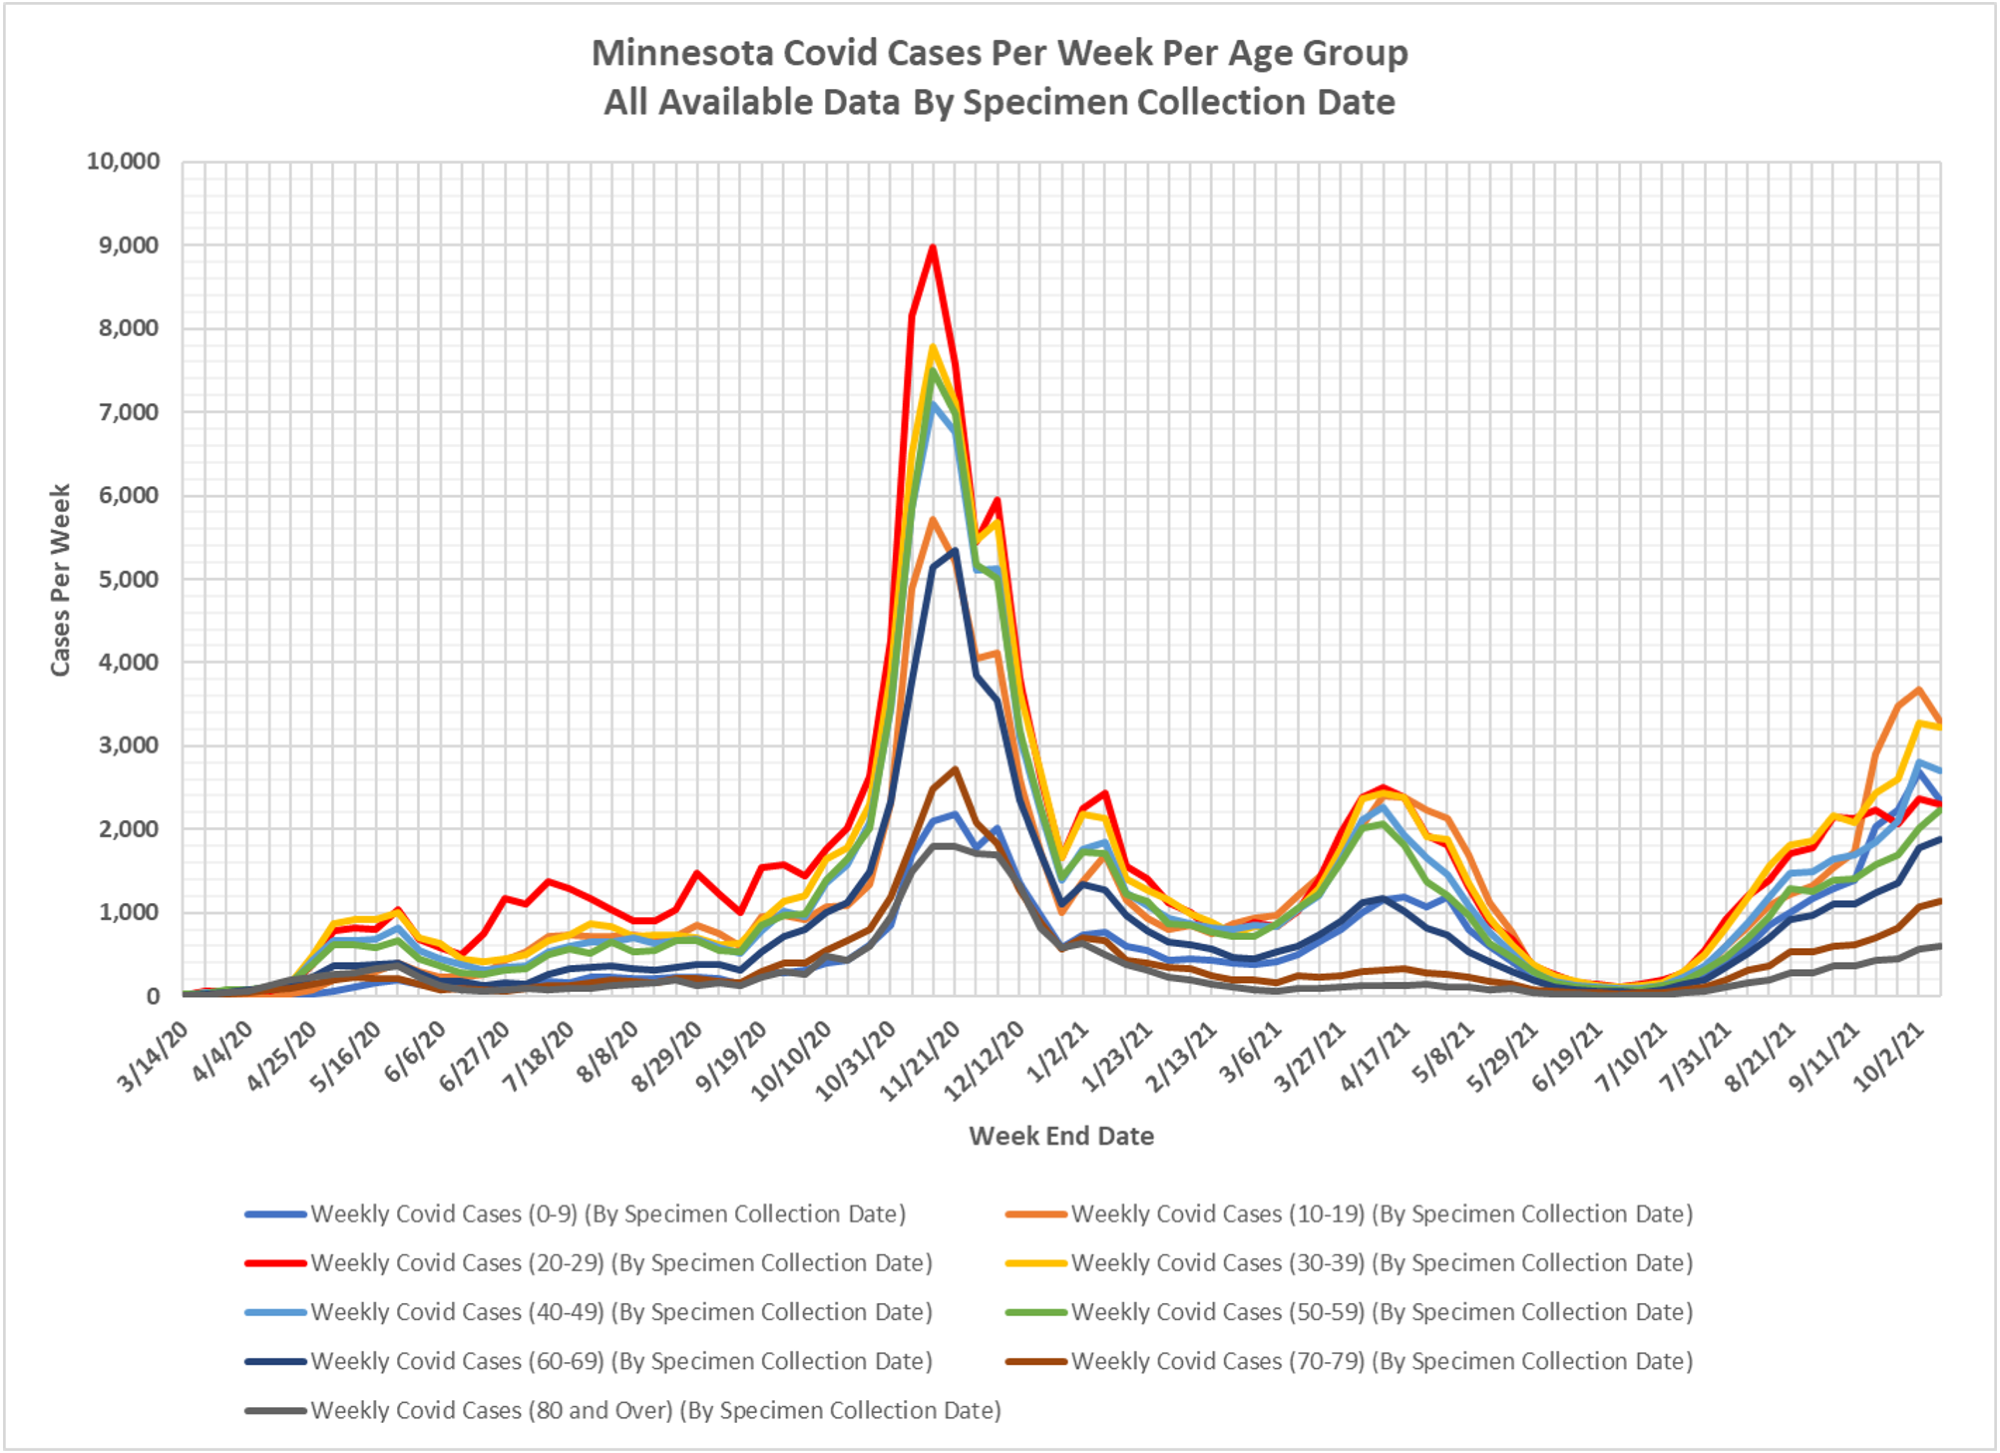
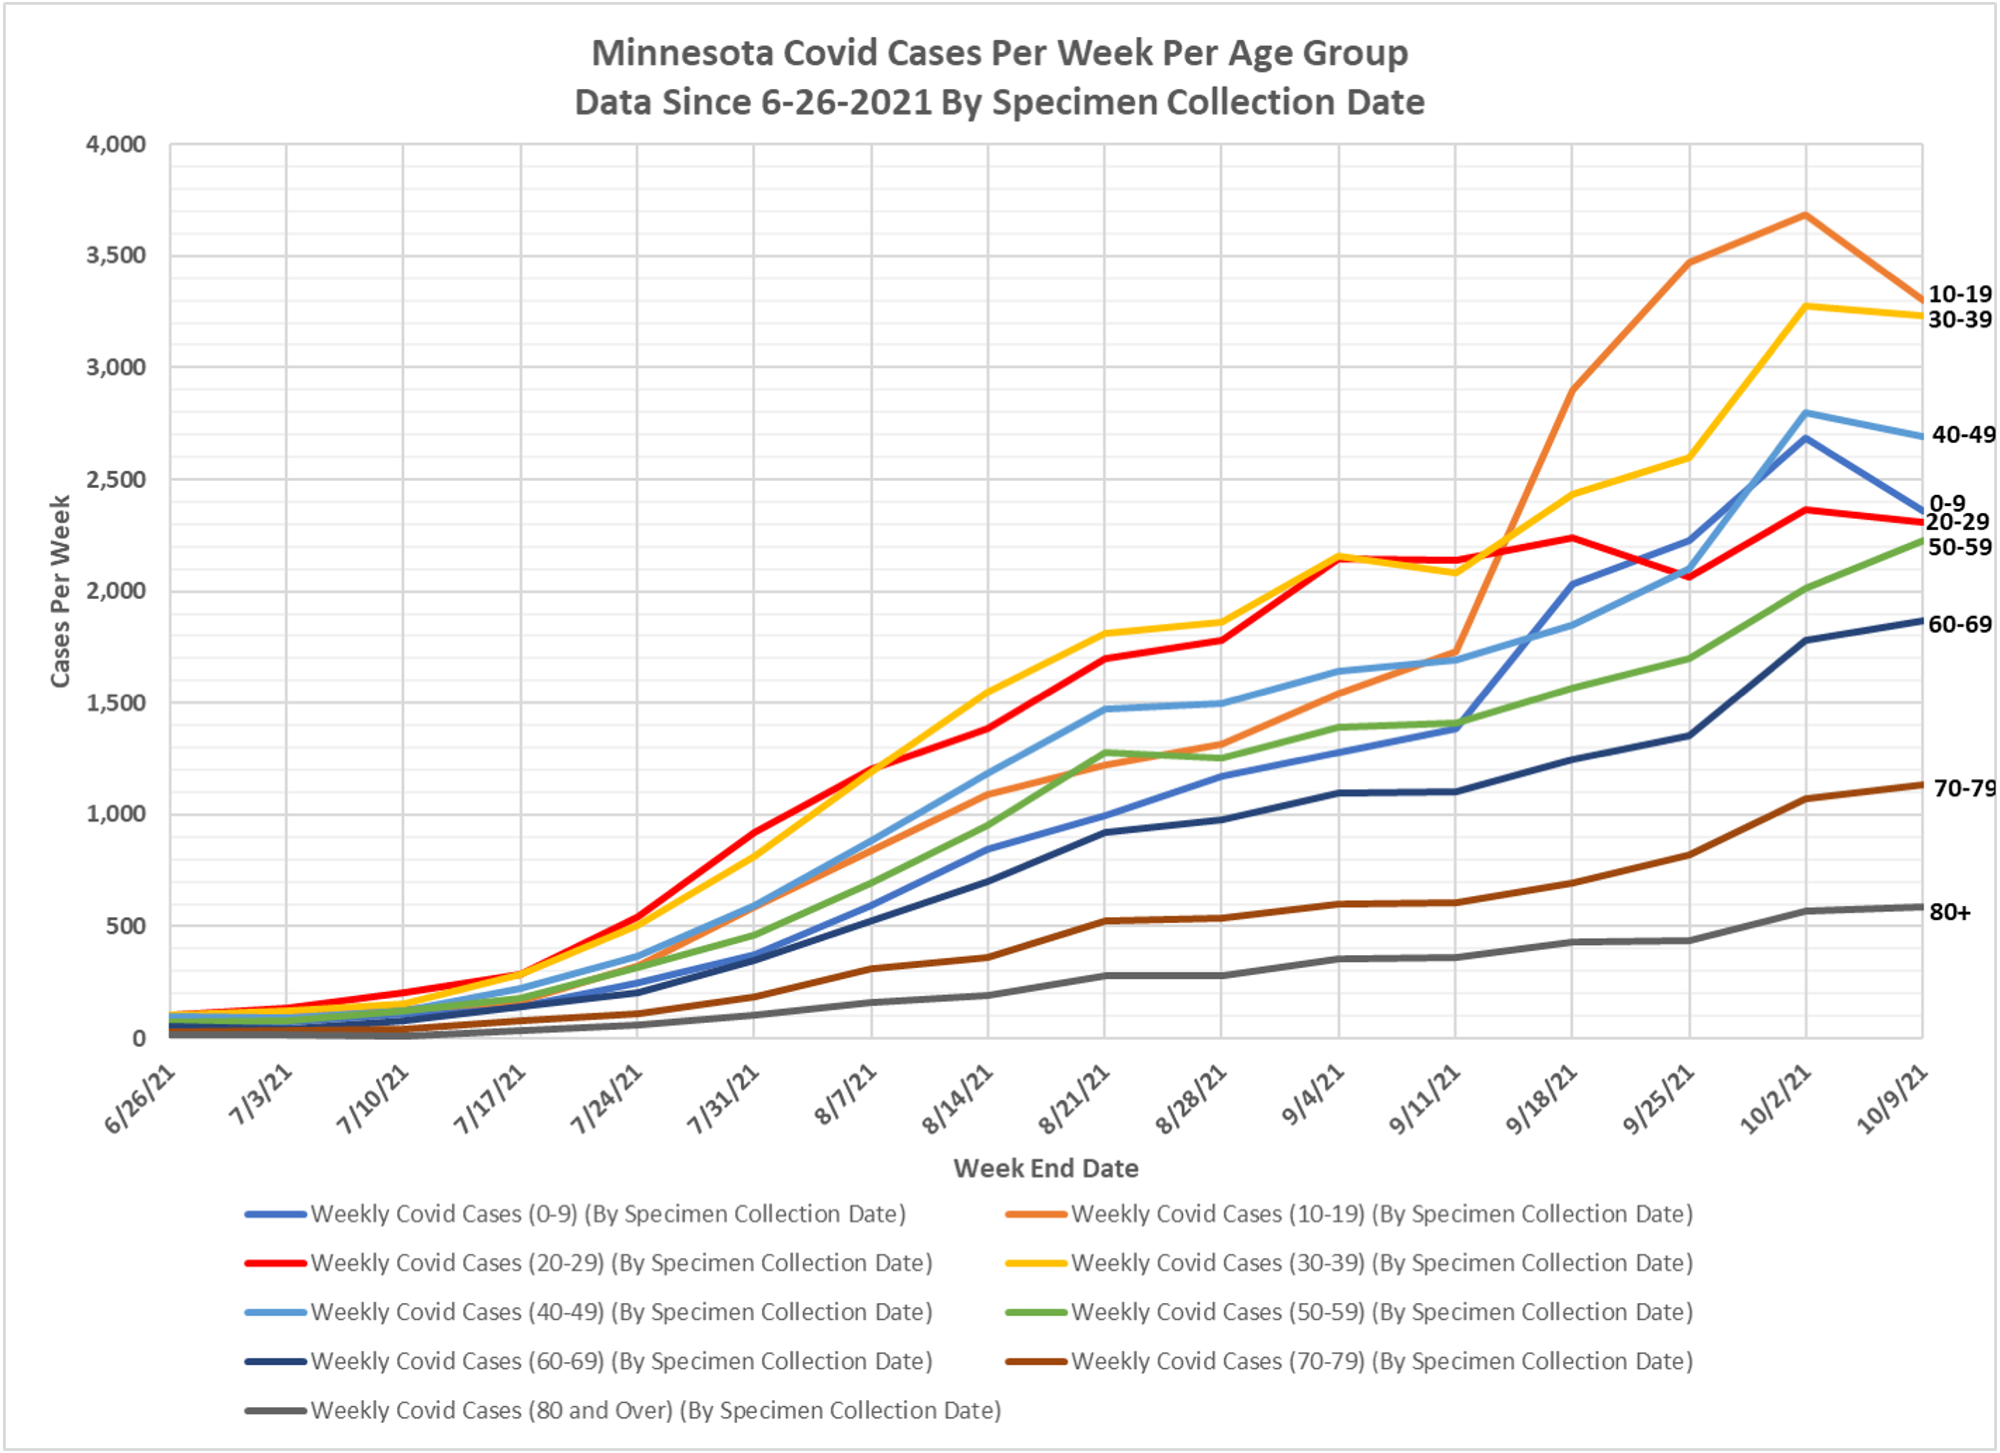
2. Slide 4, Cases Per Week:
Fairly large reduction in positive cases for the 0-9 and 10-19 age groups, corresponding to the reduction in tests.
Slight reduction in cases for the 20-29 and 30-39 age groups, also corresponding to the reduction in tests.
Moderate reduction in cases for the 40-49 age group.
The remaining older age groups had a slight to moderate increase in cases.
Not shown here but the total cases reported in this week’s Weekly Report was 20,057 vs 20,907 last week, a reduction of 850 cases. Let’s hope this signals that we have finally reached the peak in this surge.
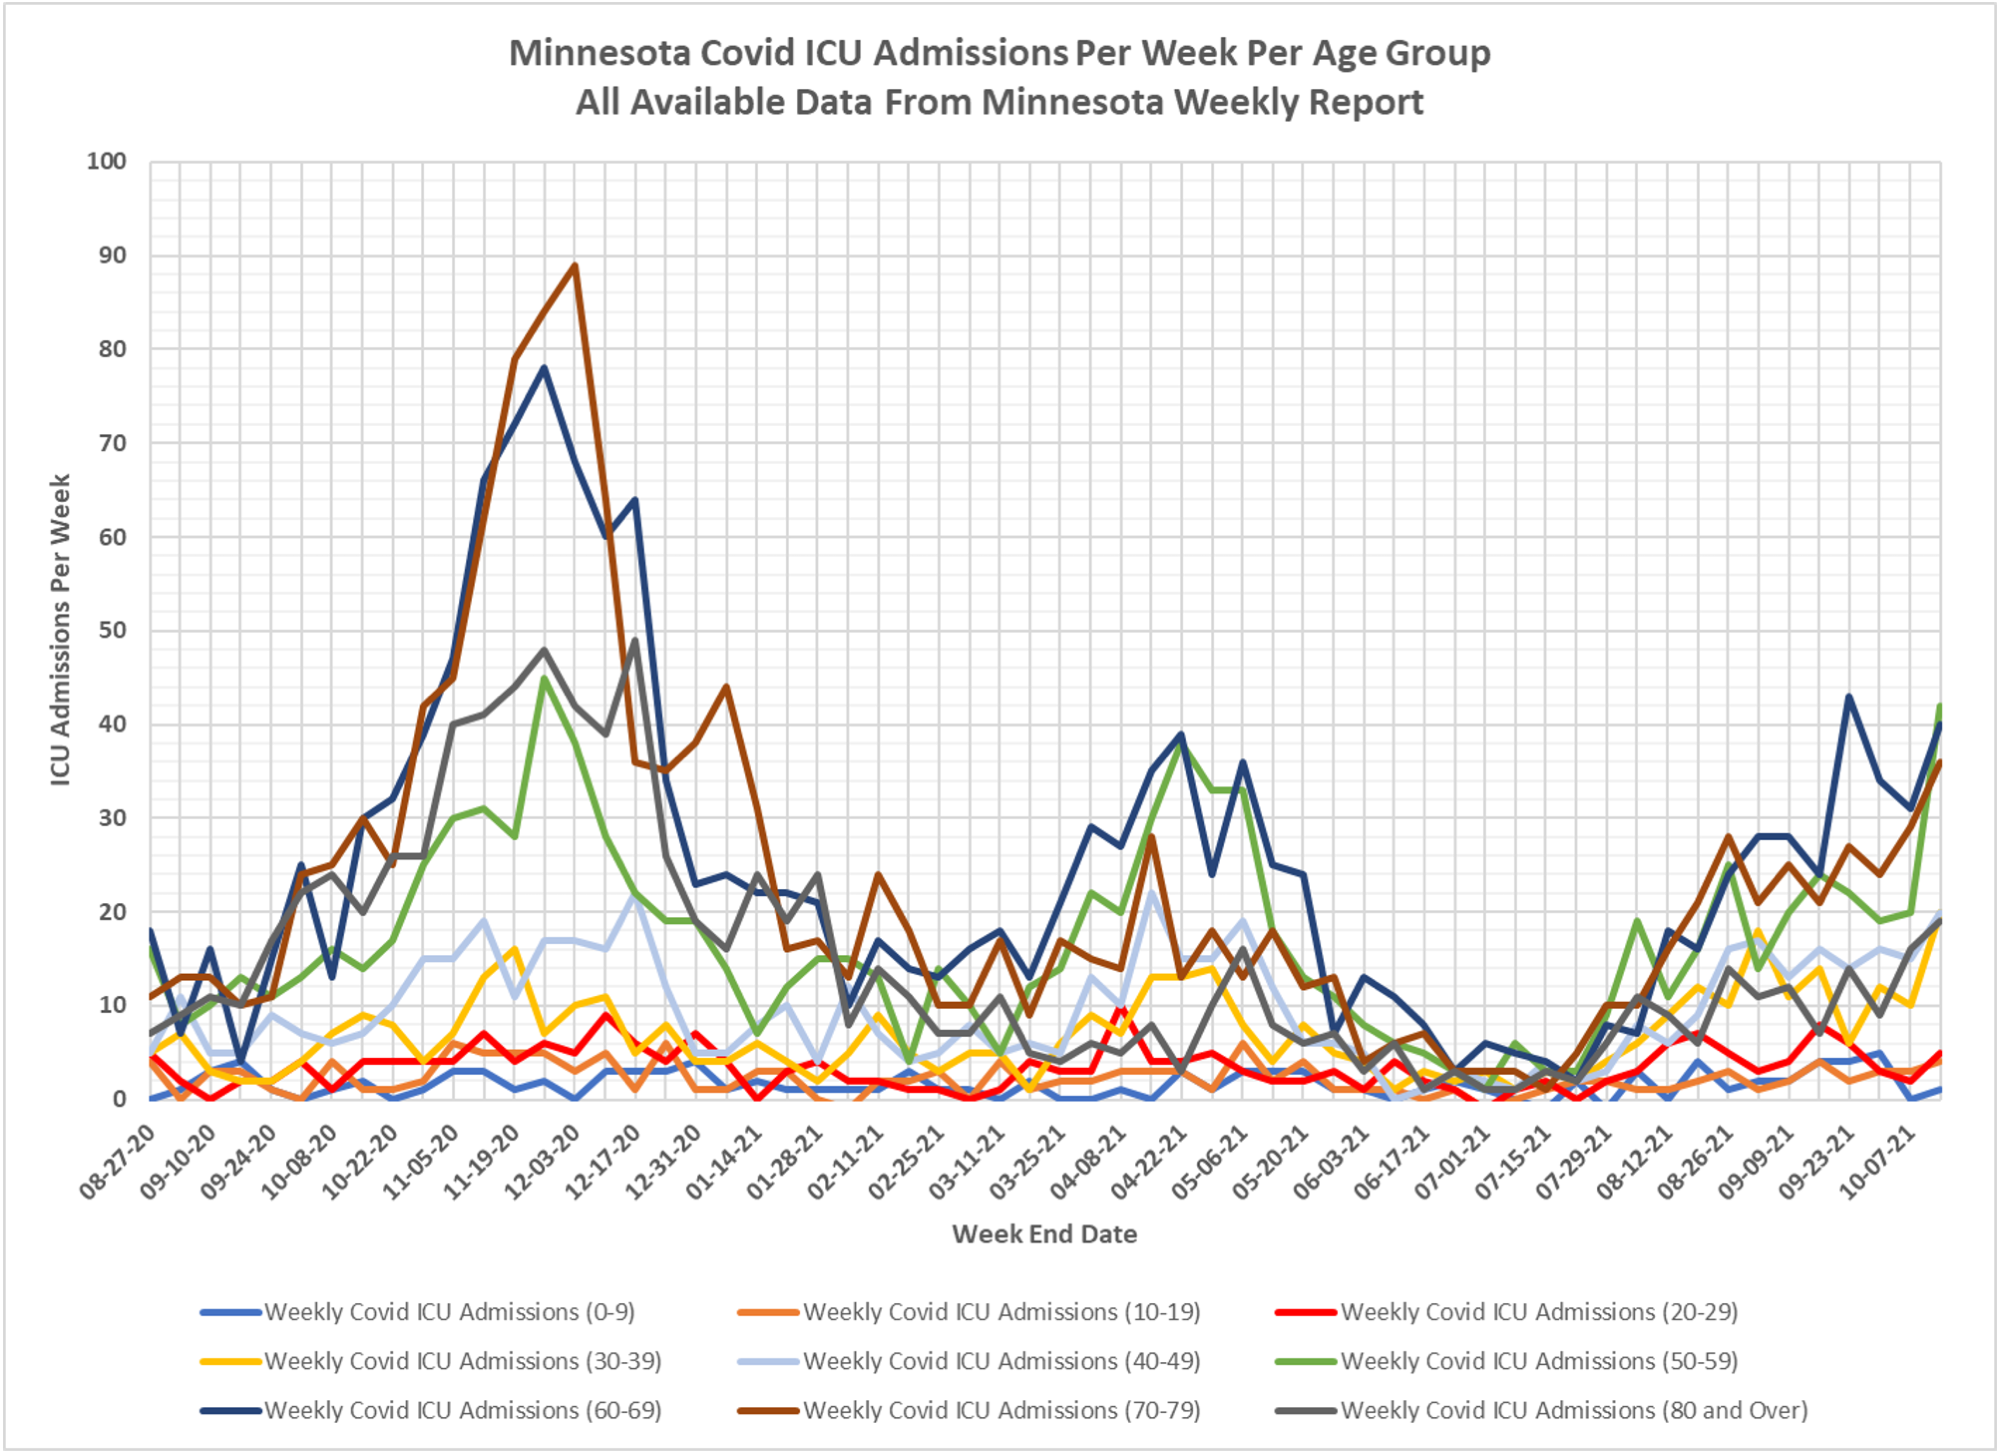
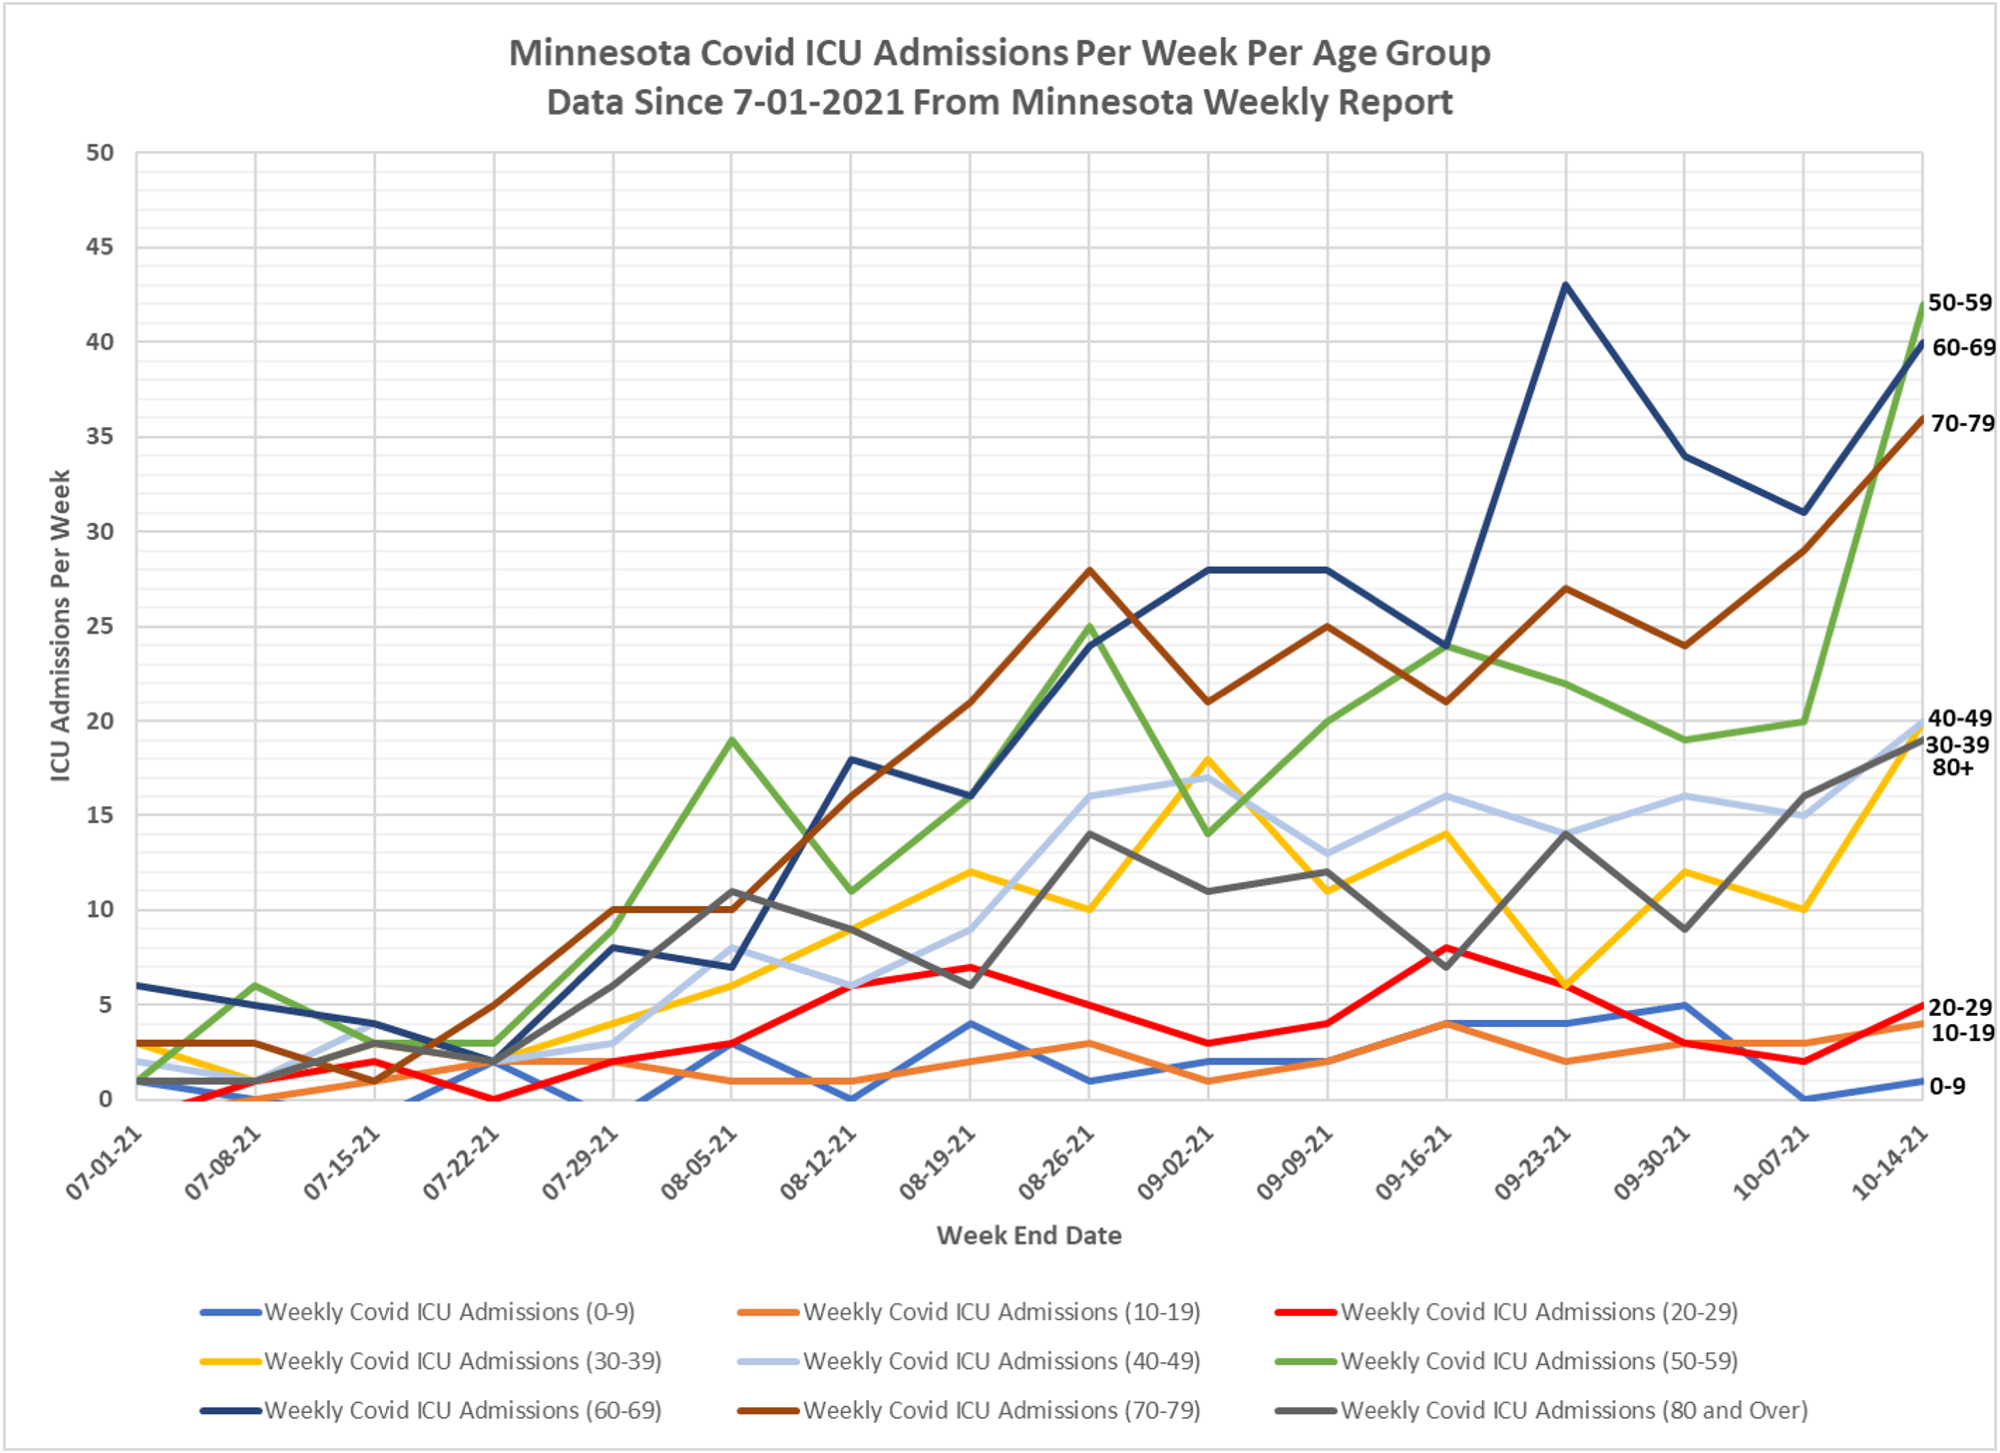
3. Slide 6, ICU Admissions Per Week:
There was one ICU admission in the 0-9 age group, 4 in the 10-19 age group, and 5 in the 20-29 age group. These were all within the range of admissions for the last 2 months.
The 30-39, 40-49, and 80+ age groups were all between 19 and 20 ICU admissions for the week, trending a little higher over the past month.
The 50-59 age group more than doubled ICU admissions from 20 to 42.
The 60-69 age group (31 to 40 admissions) and 70-79 age group (29 to 36 admissions) also had sizeable increases.
The total ICU admissions for all ages increased from 126 last week to 187 this week.
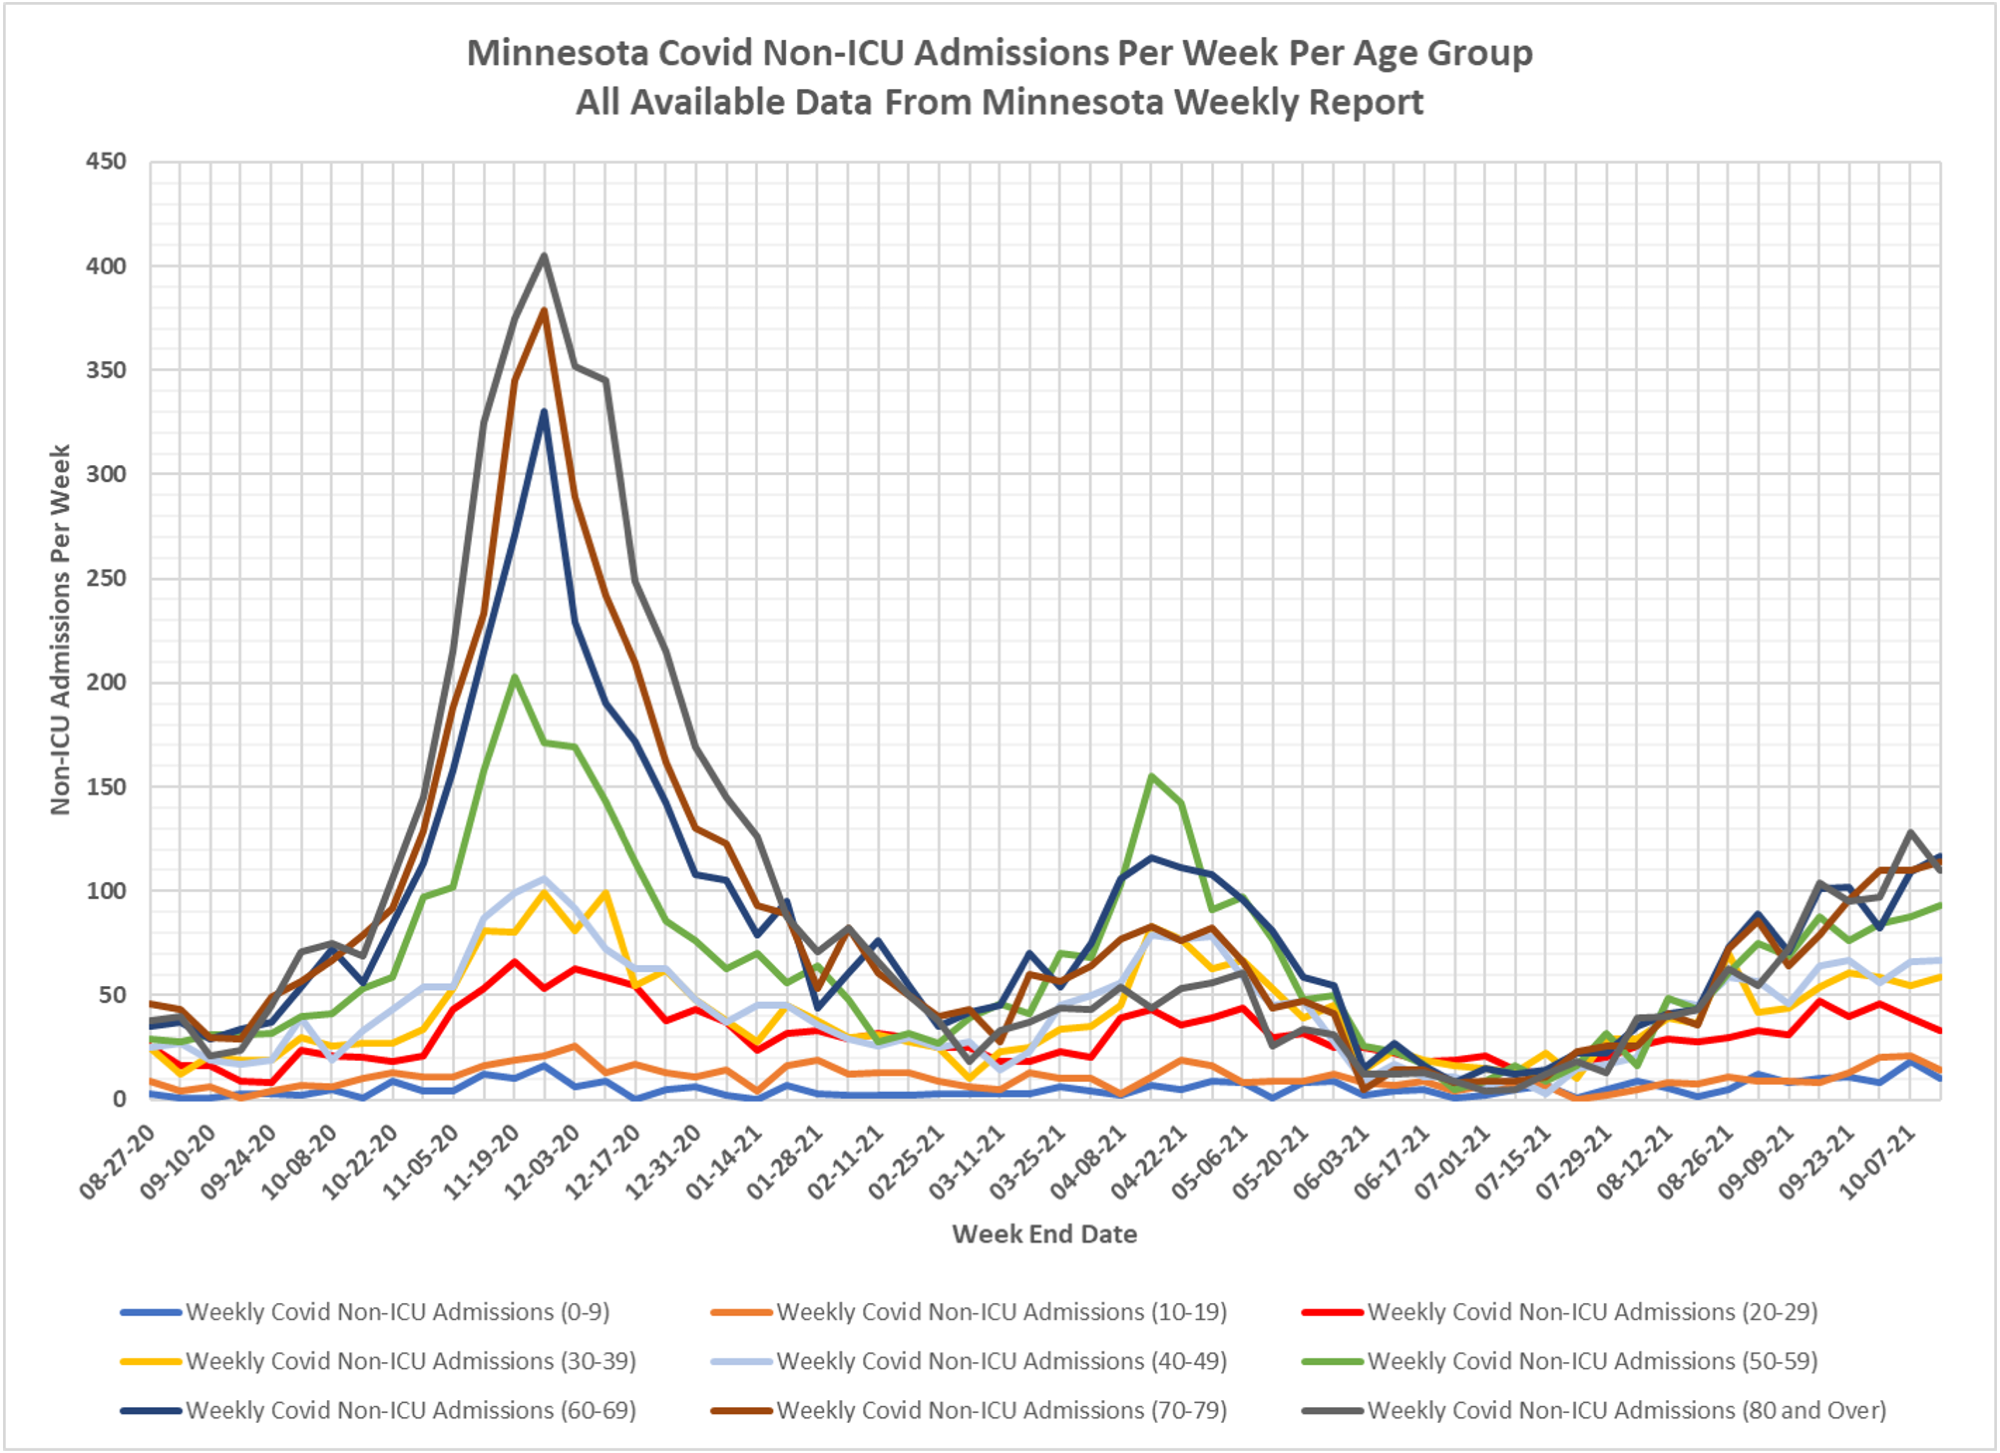
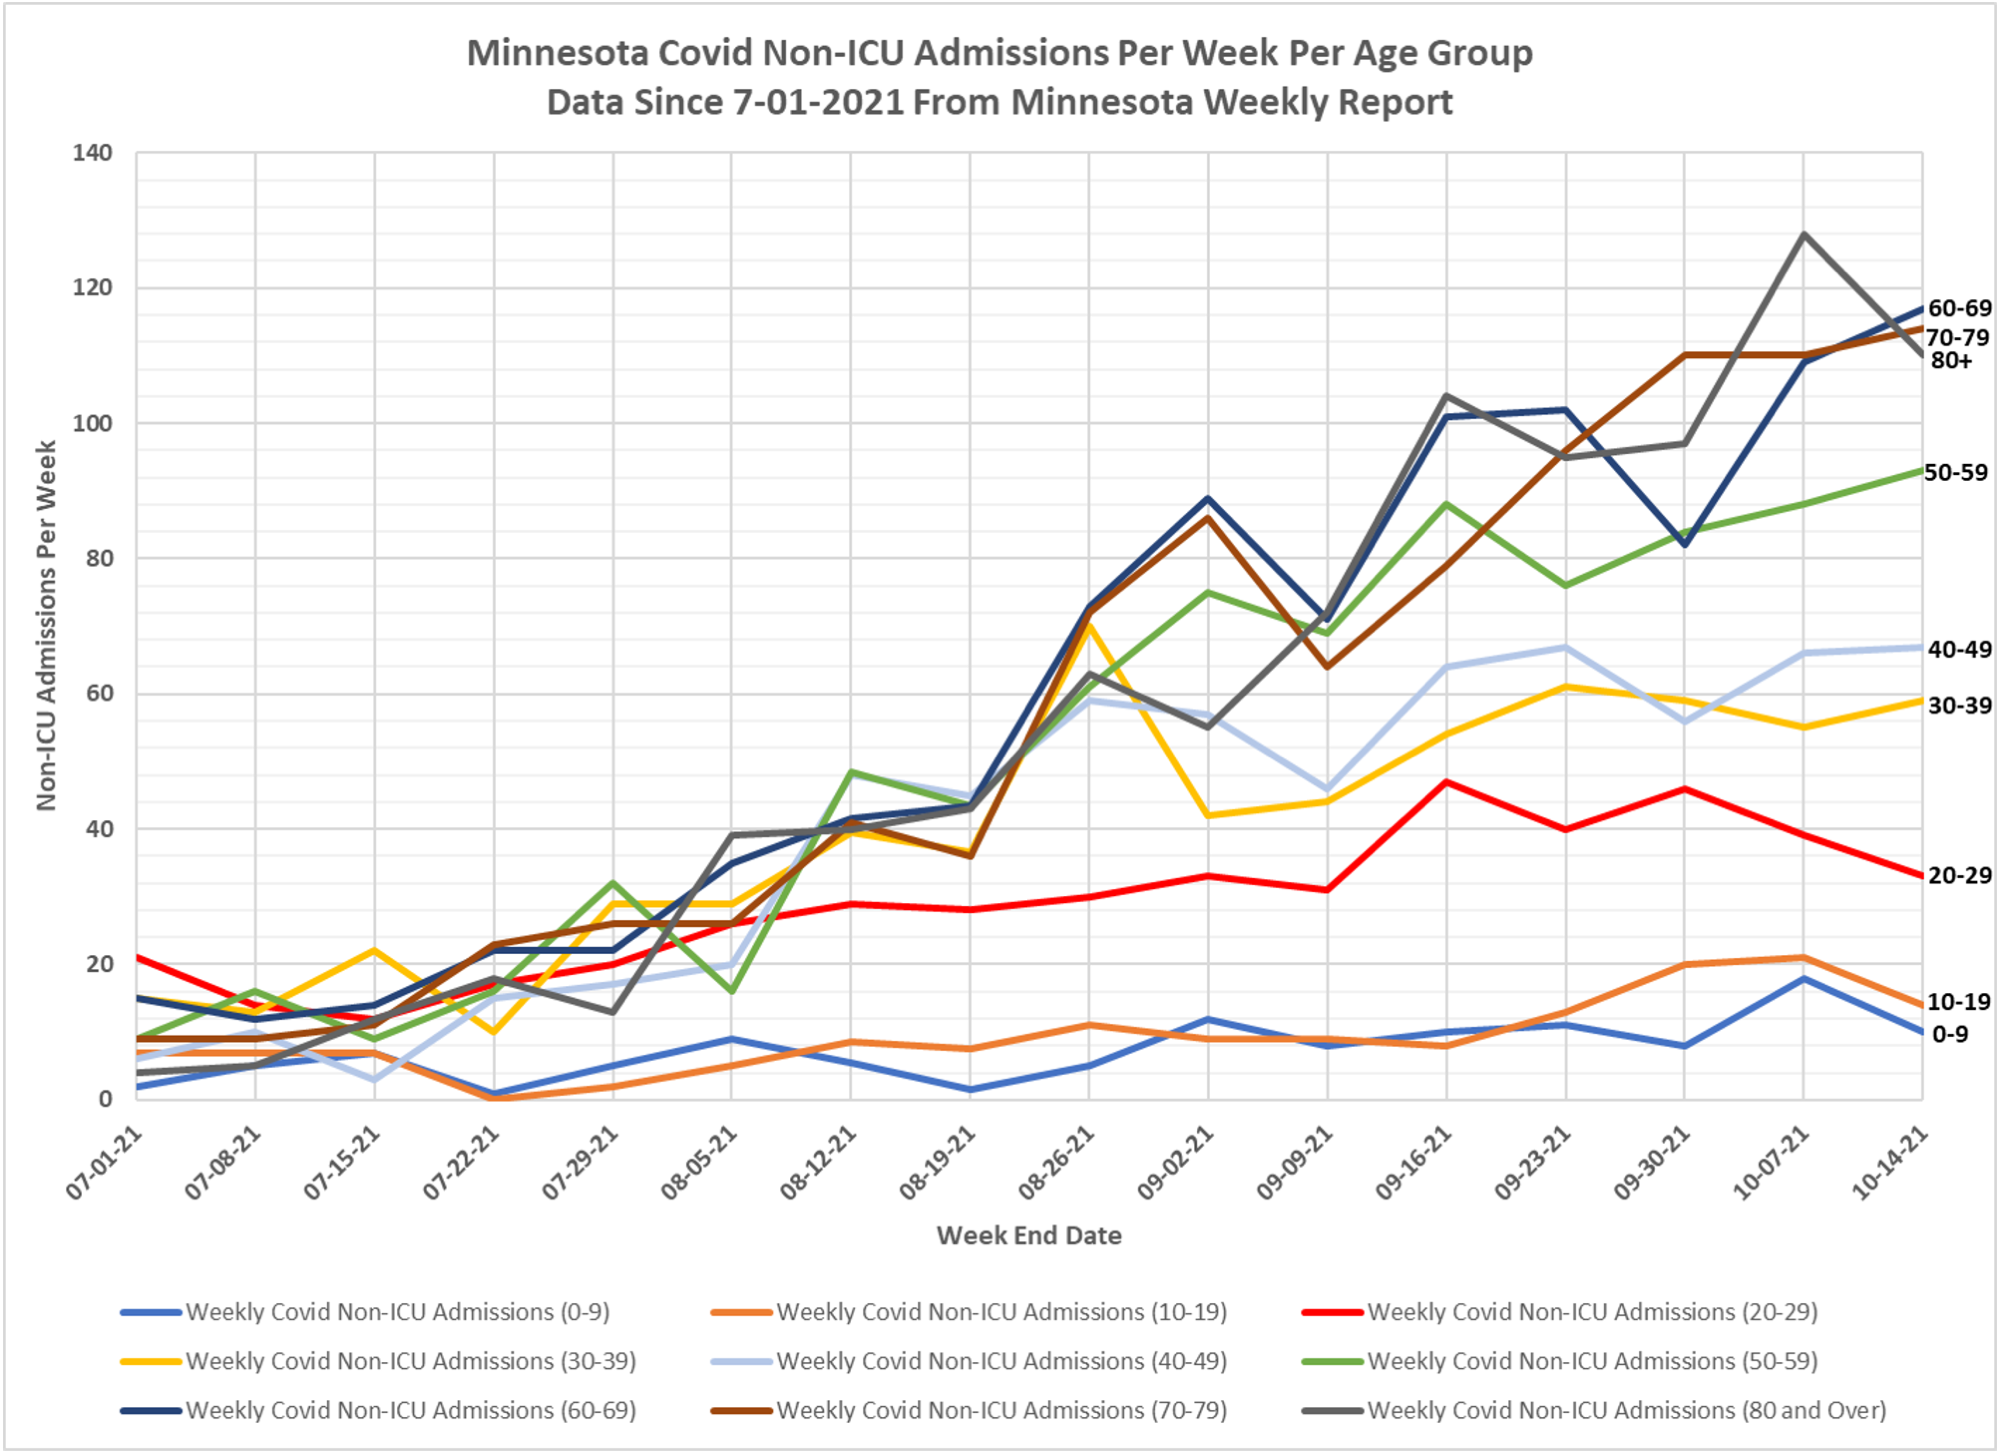
4. Slide 8, Non-ICU Admissions Per Week:
Both the 0-9 age group (10 admissions), 10-19 age group (14 admissions), and 20-29 age group (33 admissions) were lower than the week before.
The 30-39 and 40-49 age groups were little changed, and within the general range on Non-ICU admissions seen for the past month.
The 50-59, 60-69, and 70-79 age groups were all higher week over week.
The 80+ age group had lower admissions for the week (110 vs 128 the week before) but is still at a high level considering the high per cent of vaccination in this age group.
The total Non-ICU admissions for all ages decreased slightly from 634 last week to 617 this week.
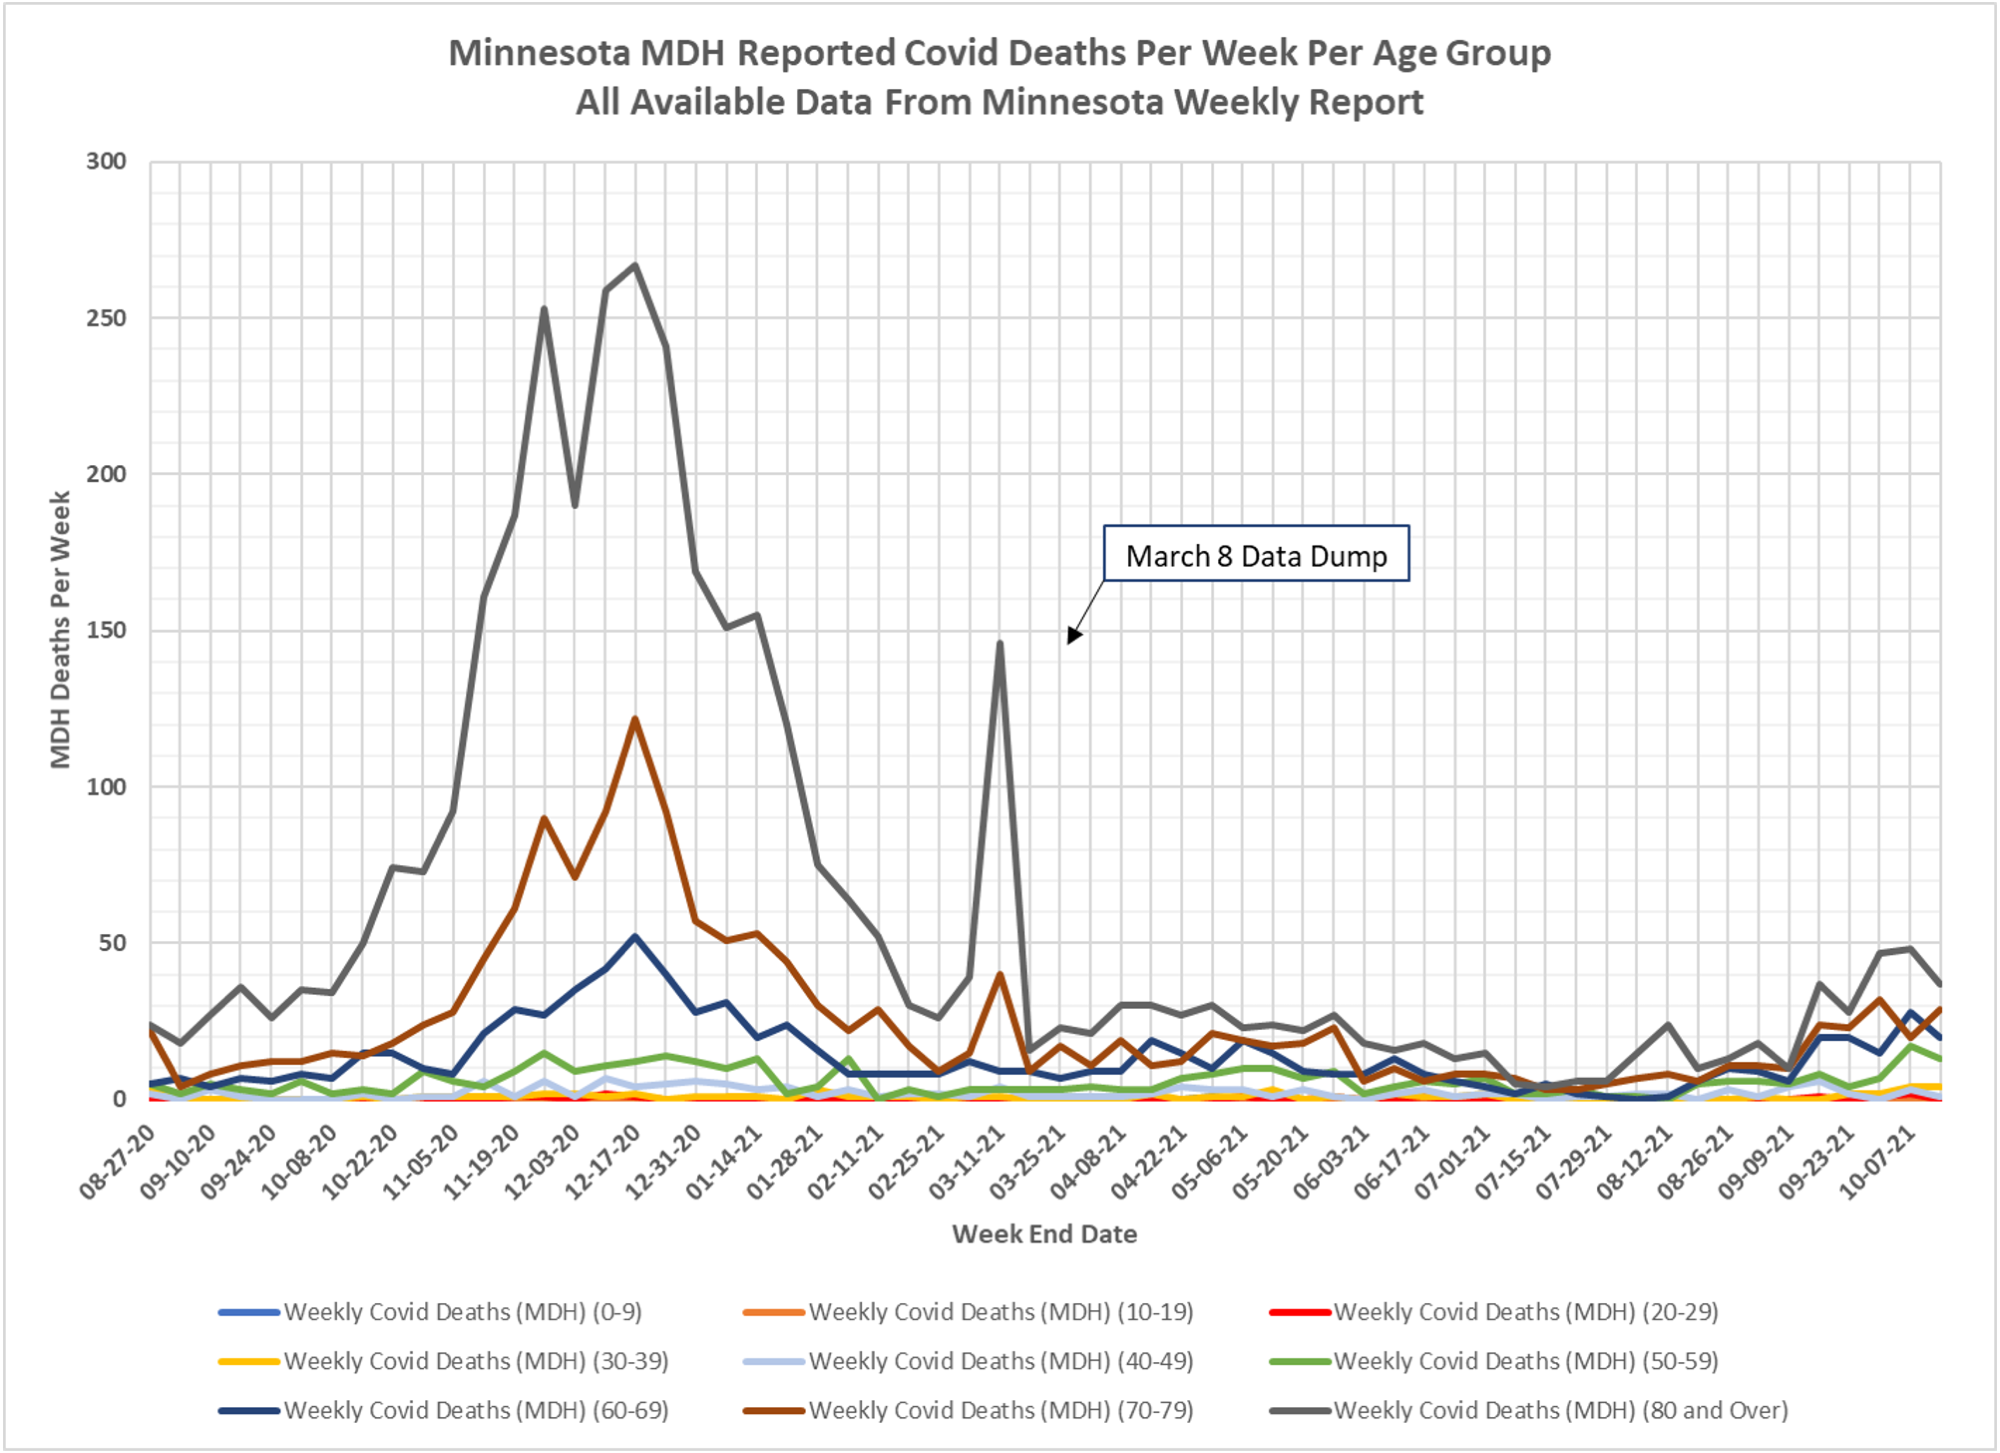
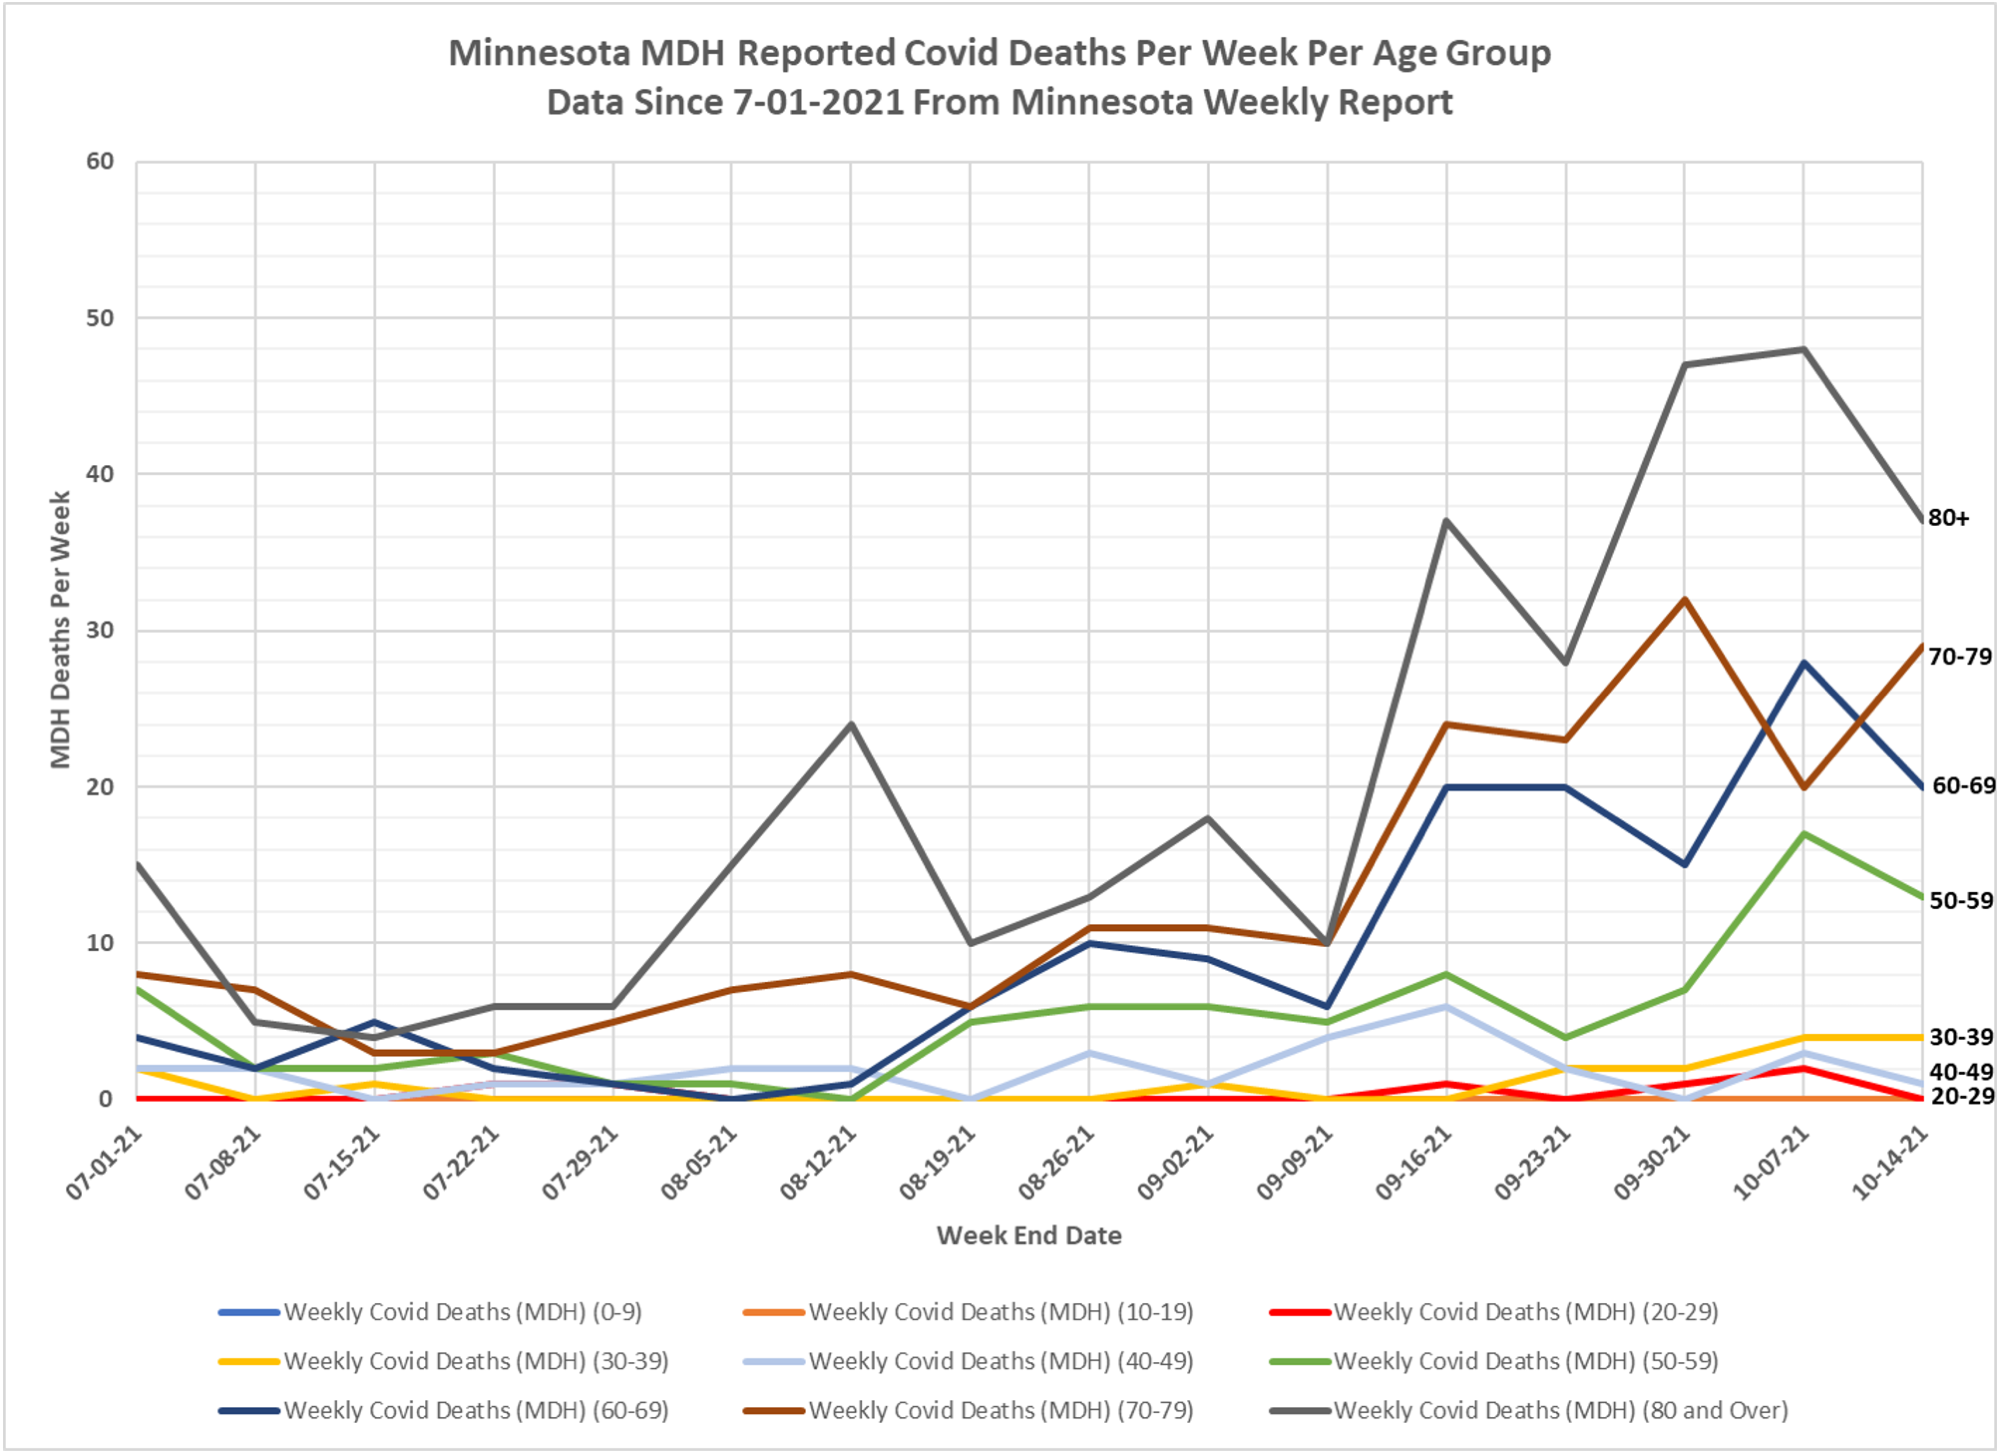
5. Slide 10, Reported Deaths Per Week:
No deaths were reported for the week for the 29 and younger age groups.
There were 4 deaths in the 30-39 and 1 death in the 40-49 age groups reported.
The 50-59, 60-69, and 80+ age groups had lower deaths for the week than the week before, but were generally within the range of recent weeks.
The 70-79 age group had higher deaths for the week, but was also within the range of recent weeks.
Reported deaths for ages decreased from 122 last week to 104 this week. Too soon to say we are at peak because of the high ICU admissions this week.