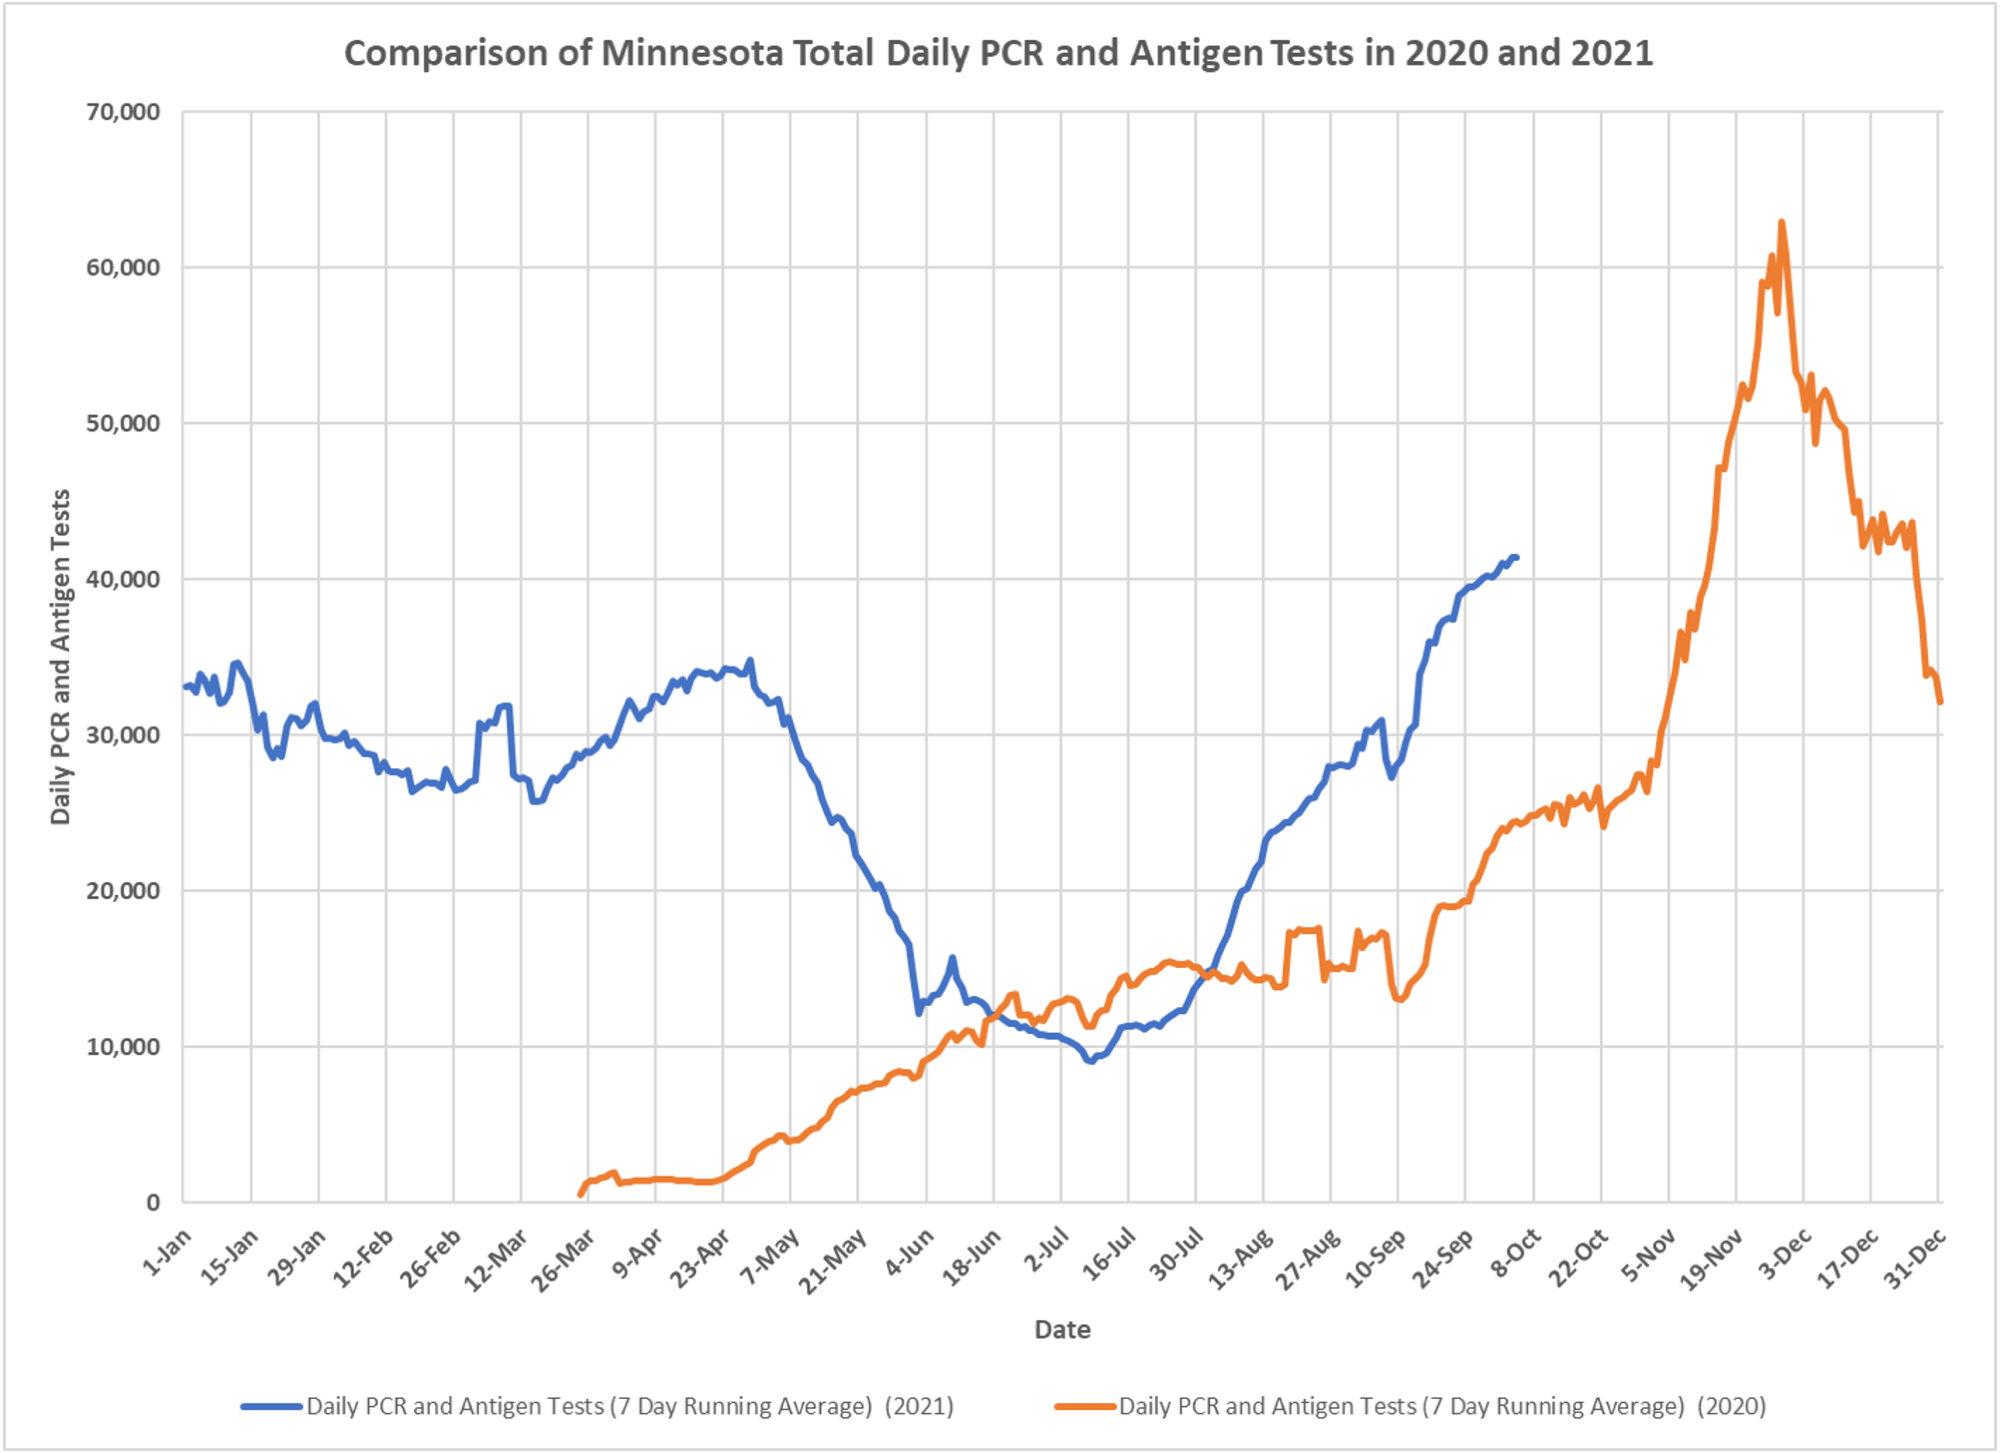
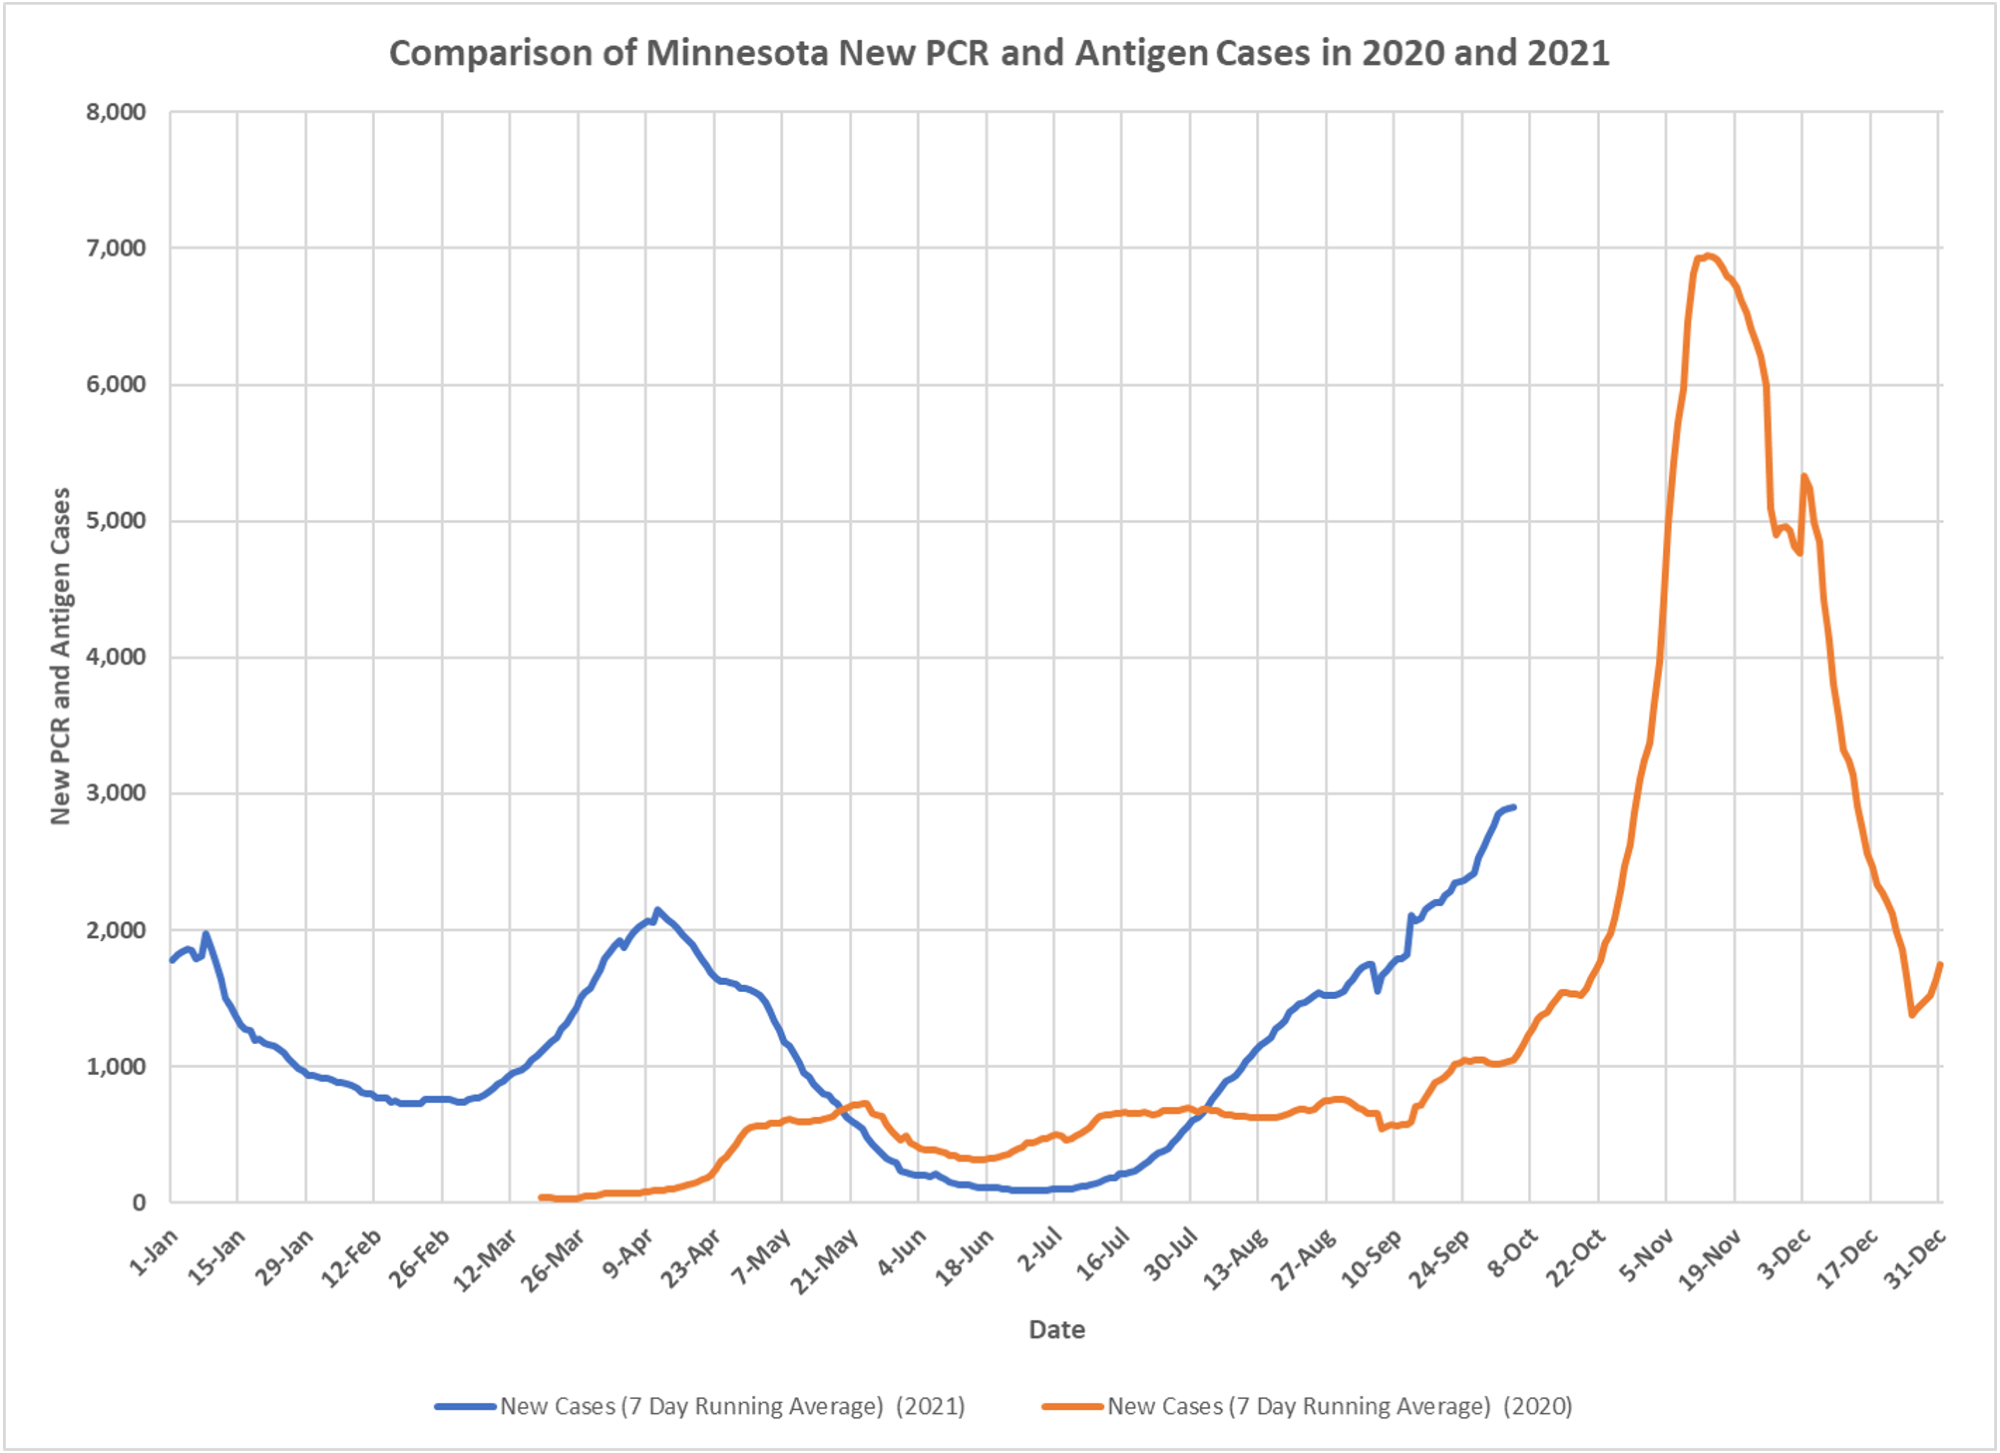
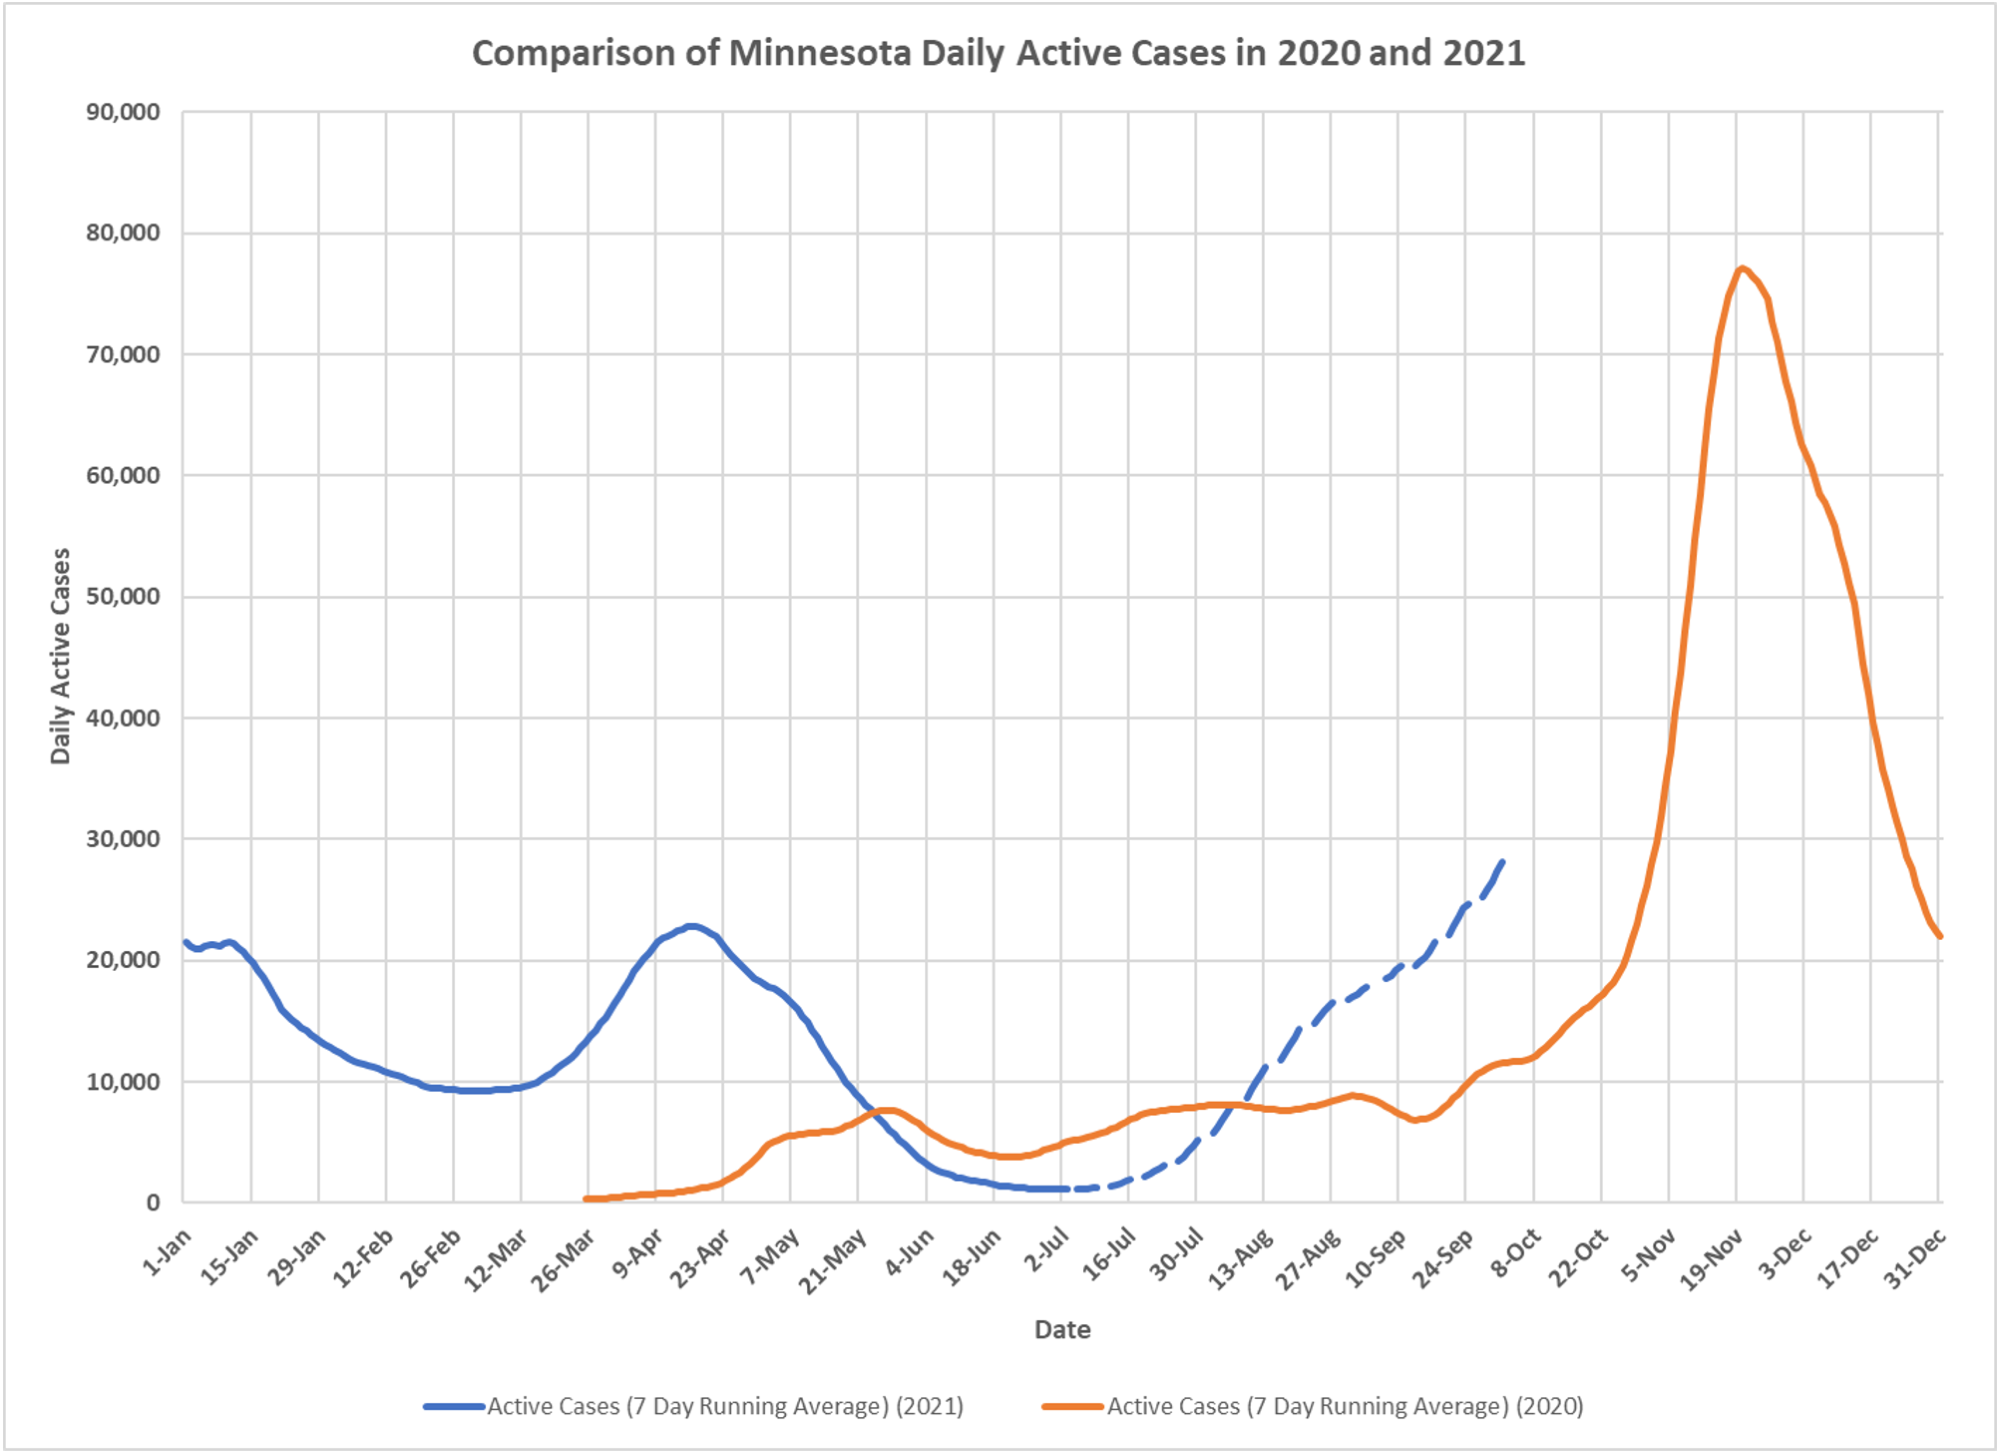
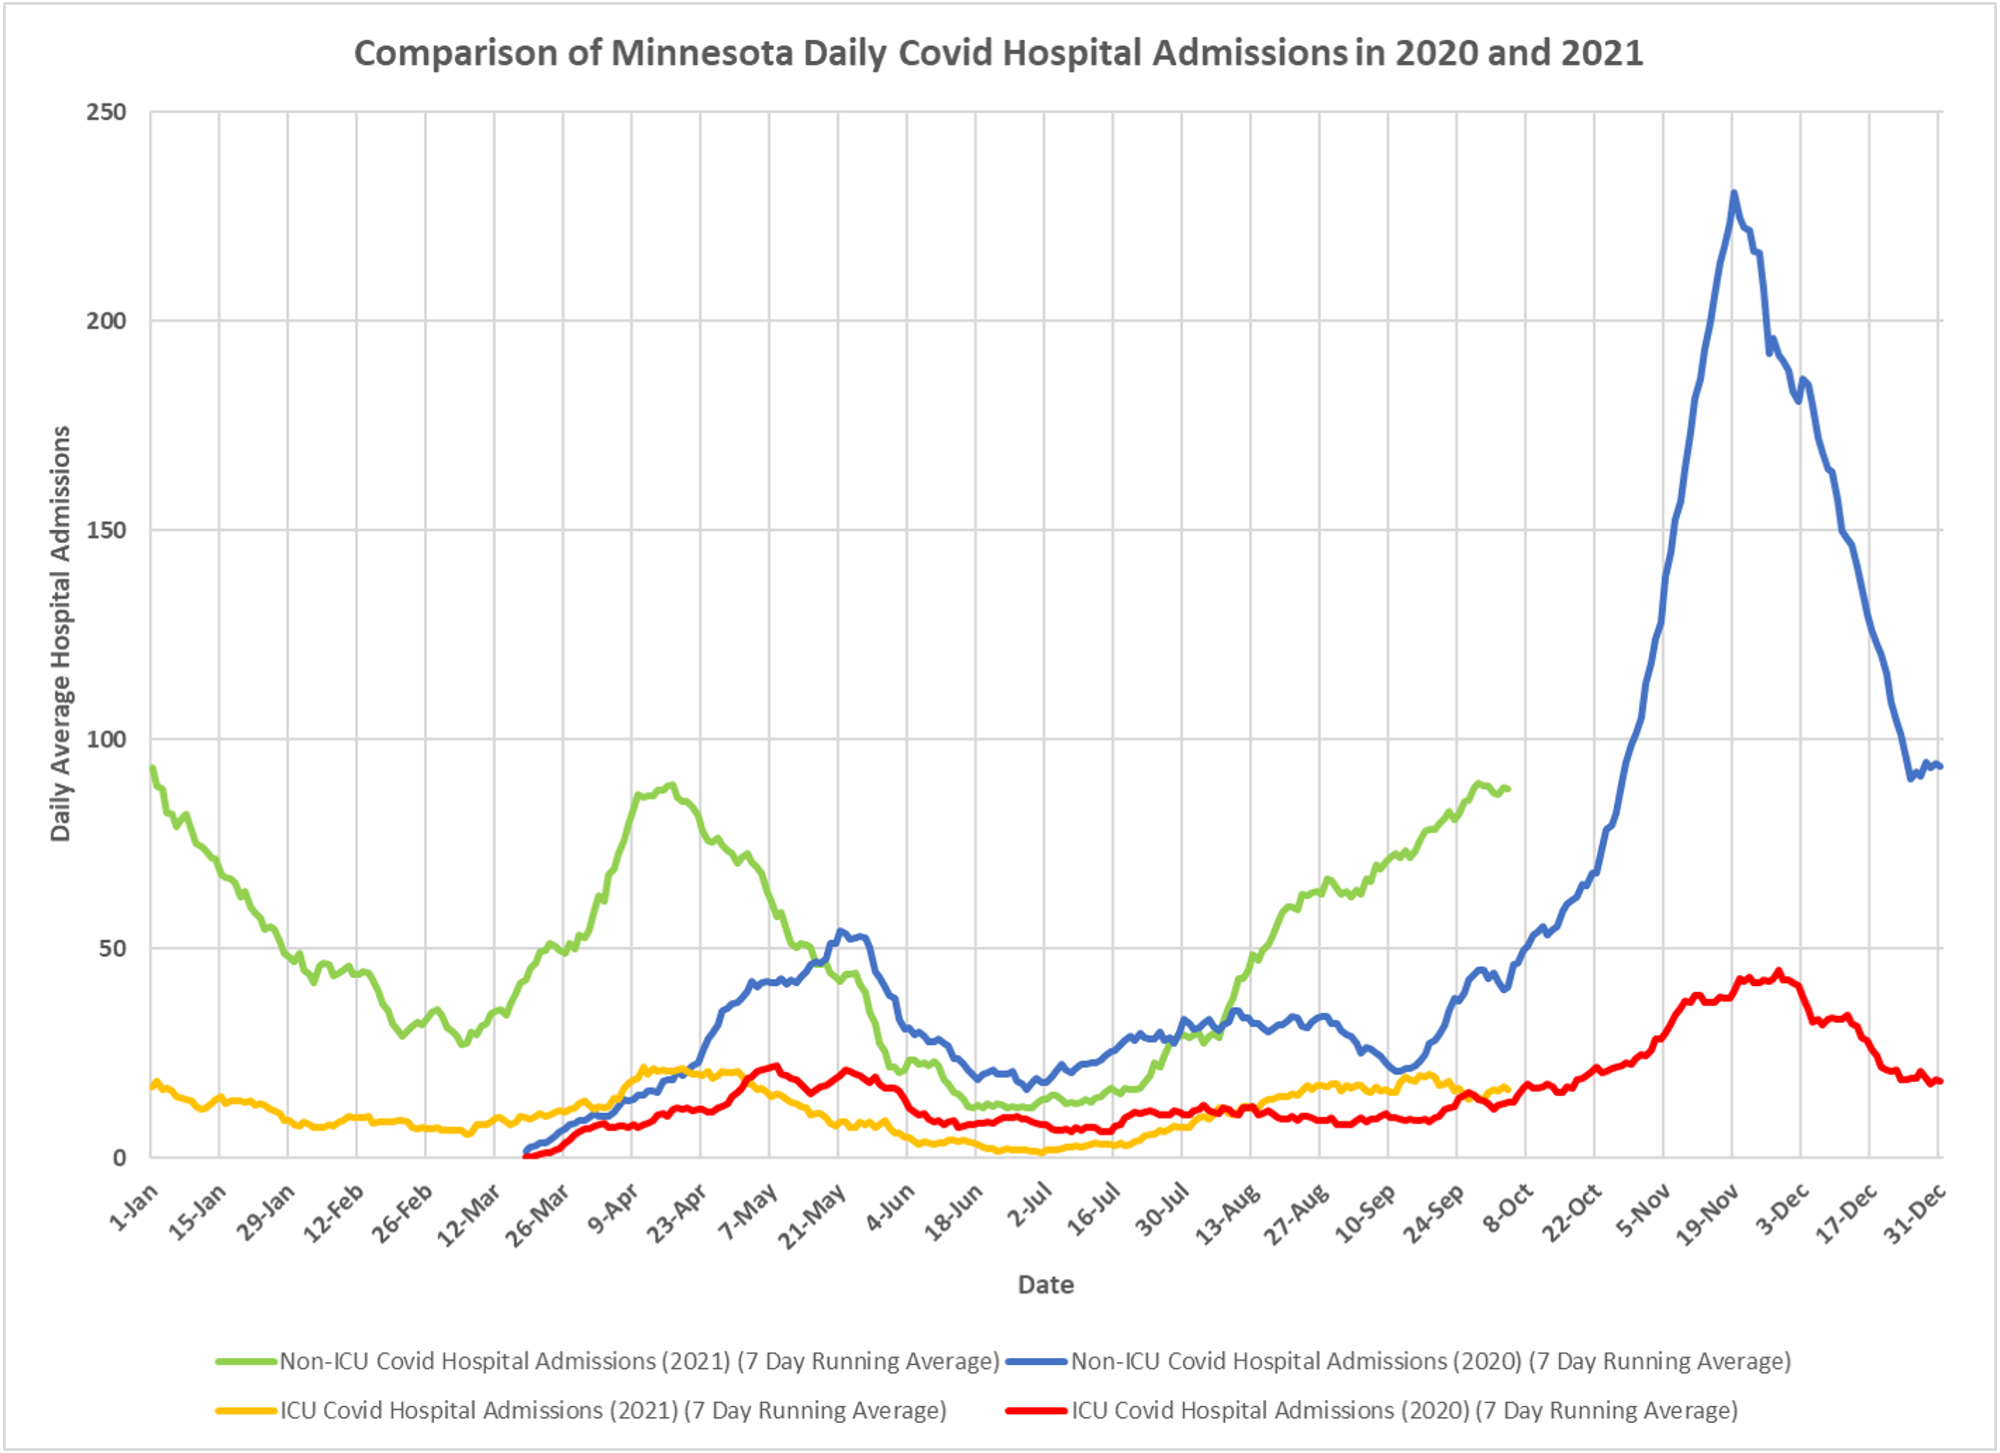
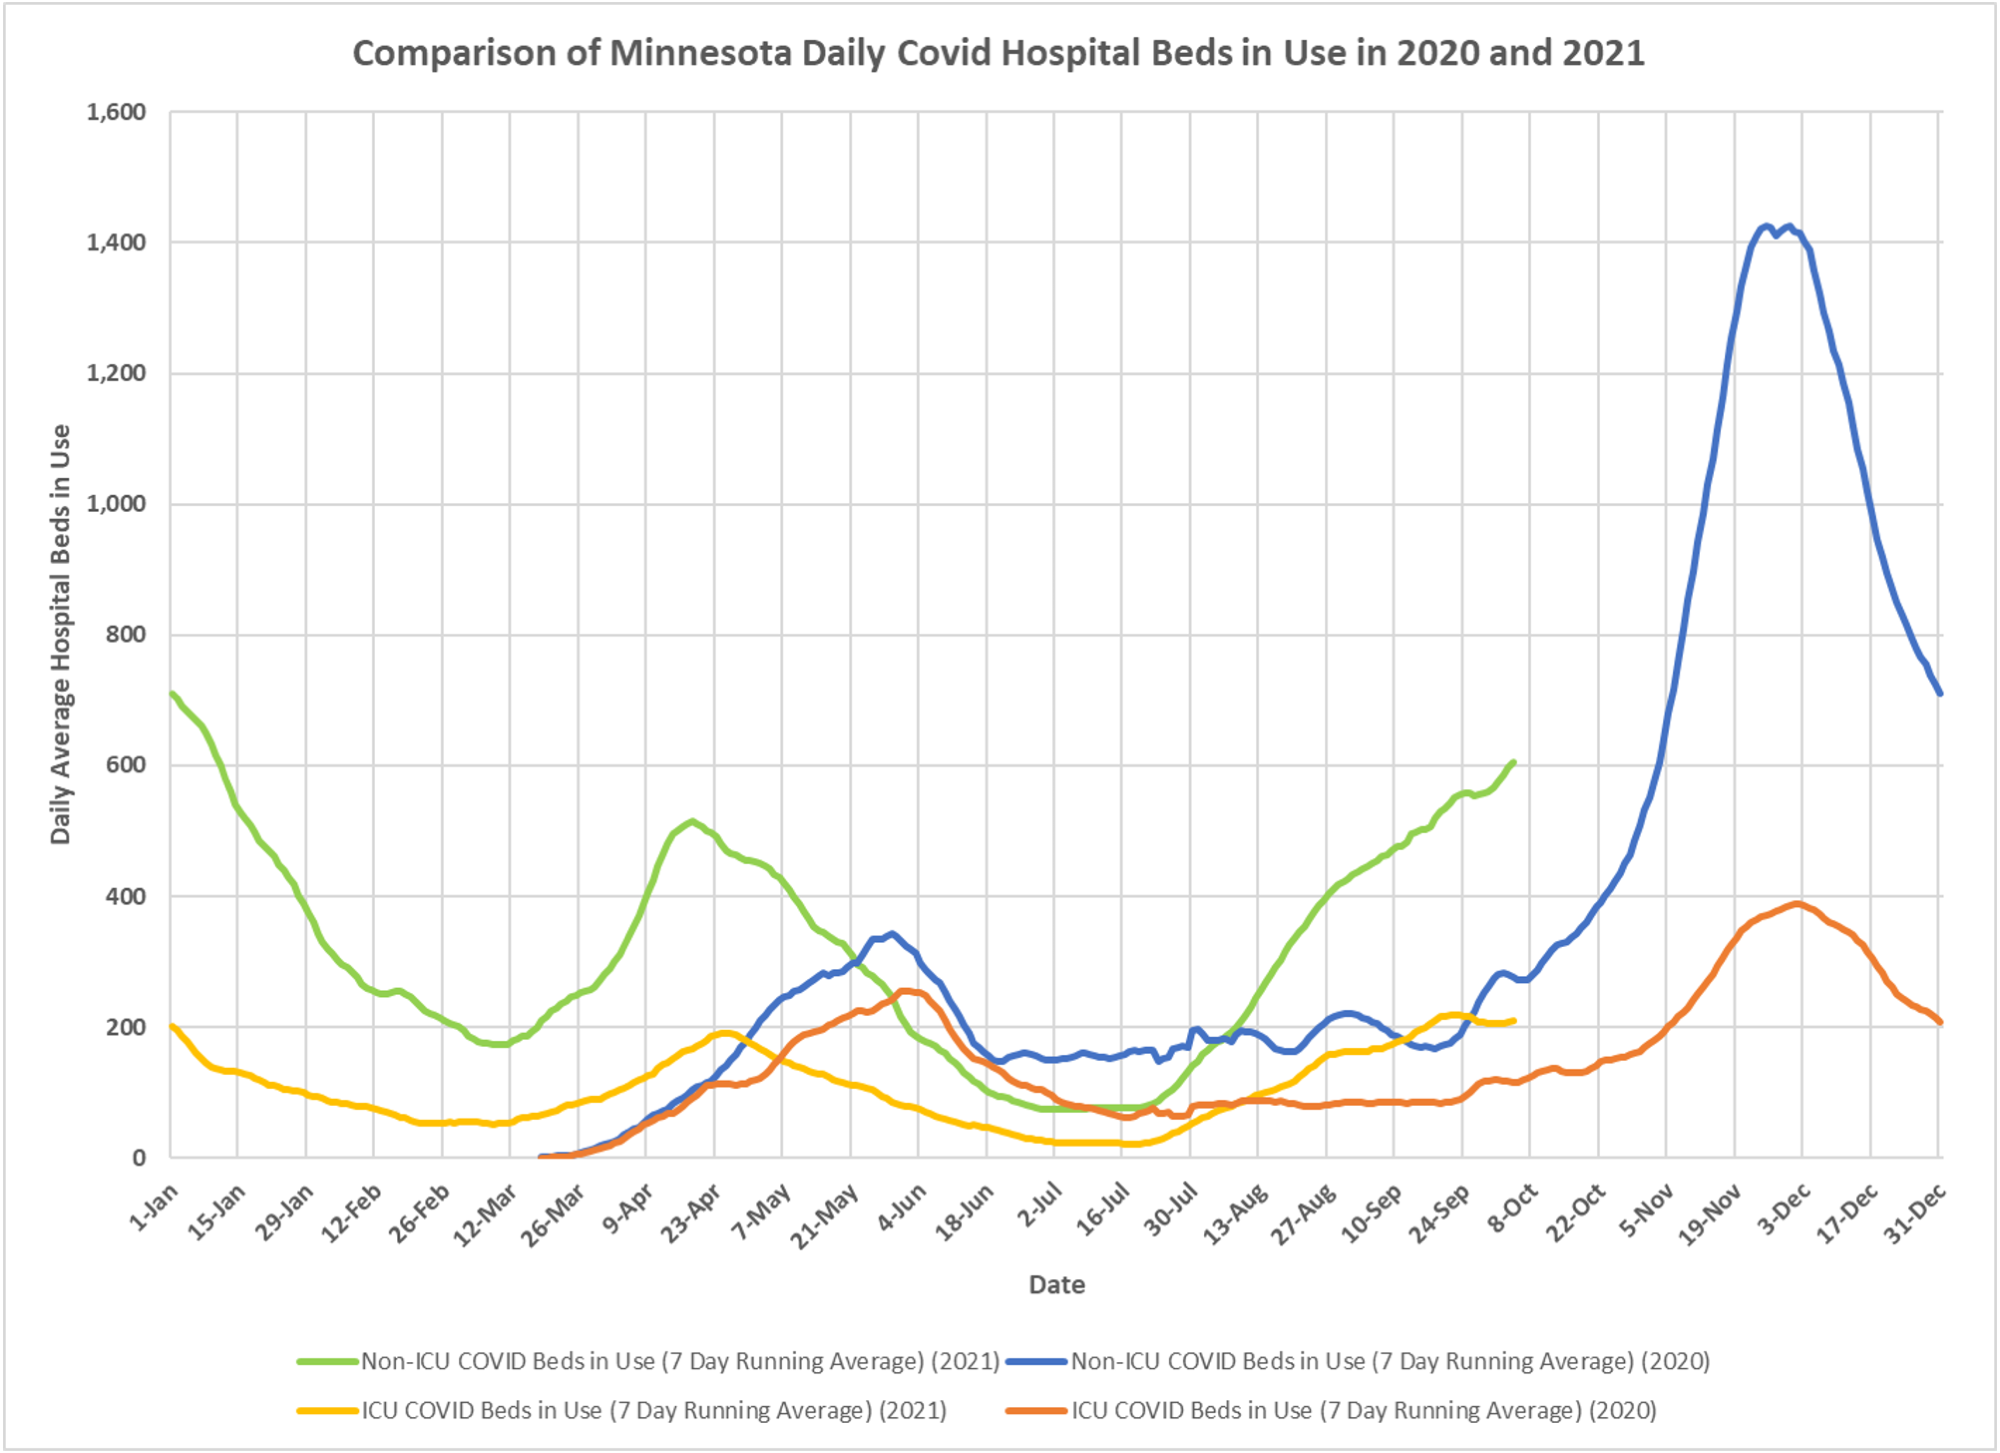
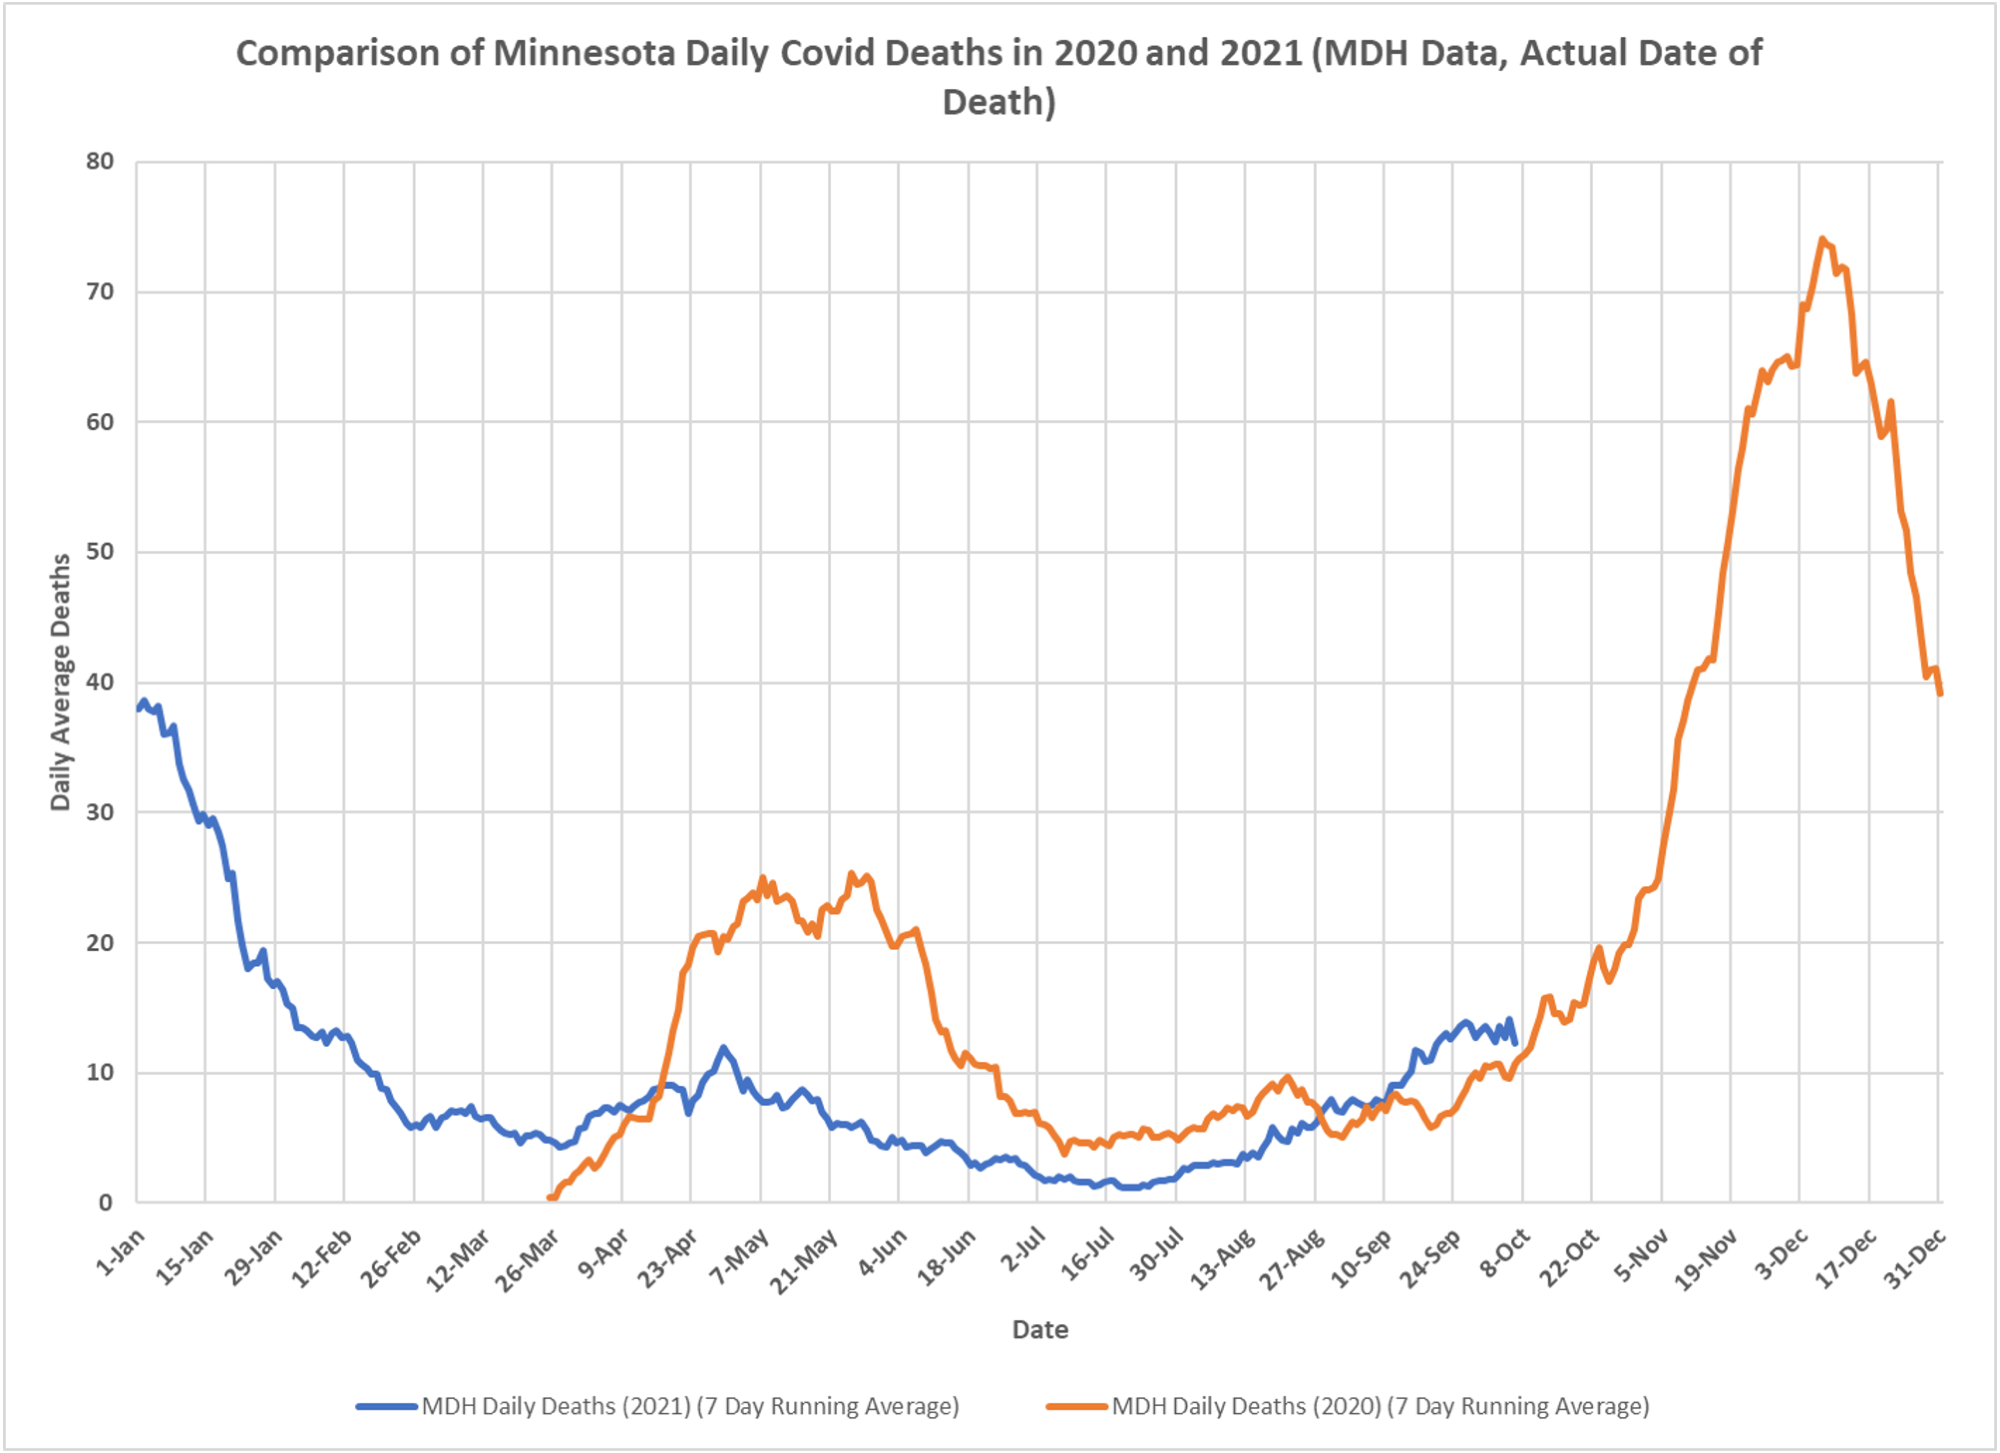
How does this year’s epidemic compare to last year’s? Dave Dixon has the answer with the latest update. You can see testing is up, so cases and active cases are up. Those 3000 non-cases in children 12 and under I mentioned are a big contributor. But hospitalizations are higher than last year as well. Deaths, however, are only modestly up. Based on cases and hospitalizations I would say we are in for a blunted, rounded wave, driven by events among the vaxed.

Harvard Research concludes:
“At the country-level, there appears to be no discernable relationship between percentage of population fully vaccinated and new COVID-19 cases in the last 7 days (Fig. 1). In fact, the trend line suggests a marginally positive association such that countries with higher percentage of population fully vaccinated have higher COVID-19 cases per 1 million people.”
“The sole reliance on vaccination as a primary strategy to mitigate COVID-19 and its adverse consequences needs to be re-examined, especially considering the Delta (B.1.617.2) variant and the likelihood of future variants”
https://covidreason.substack.com/p/harvard-research-confirms-what-weve?r=47cvb&utm_campaign=post&utm_medium=web&utm_source=
Prediction: we are not in for a blunted wave in the upper midwest. Our spikes in cases, hospitalizations and deaths will be higher than last year. Just look at what happened in the south with their latest peak. Why would the north be any different? From personal observation, COVID is starting to explode here in ND. Vaccinated or not, it’s going around like crazy. Cold and flu season has arrived. Just finally got cold and dark, so everyone is spending more time indoors and Vitamin D levels are dropping.