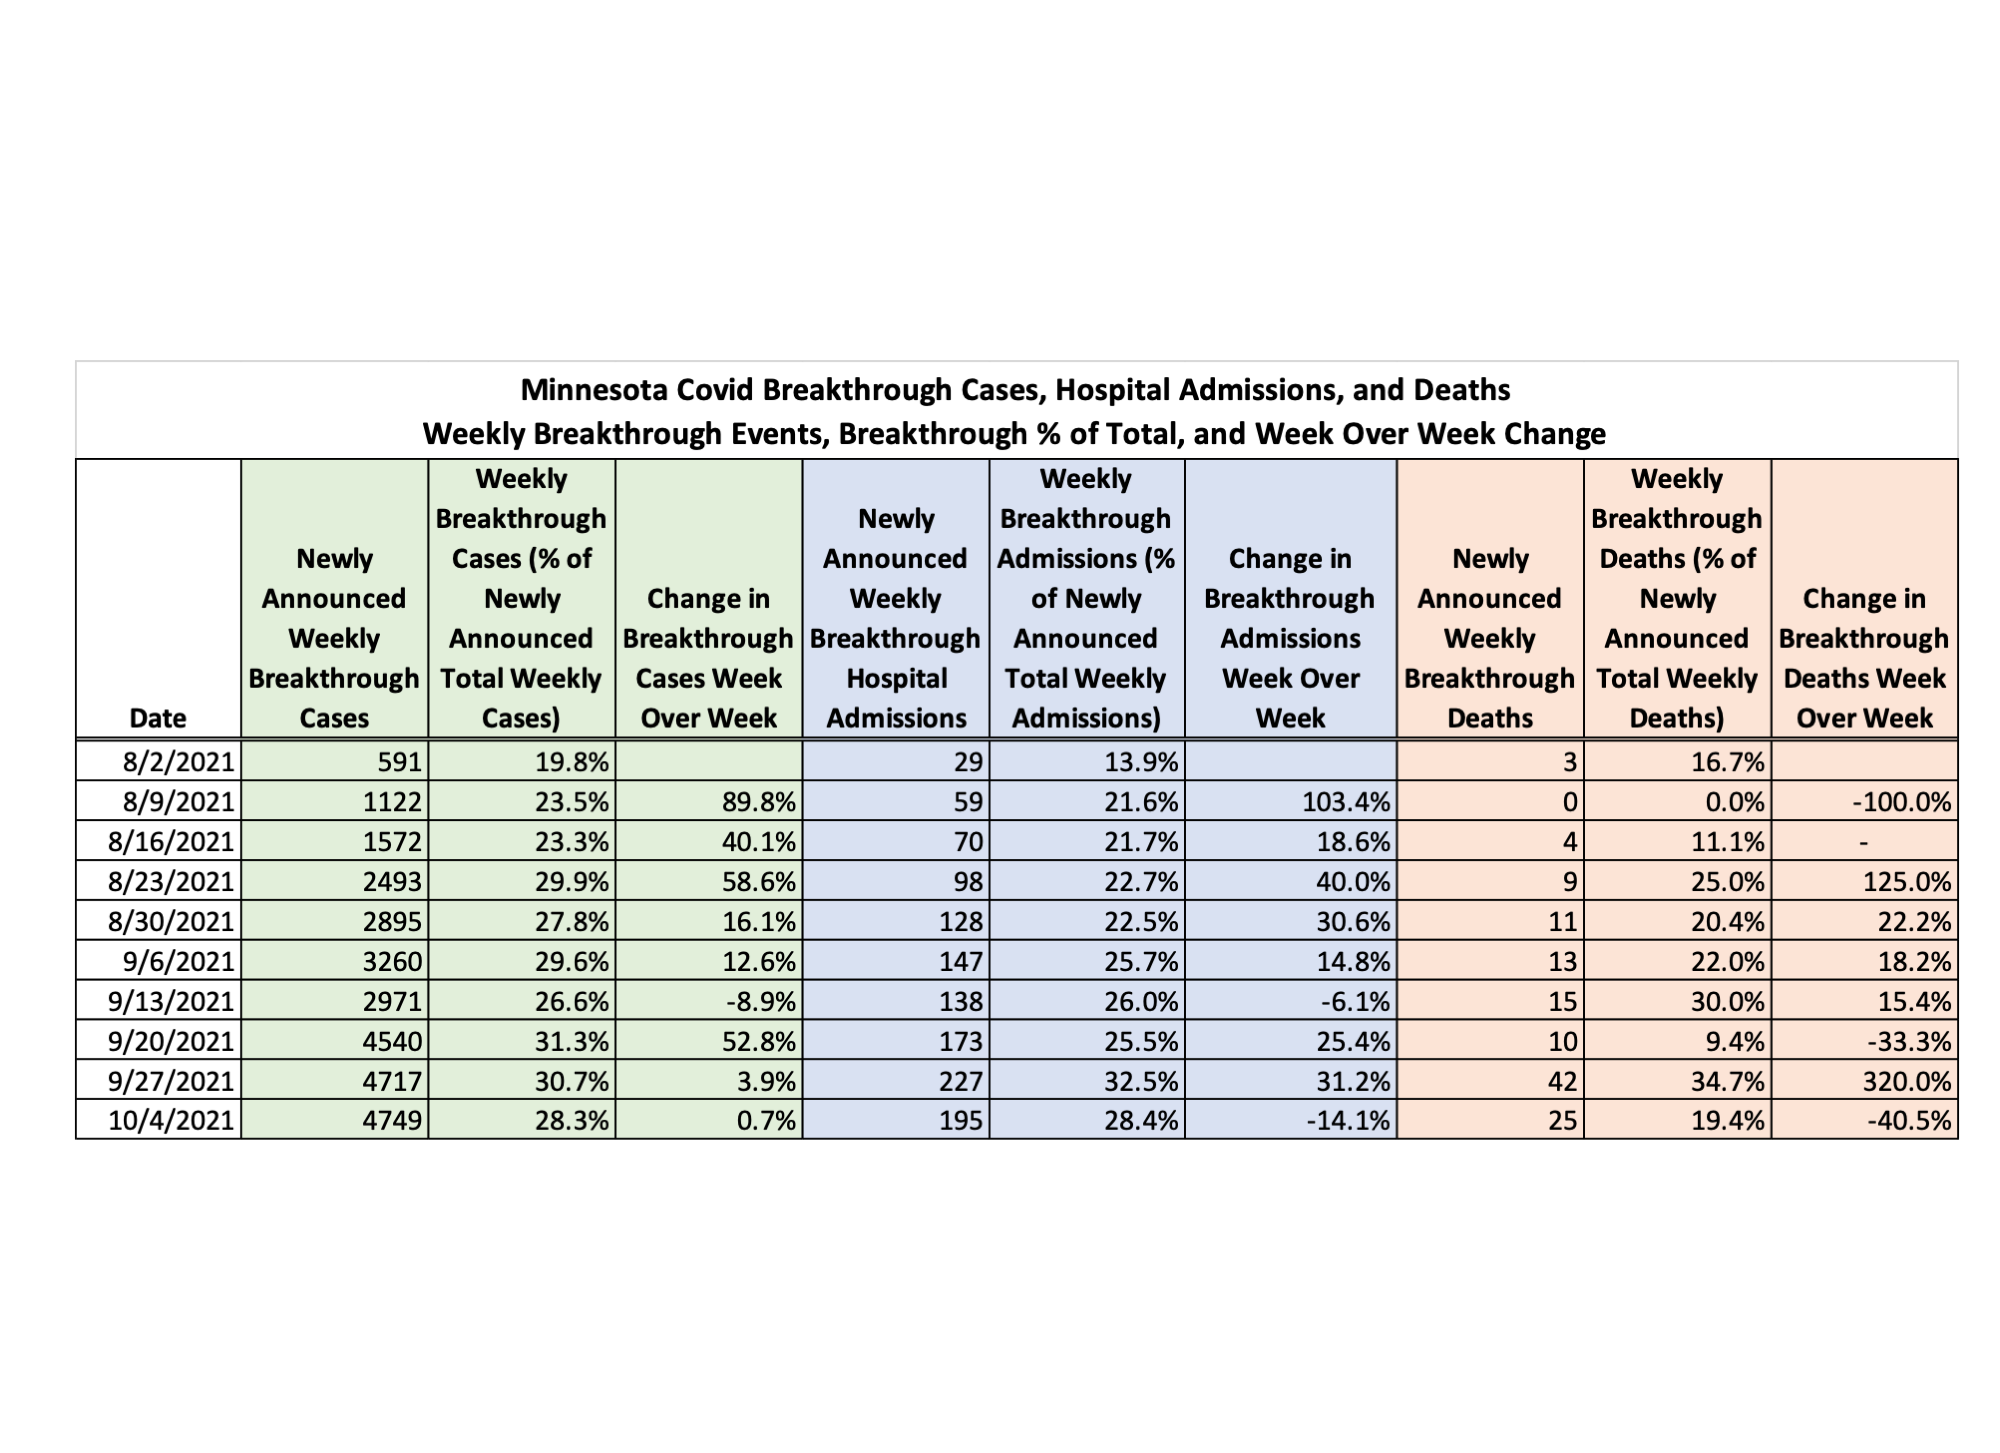
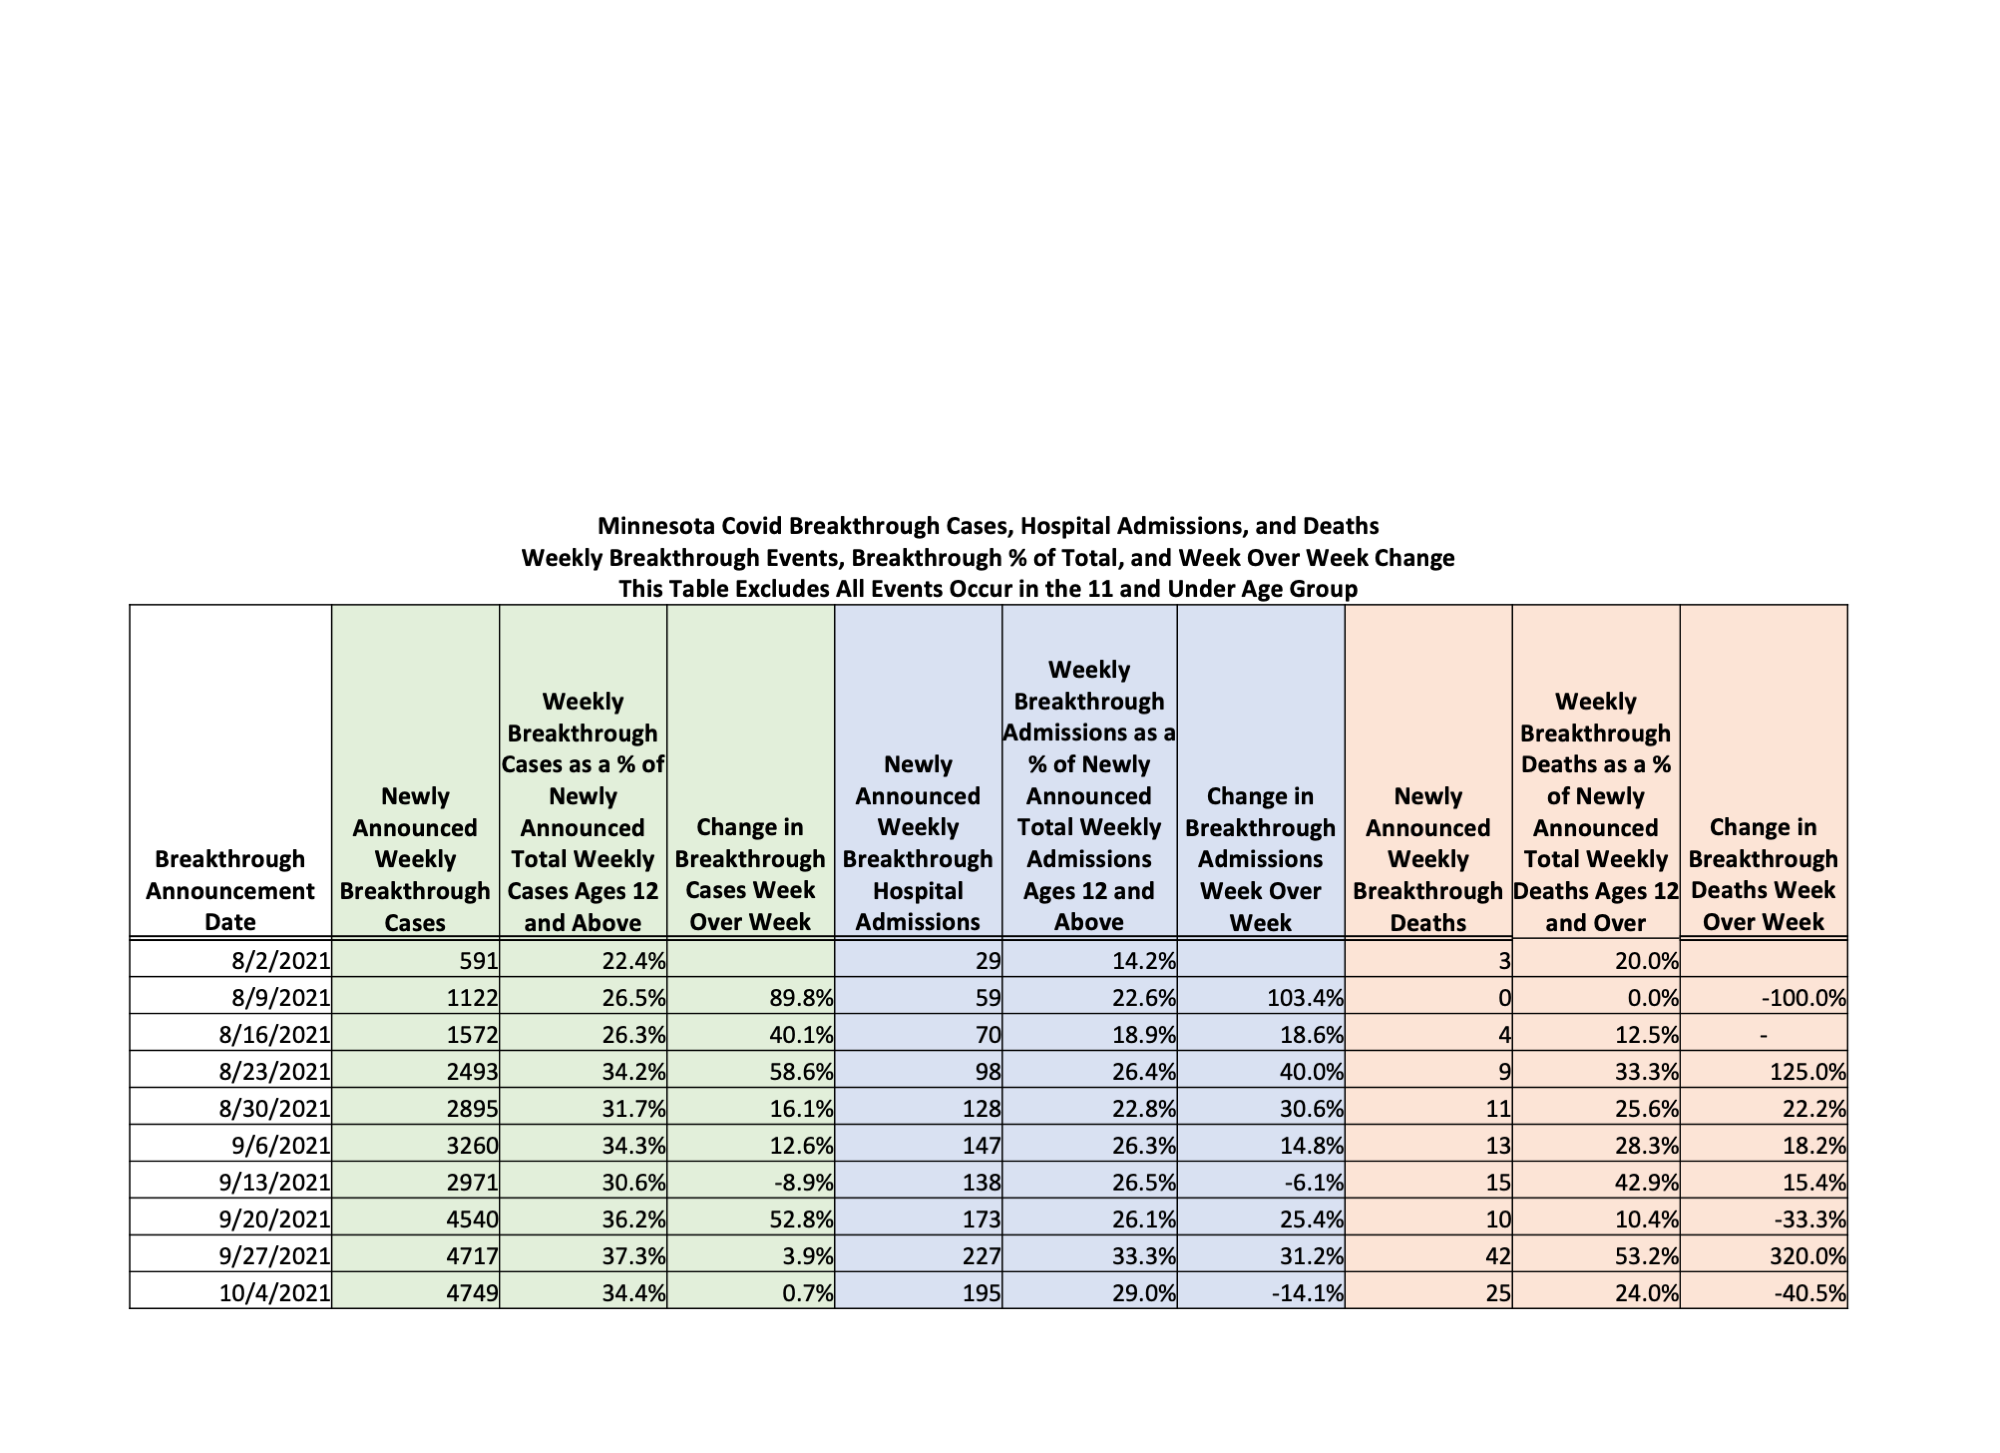
The state is refusing so far to give clear information on the current proportion of events that are breakthrough. We are doing our best to figure out the reporting lag. In the meantime, Dave Dixon and I thought even the date of report data can help with trend identification. This chart is wonderful and shows for each week that the state has been reporting breakthrough events, the proportion that those breakthrough events represent of all events. You can see the rates over time and rate of change in those rates. The second version attempts to remove the age 12 and under group, since they are not eligible for vaccines and there therefore cannot be breakthrough events in that age group. Changes the percents a little. Remember that the state is doing the best it can to drag its feet on identifying breakthrough events and is unable to fully account for who really is vaxed, so these are undercounts in all likelihood.