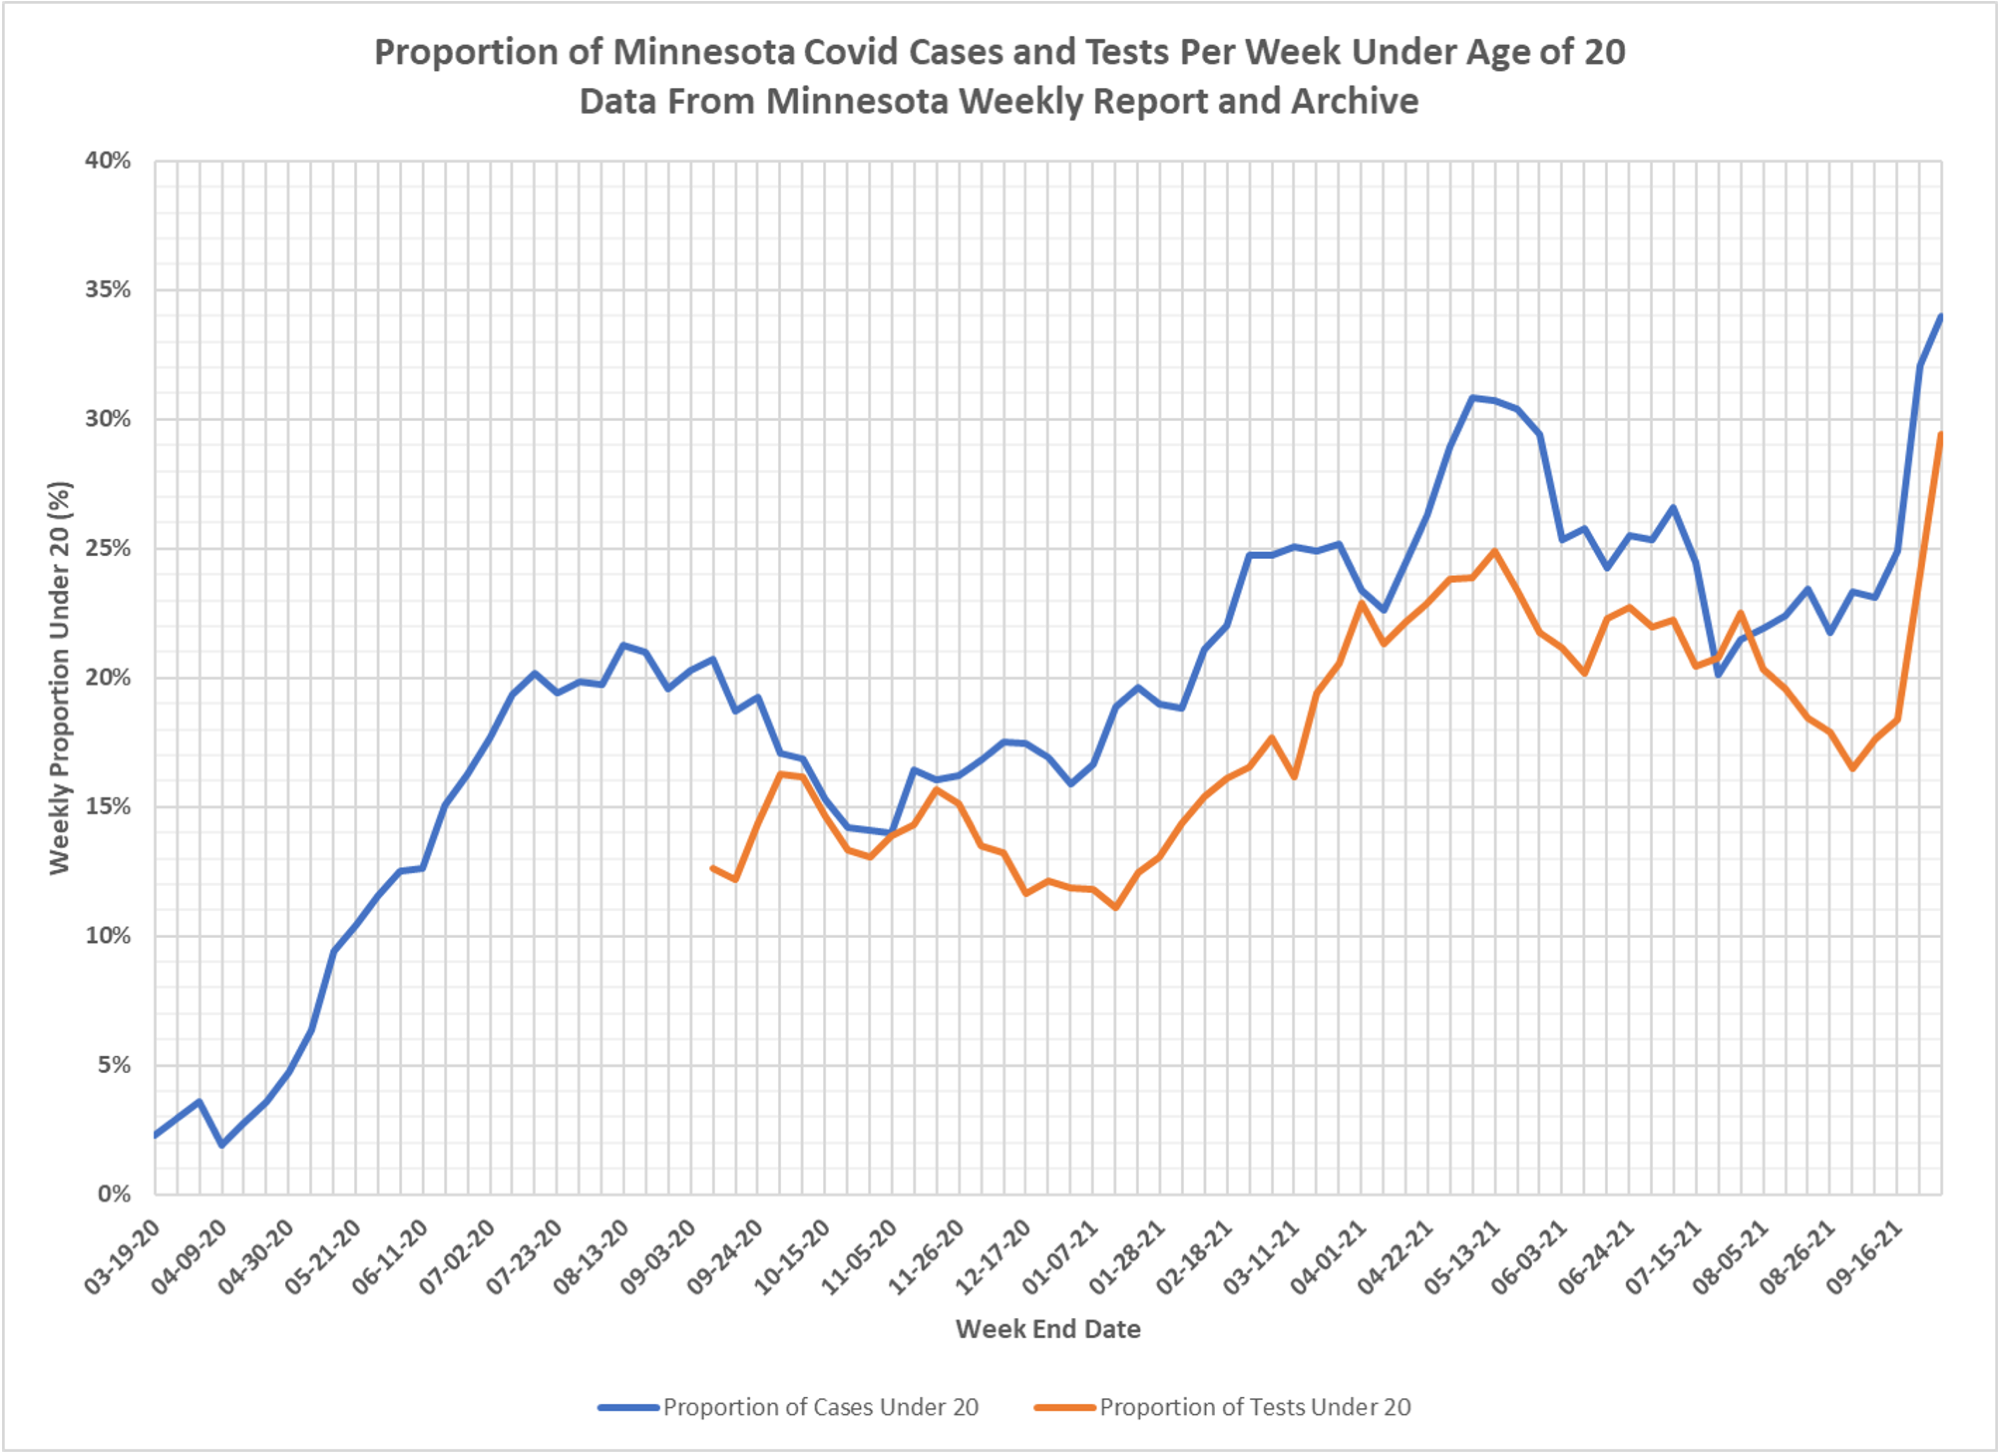
This chart very clearly shows the effect of school being in session and excessive testing occurring that then finds “cases”, by looking at the proportion of all testing and cases that are occurring in those young age groups. All bullshit. This rise in testing in the young is solely responsible for the apparent rise in cases or continued plateauing. More of Dave Dixon’s work.