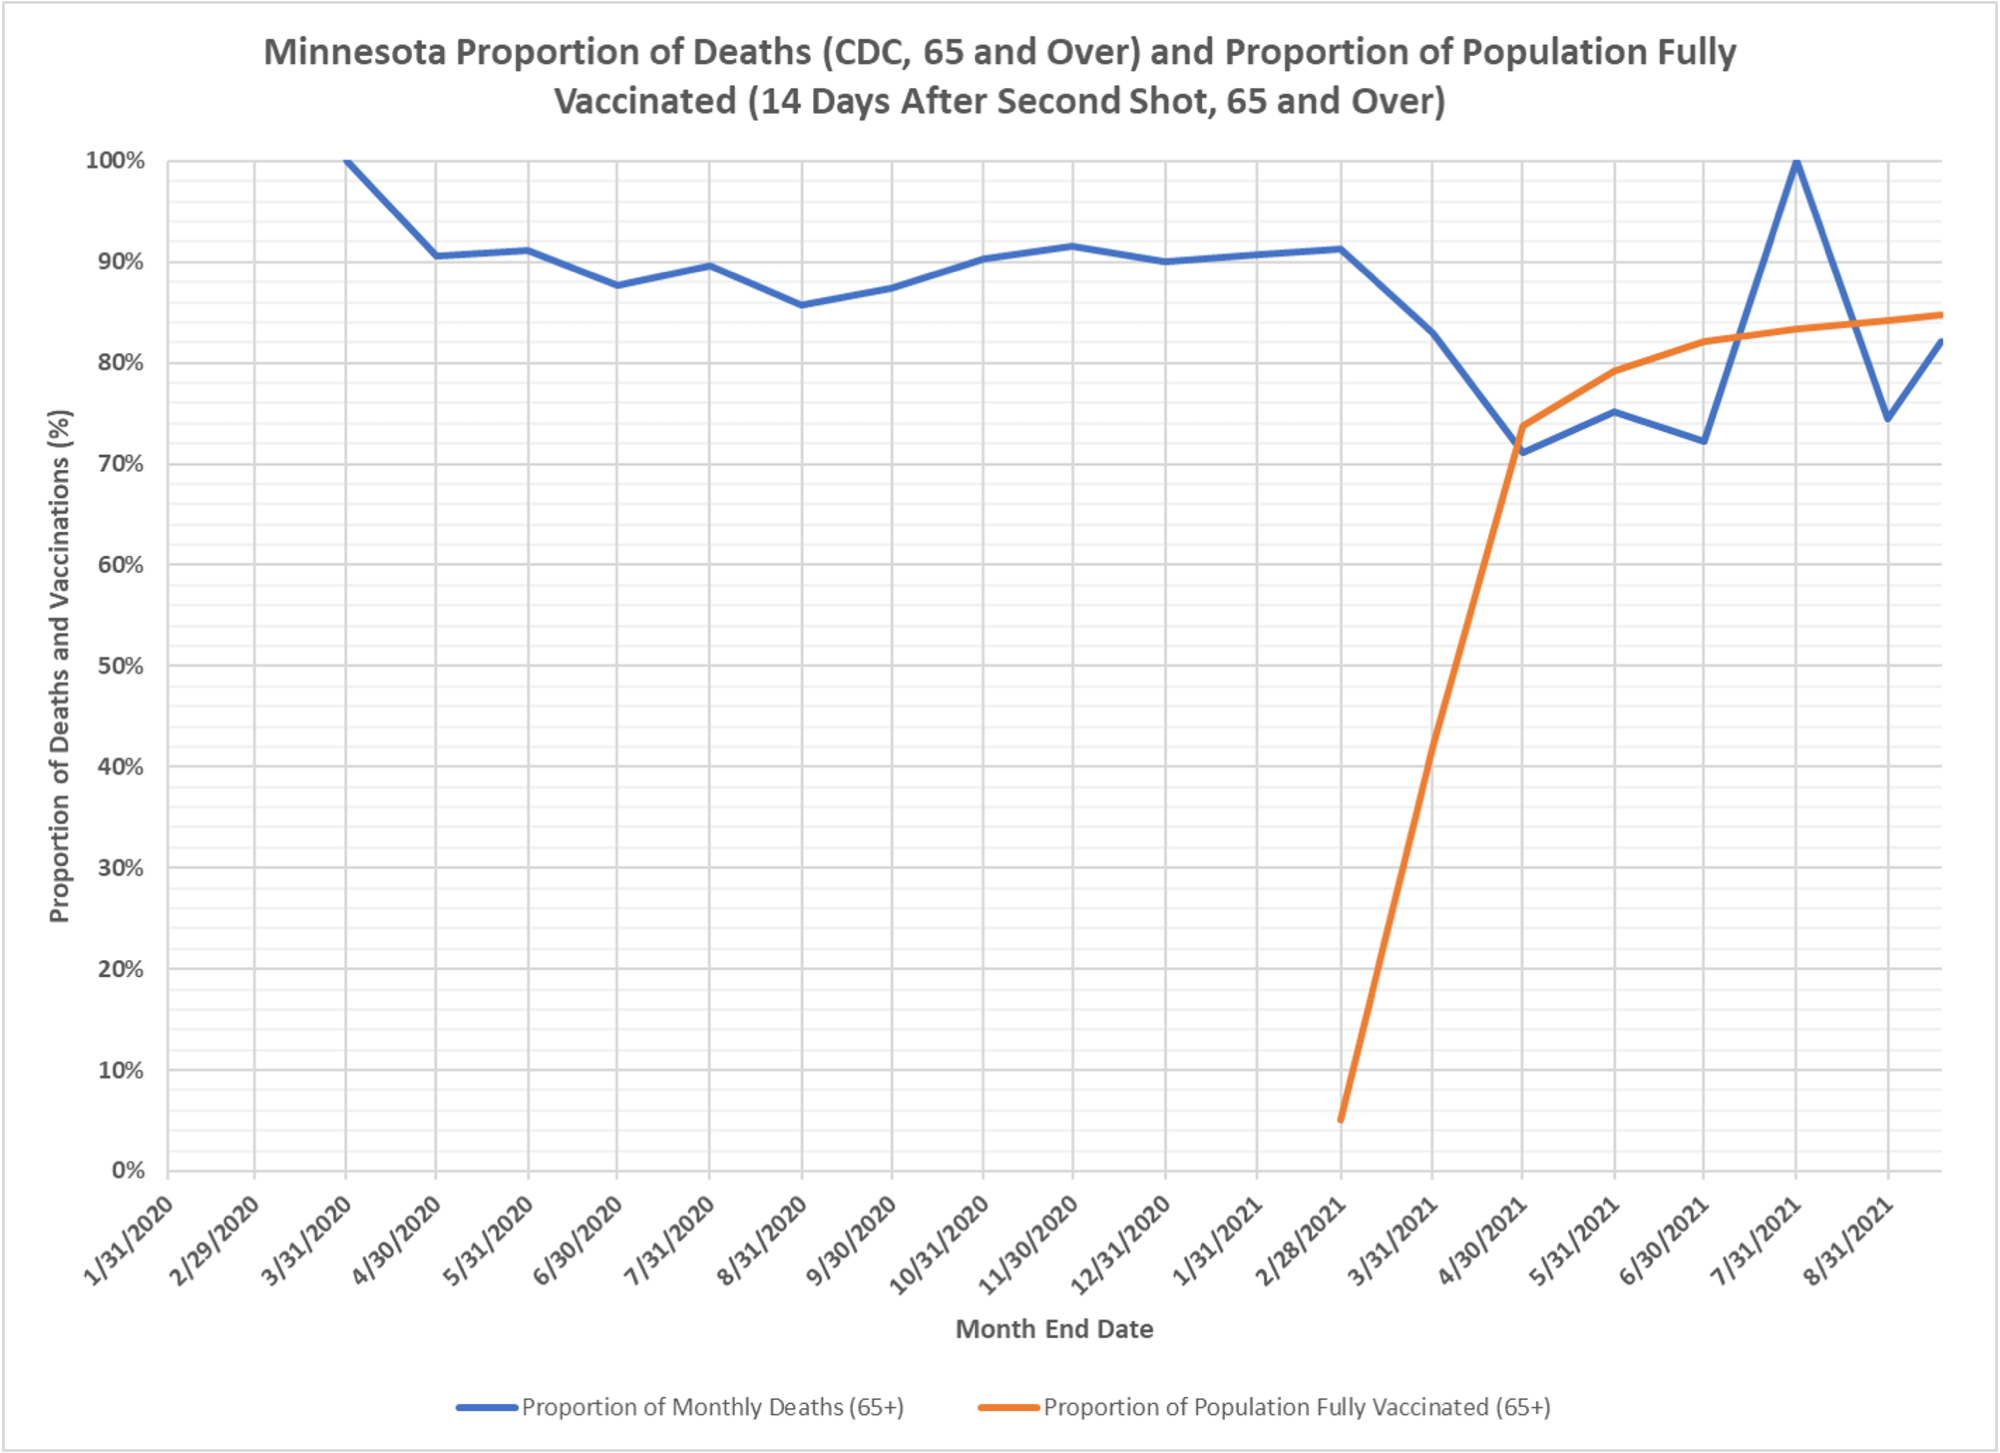
Nothing is easy working with CV-19 data. Dave Dixon and I thought it might be useful to see any trends in the proportion of deaths in the 65 plus age group. You need deaths by date to do that. Minnesota has that in general, but in the weekly report where deaths are broken out by age, date of report is still being used. I have no idea why. So Dave has used CDC data, which doesn’t break out age very well, but at least is by date of death, to come up with the best chart we can. We hypothesized that vaccinations, which initially were concentrated in the elderly, would drop their proportion of deaths for some period of time. If you look at the chart, that does seem to have happened for a while, but it appears to be returning to the pre-vax level. Despite very high vax levels in this group, in September we will see the proportion of deaths back to the prior level.