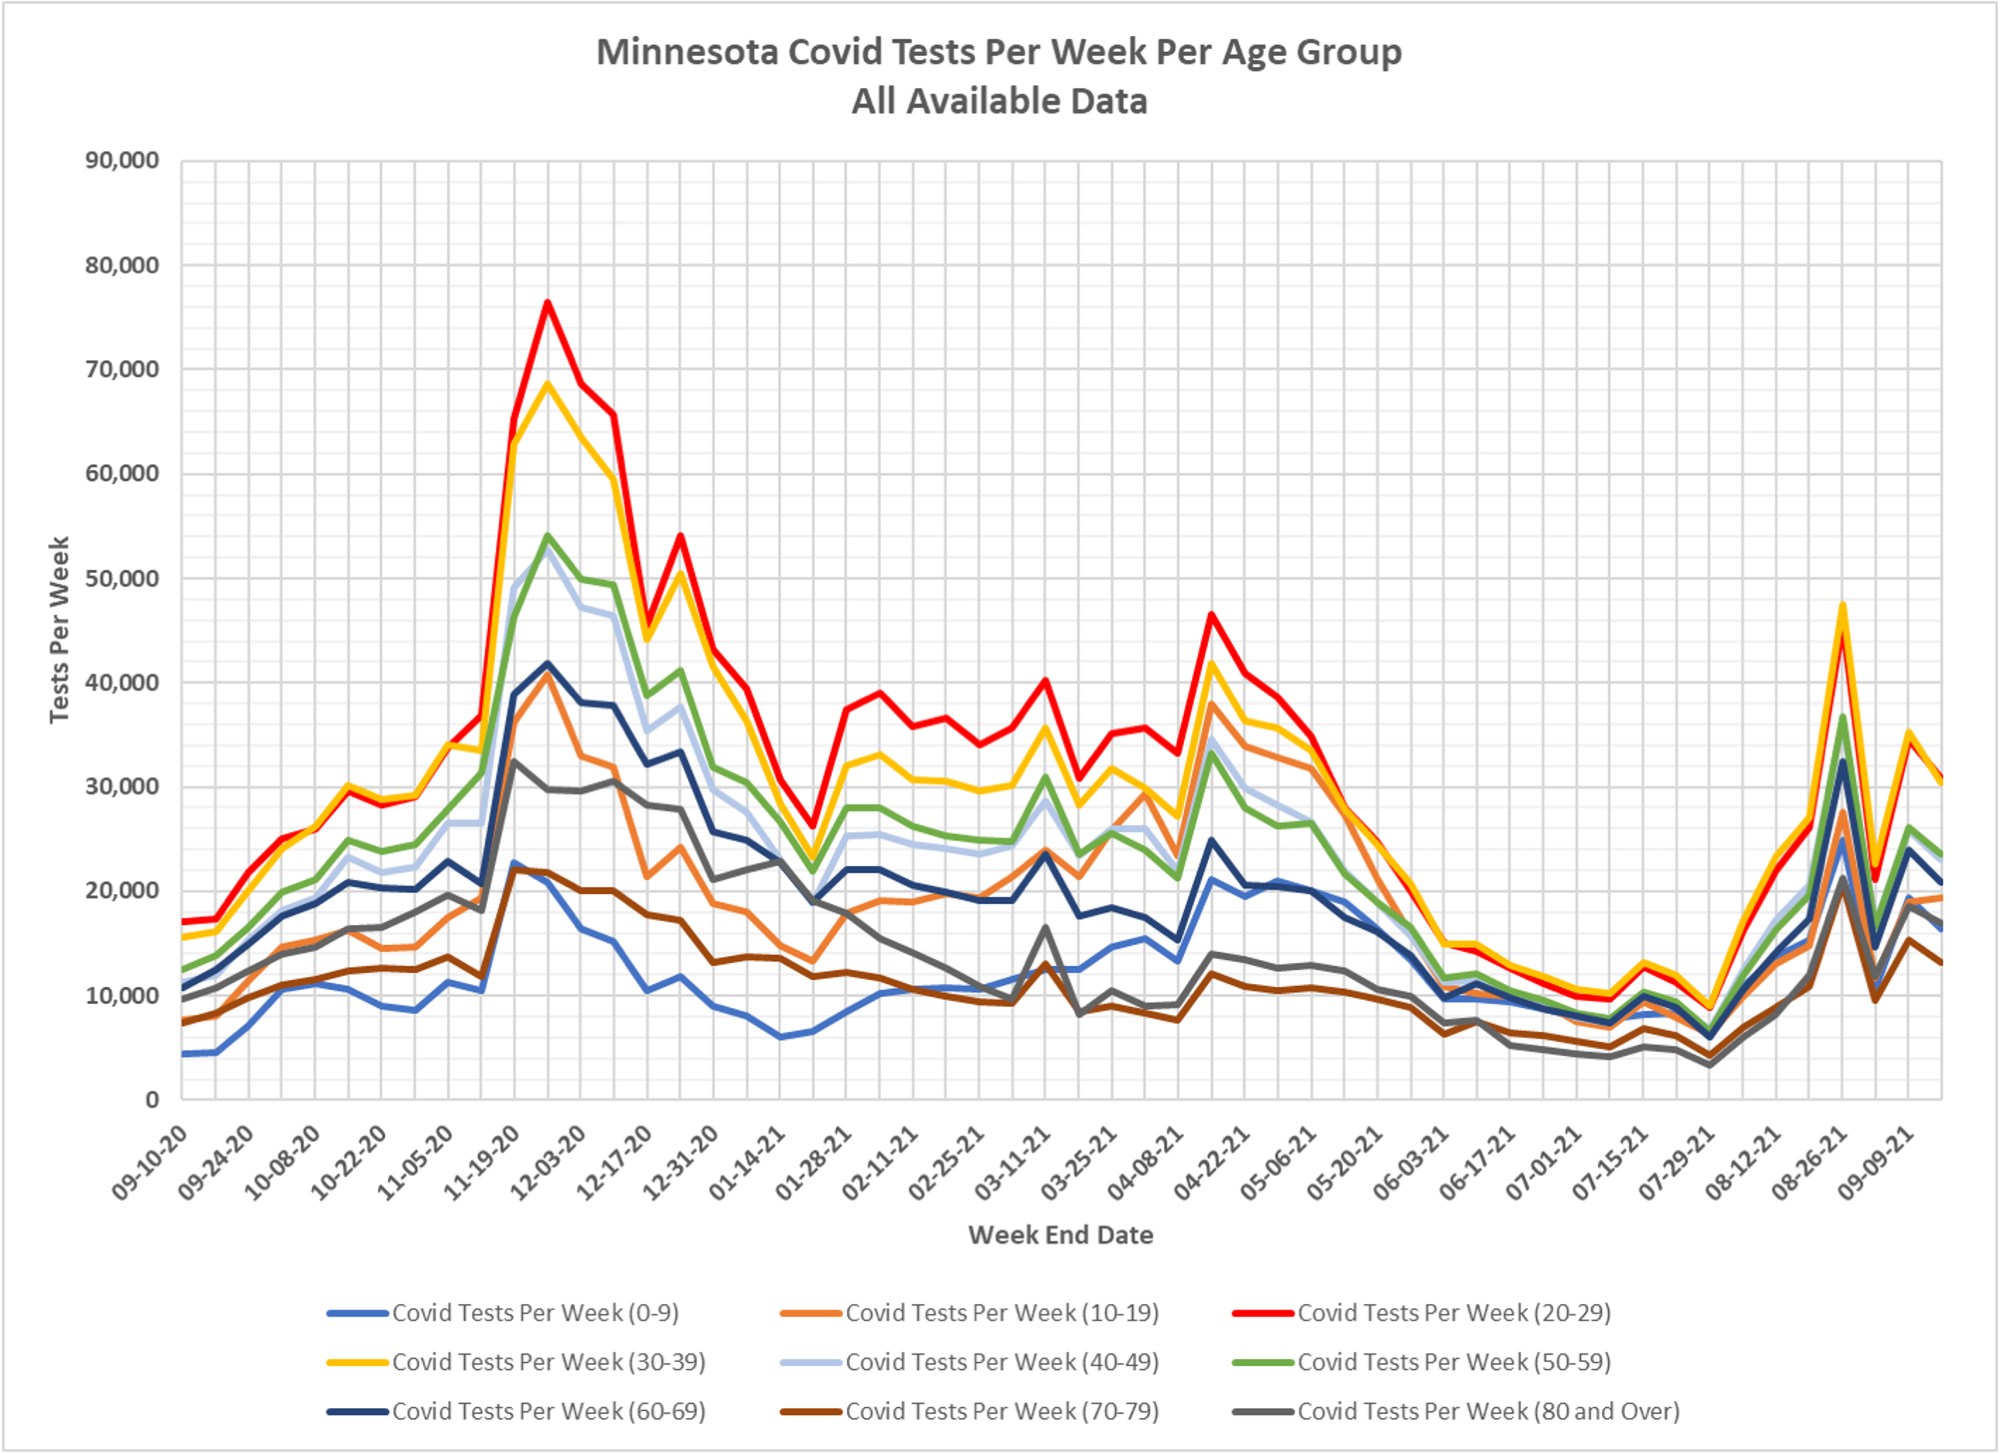
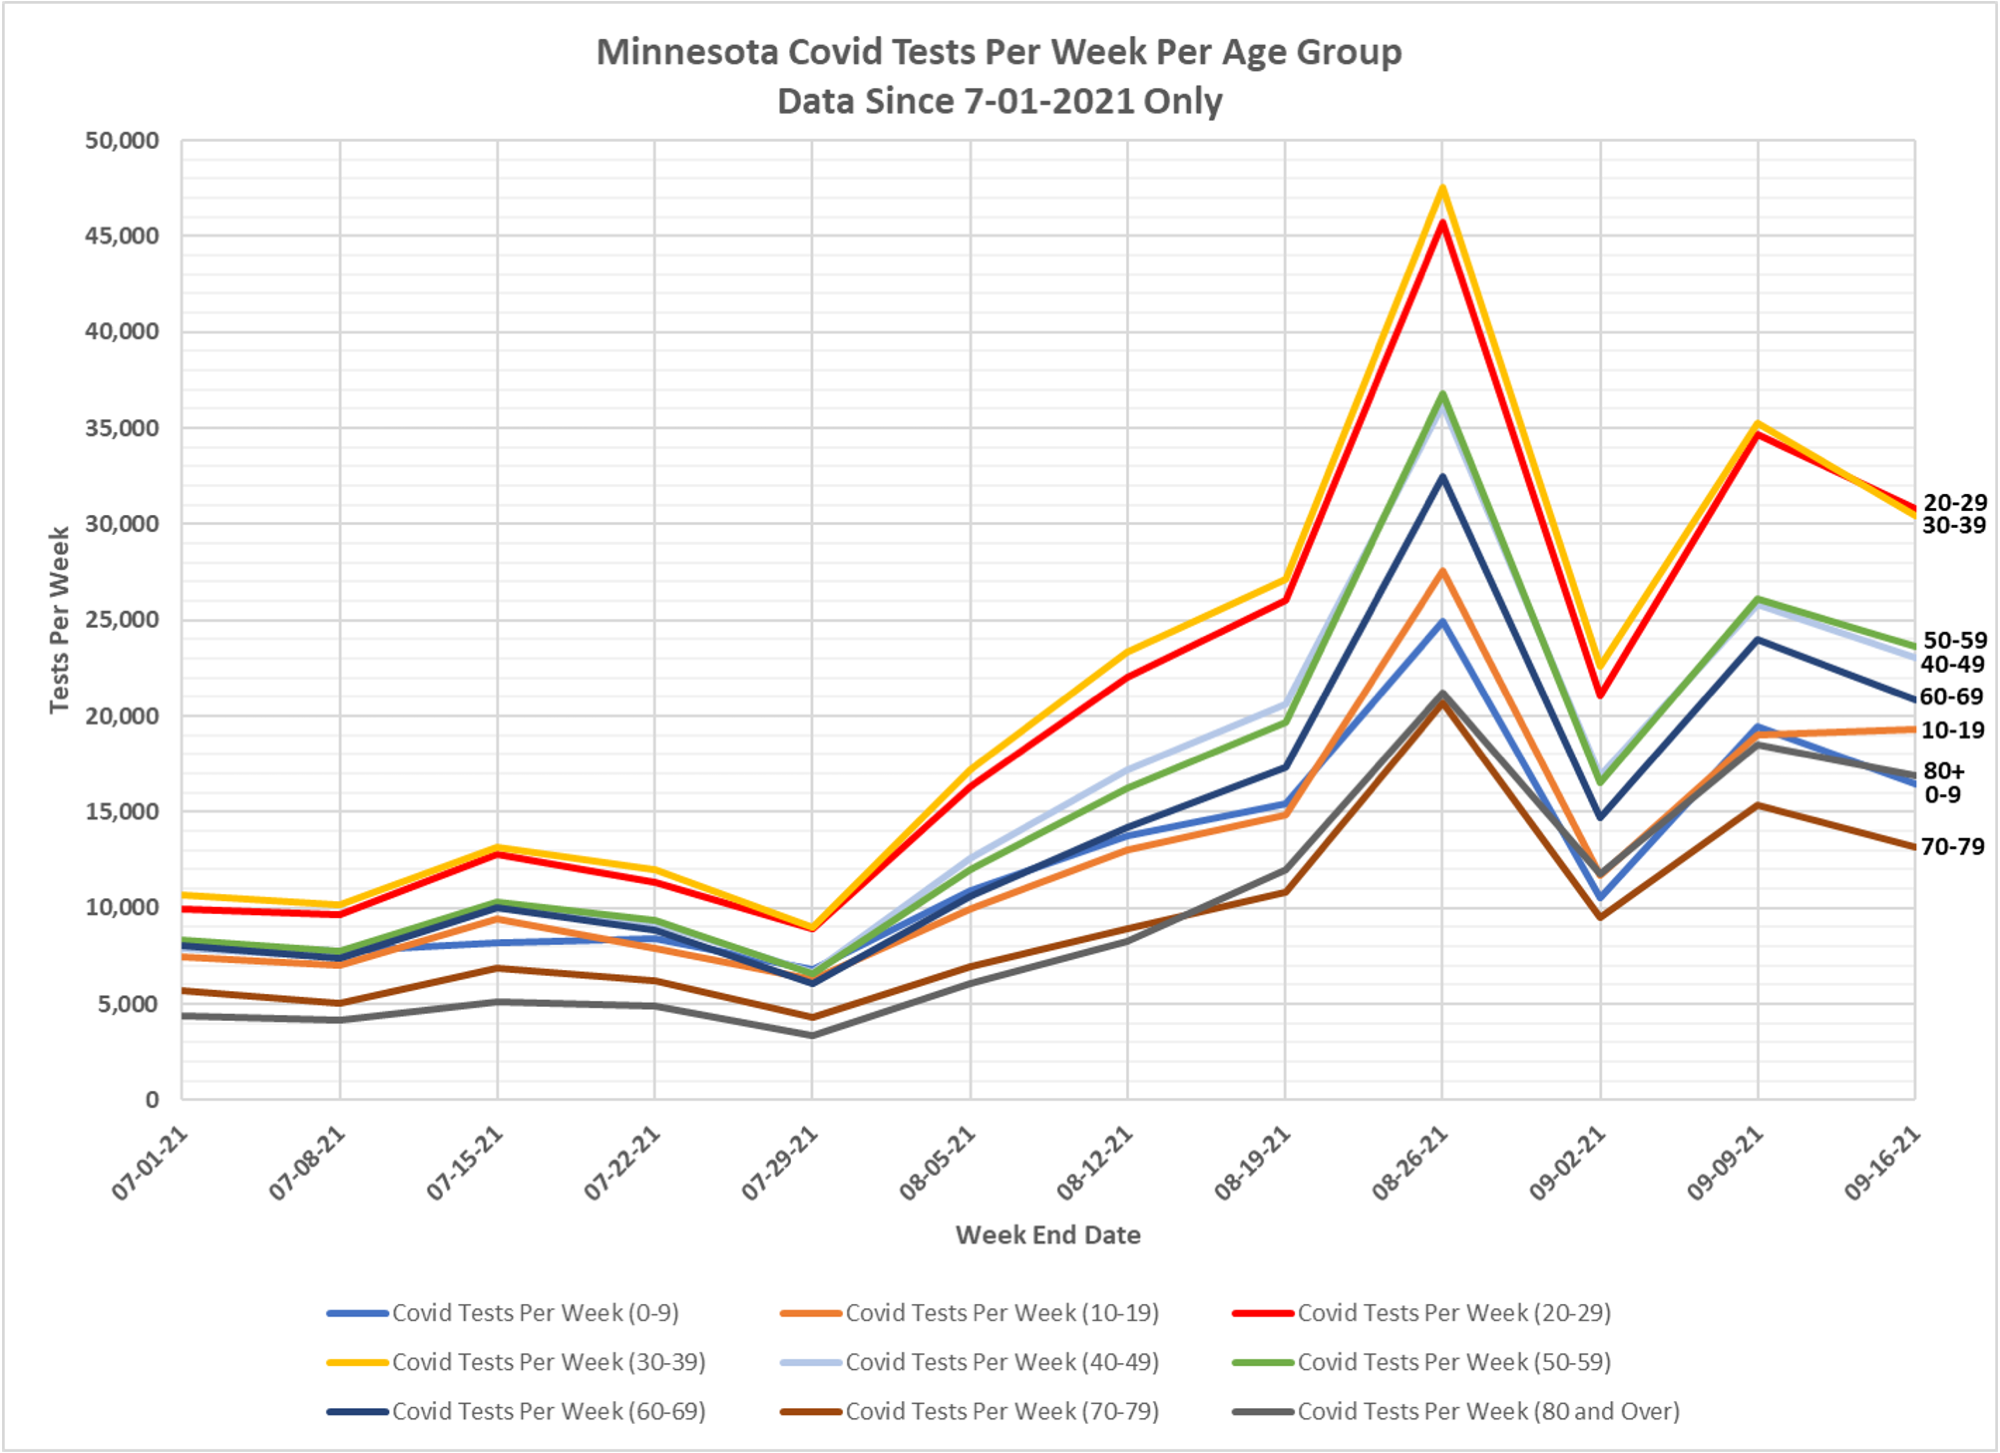
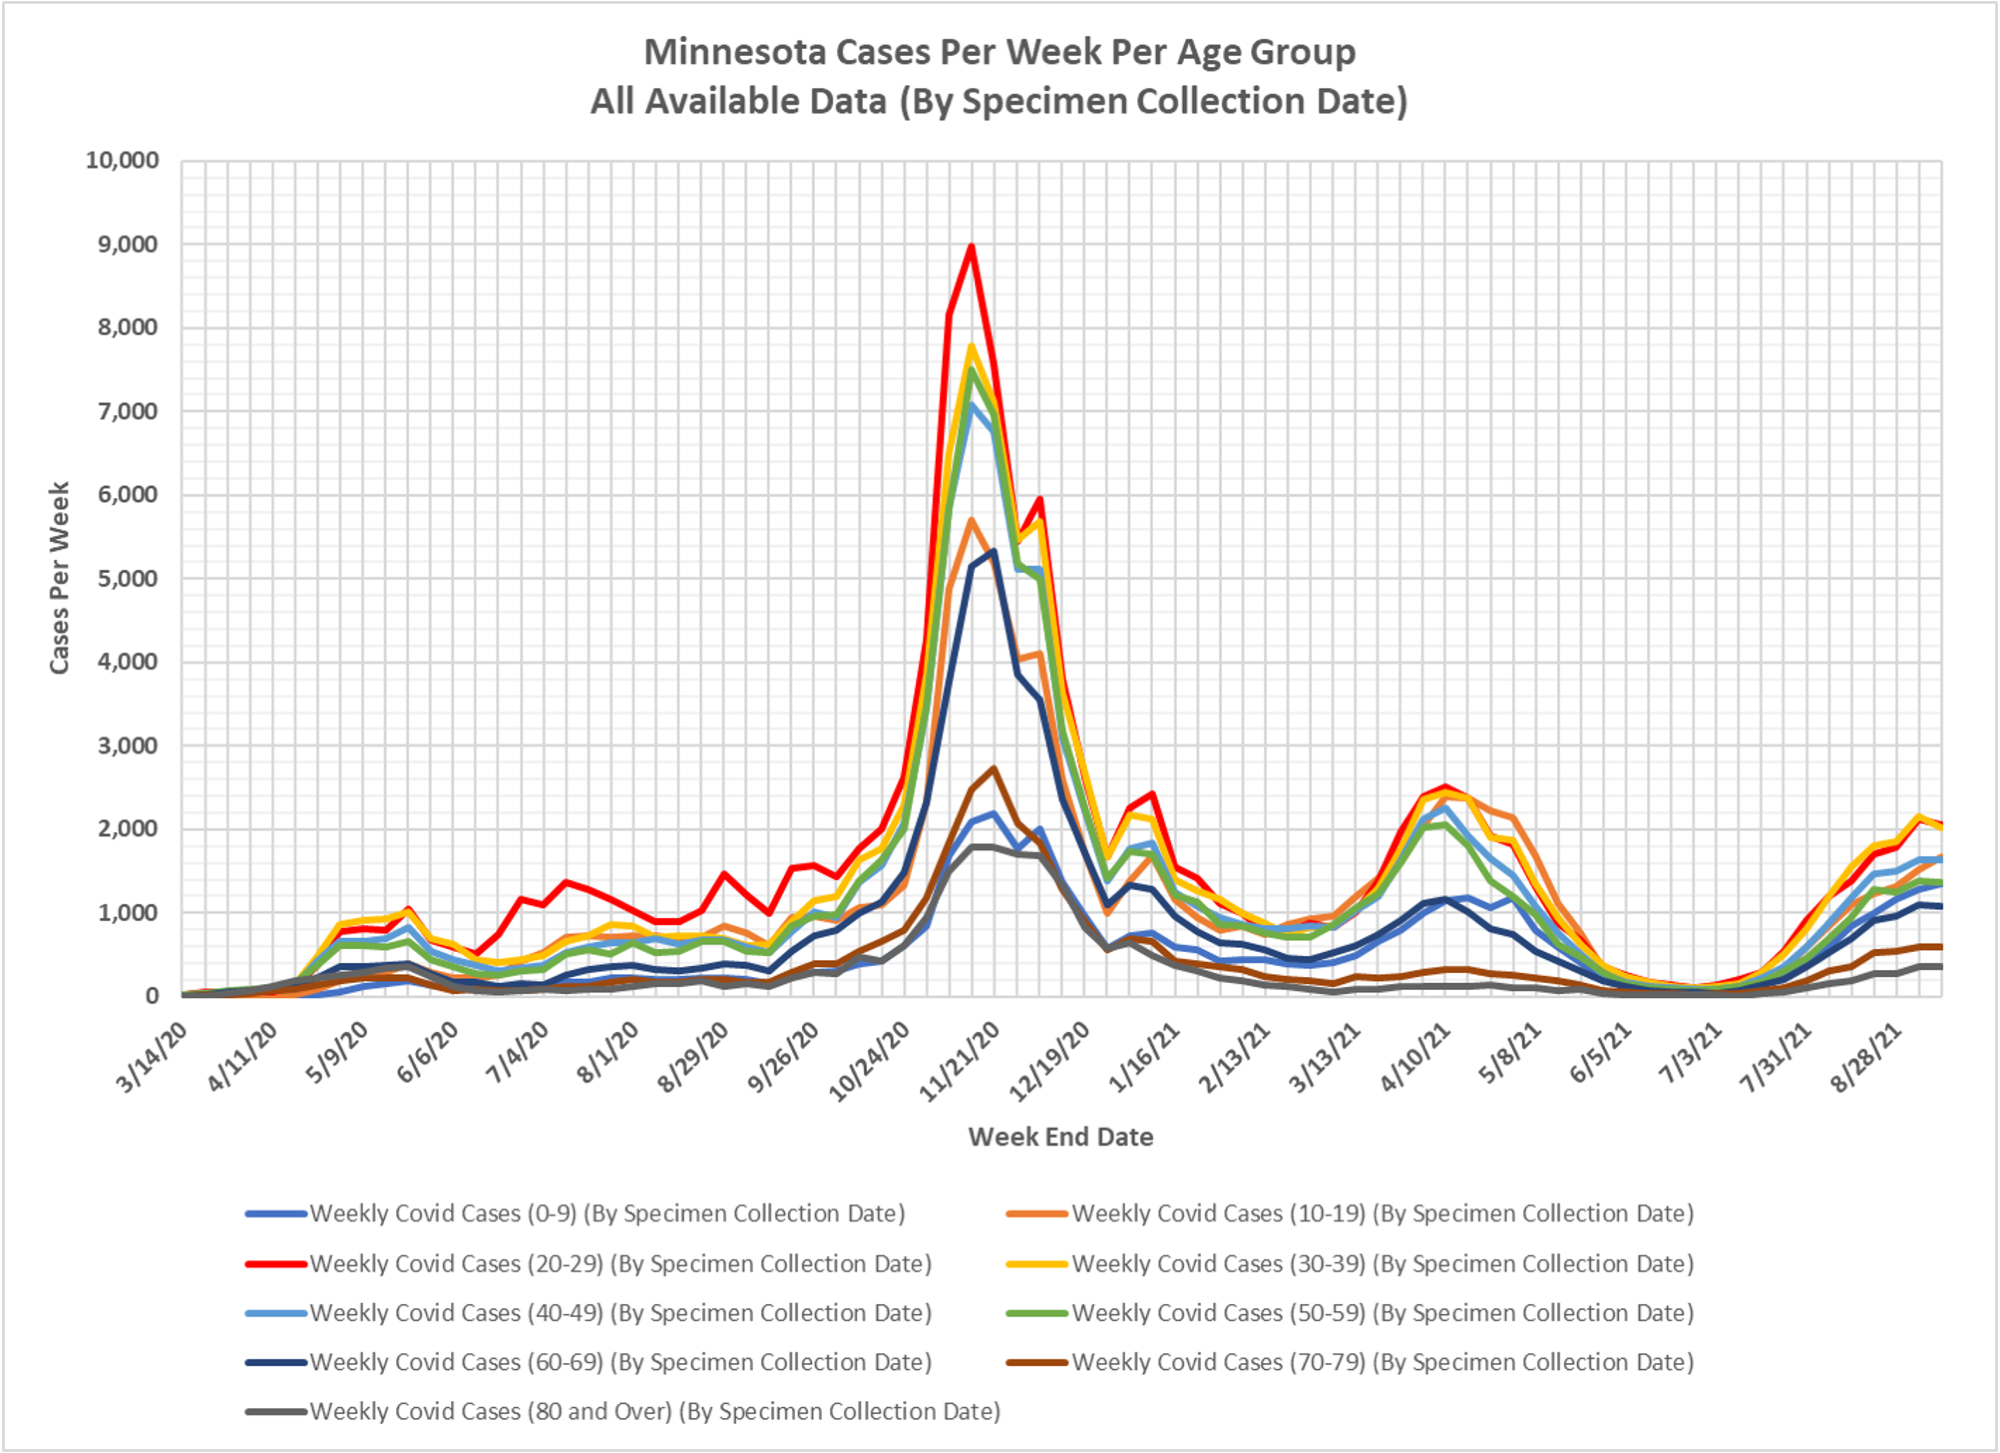
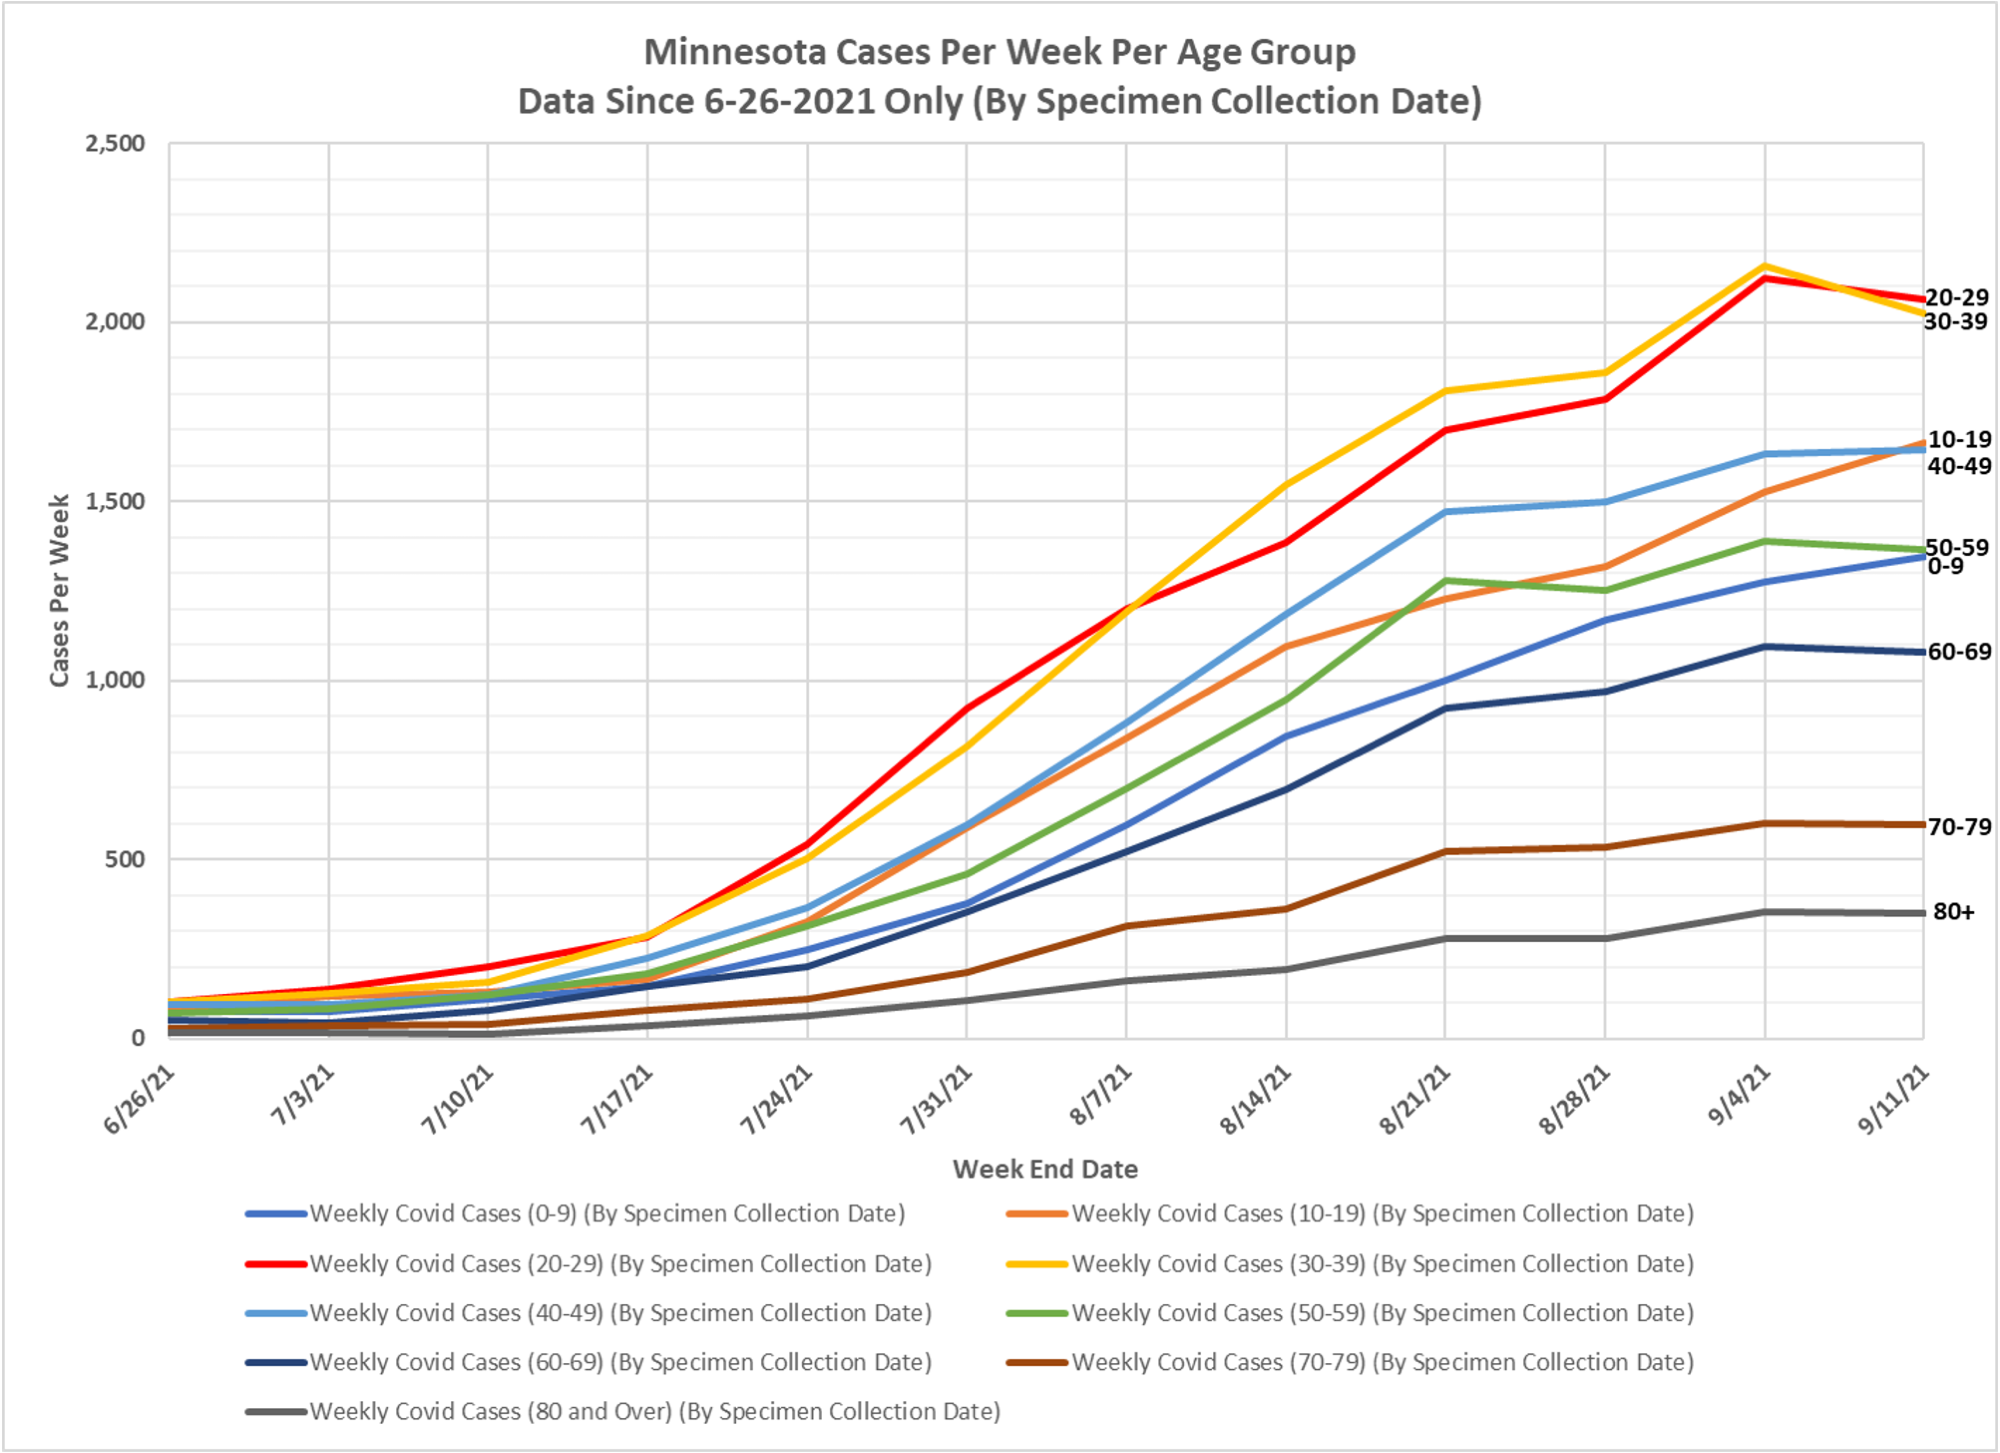
Dave Dixon tells me that the last time he did this series there was a mistake in the cases charts. Dave’s notes below explain exactly where the data comes from and the issues with the state’s backwards reporting. For very bizarre reasons which I am sure they could articulate really well, even though it clearly has the data by date of event, since it on the situation report, the state uses date of report on the weekly report. We are publishing this info about where the data comes from because I get genuine questions, but also because as readership keeps growing, I have attracted a few trolls who accuse me of making this stuff up. You don’t see those in the comments because I trash them and some other lovely notes I get from time-to-time.
Substantively, as I mentioned in another post today, you can see the impact of school testing, which leads to fake cases. I know and I am going to force the state to provide the data to show that the supposed increase in hospitalizations among the young is actually mostly RSV and other illnesses, with incidental CV-19. Otherwise not much going on.
Dave’s Notes for Series Charts with 10 Year Age Groups:
1. Data for tests, ICU hospital admissions, and Non-ICU Hospital Admissions is taken from the Minnesota Weekly Report, published by the Minnesota Department of Health every Thursday, and available here: https://www.health.state.mn.us/diseases/coronavirus/stats/index.html. The data is given for 5 year age groups, which are then combined into 10 year age groups in order for the charts to be more readable.
2. The Minnesota Weekly Report lists cumulative values for each week ending the day before the report is published, so the weeks are defined as running from Thursday to Wednesday. The tests and admissions per week are calculated by subtracting one week’s cumulative tptal from the next.
3. The data in the Weekly Report is presented by date of report, not by date of actual event. We have found through analysis that the reporting for PCR cases takes on average 5.6 days to be 90% complete and 6.6 days to be 95% complete. There are lags for hospital admissions, which have not been computed but appear to be somewhat shorter than the lags for cases.
4. Starting 9/16/21 the data for the covid case charts is taken from a data file from the MN DOH named “wagscd.csv” available from the Weekly Report page https://www.health.state.mn.us/diseases/coronavirus/stats/index.html#wagscd1 . This file contains cases by specimen collection date. In this data file the cases are reported in 5 year age groups per week starting the week ending 3/07/2020, whereas the Minnesota Weekly Reports, although starting on 5/14/2020, have relatively limited information until 8/20/2020. Because the data is presented by specimen collection date this means that the data for past weeks is updated as more cases are reported.
5. The case data published in wagscd.csv uses a different week definition than the Weekly Report weeks. Weeks for cases are defined as ending each Saturday, where the weeks in the Minnesota Weekly Report end on Wednesdays.
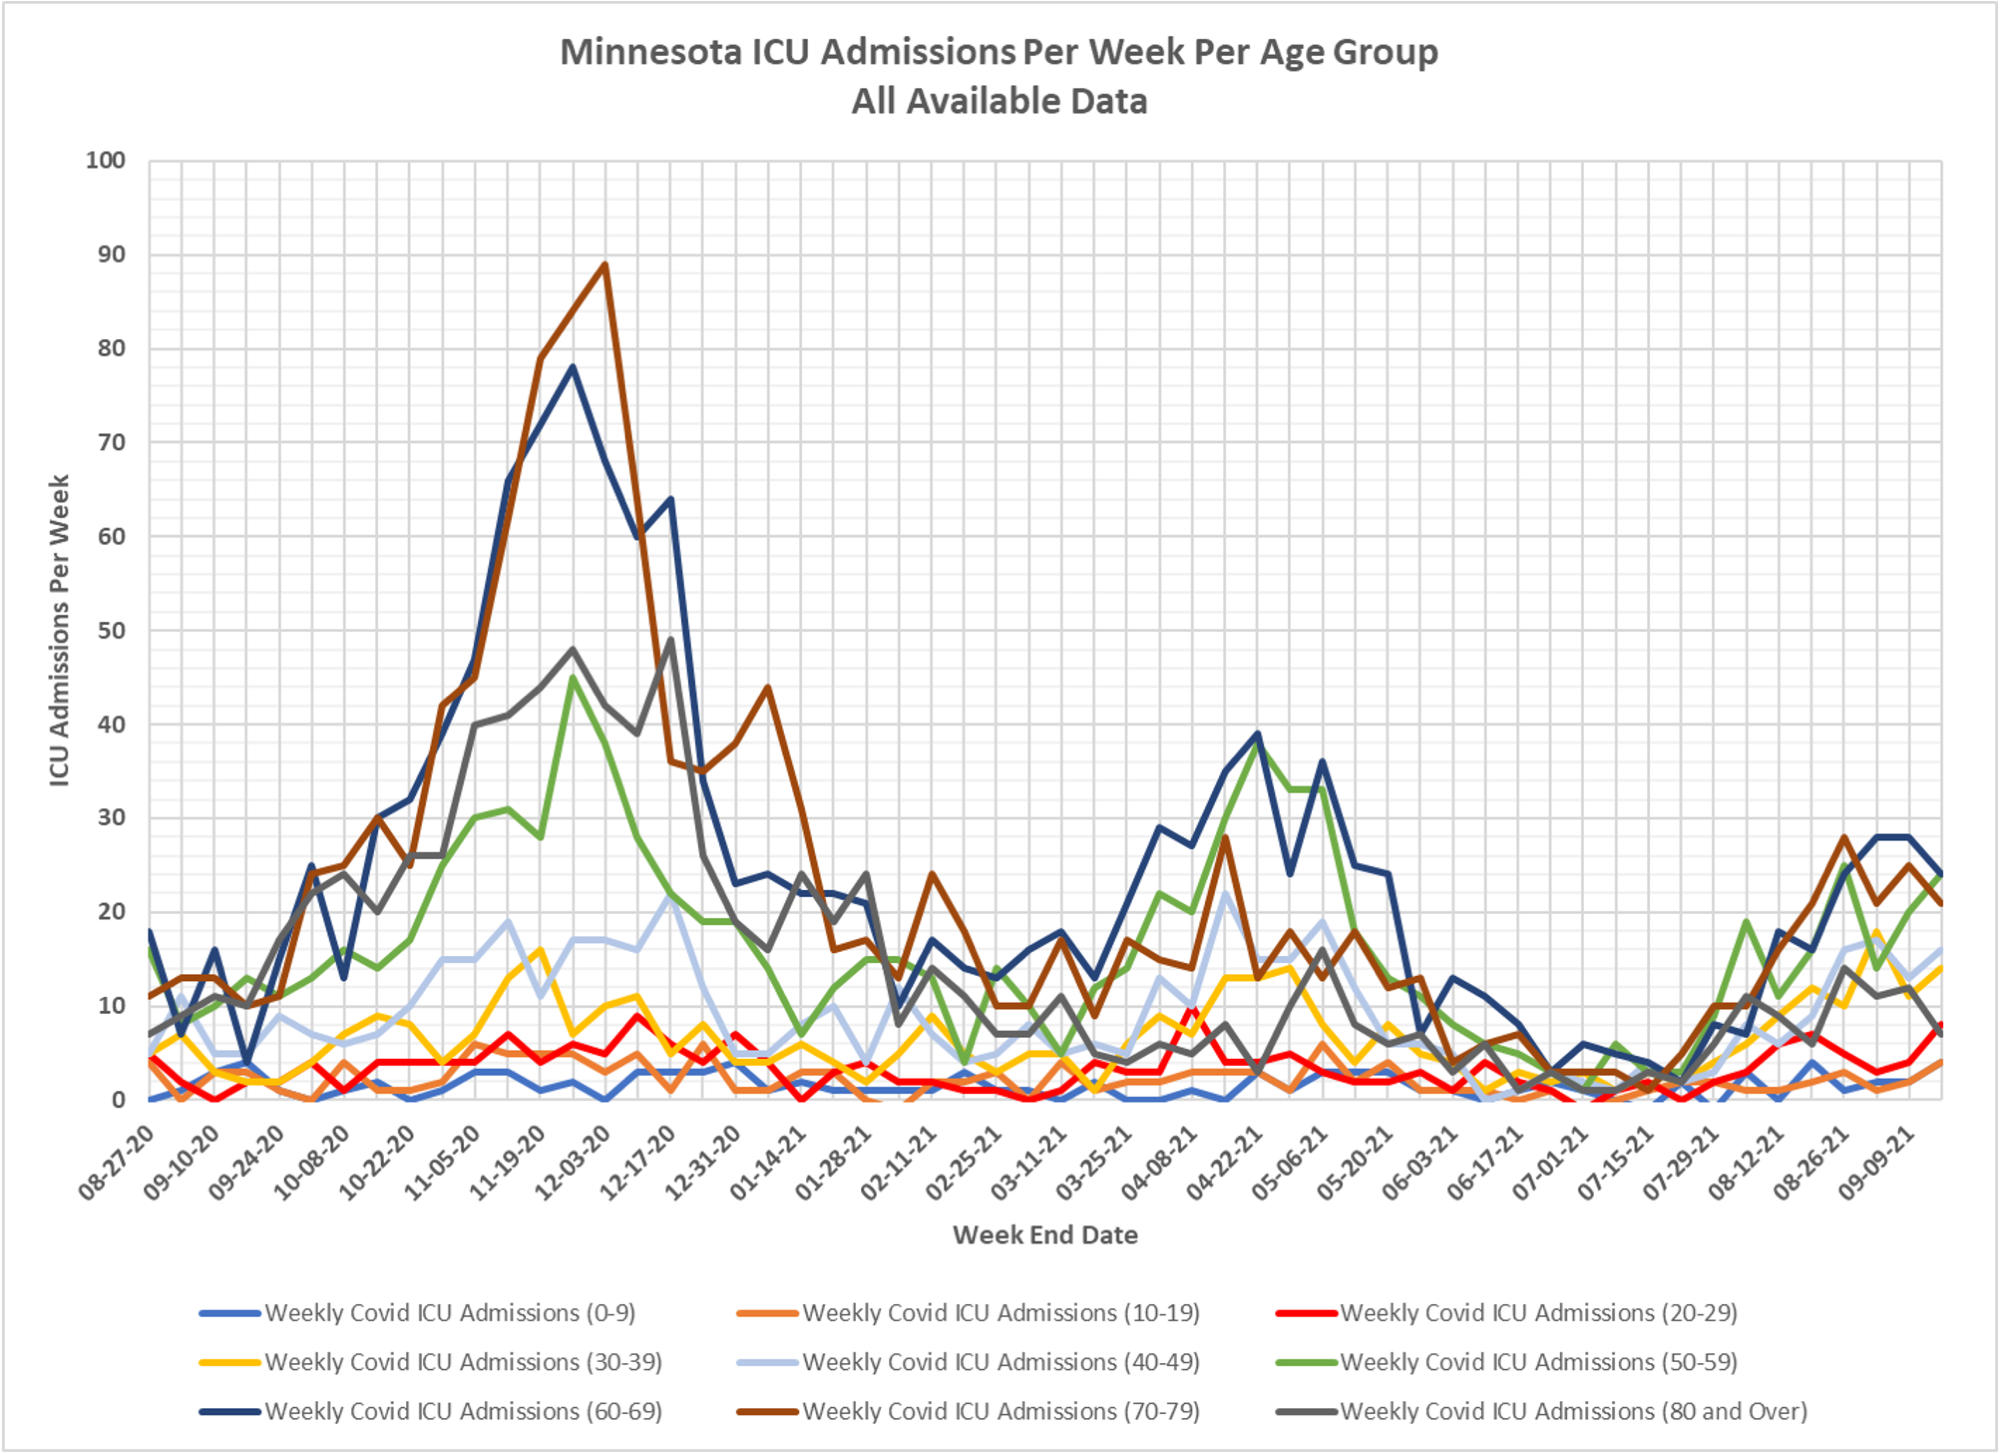
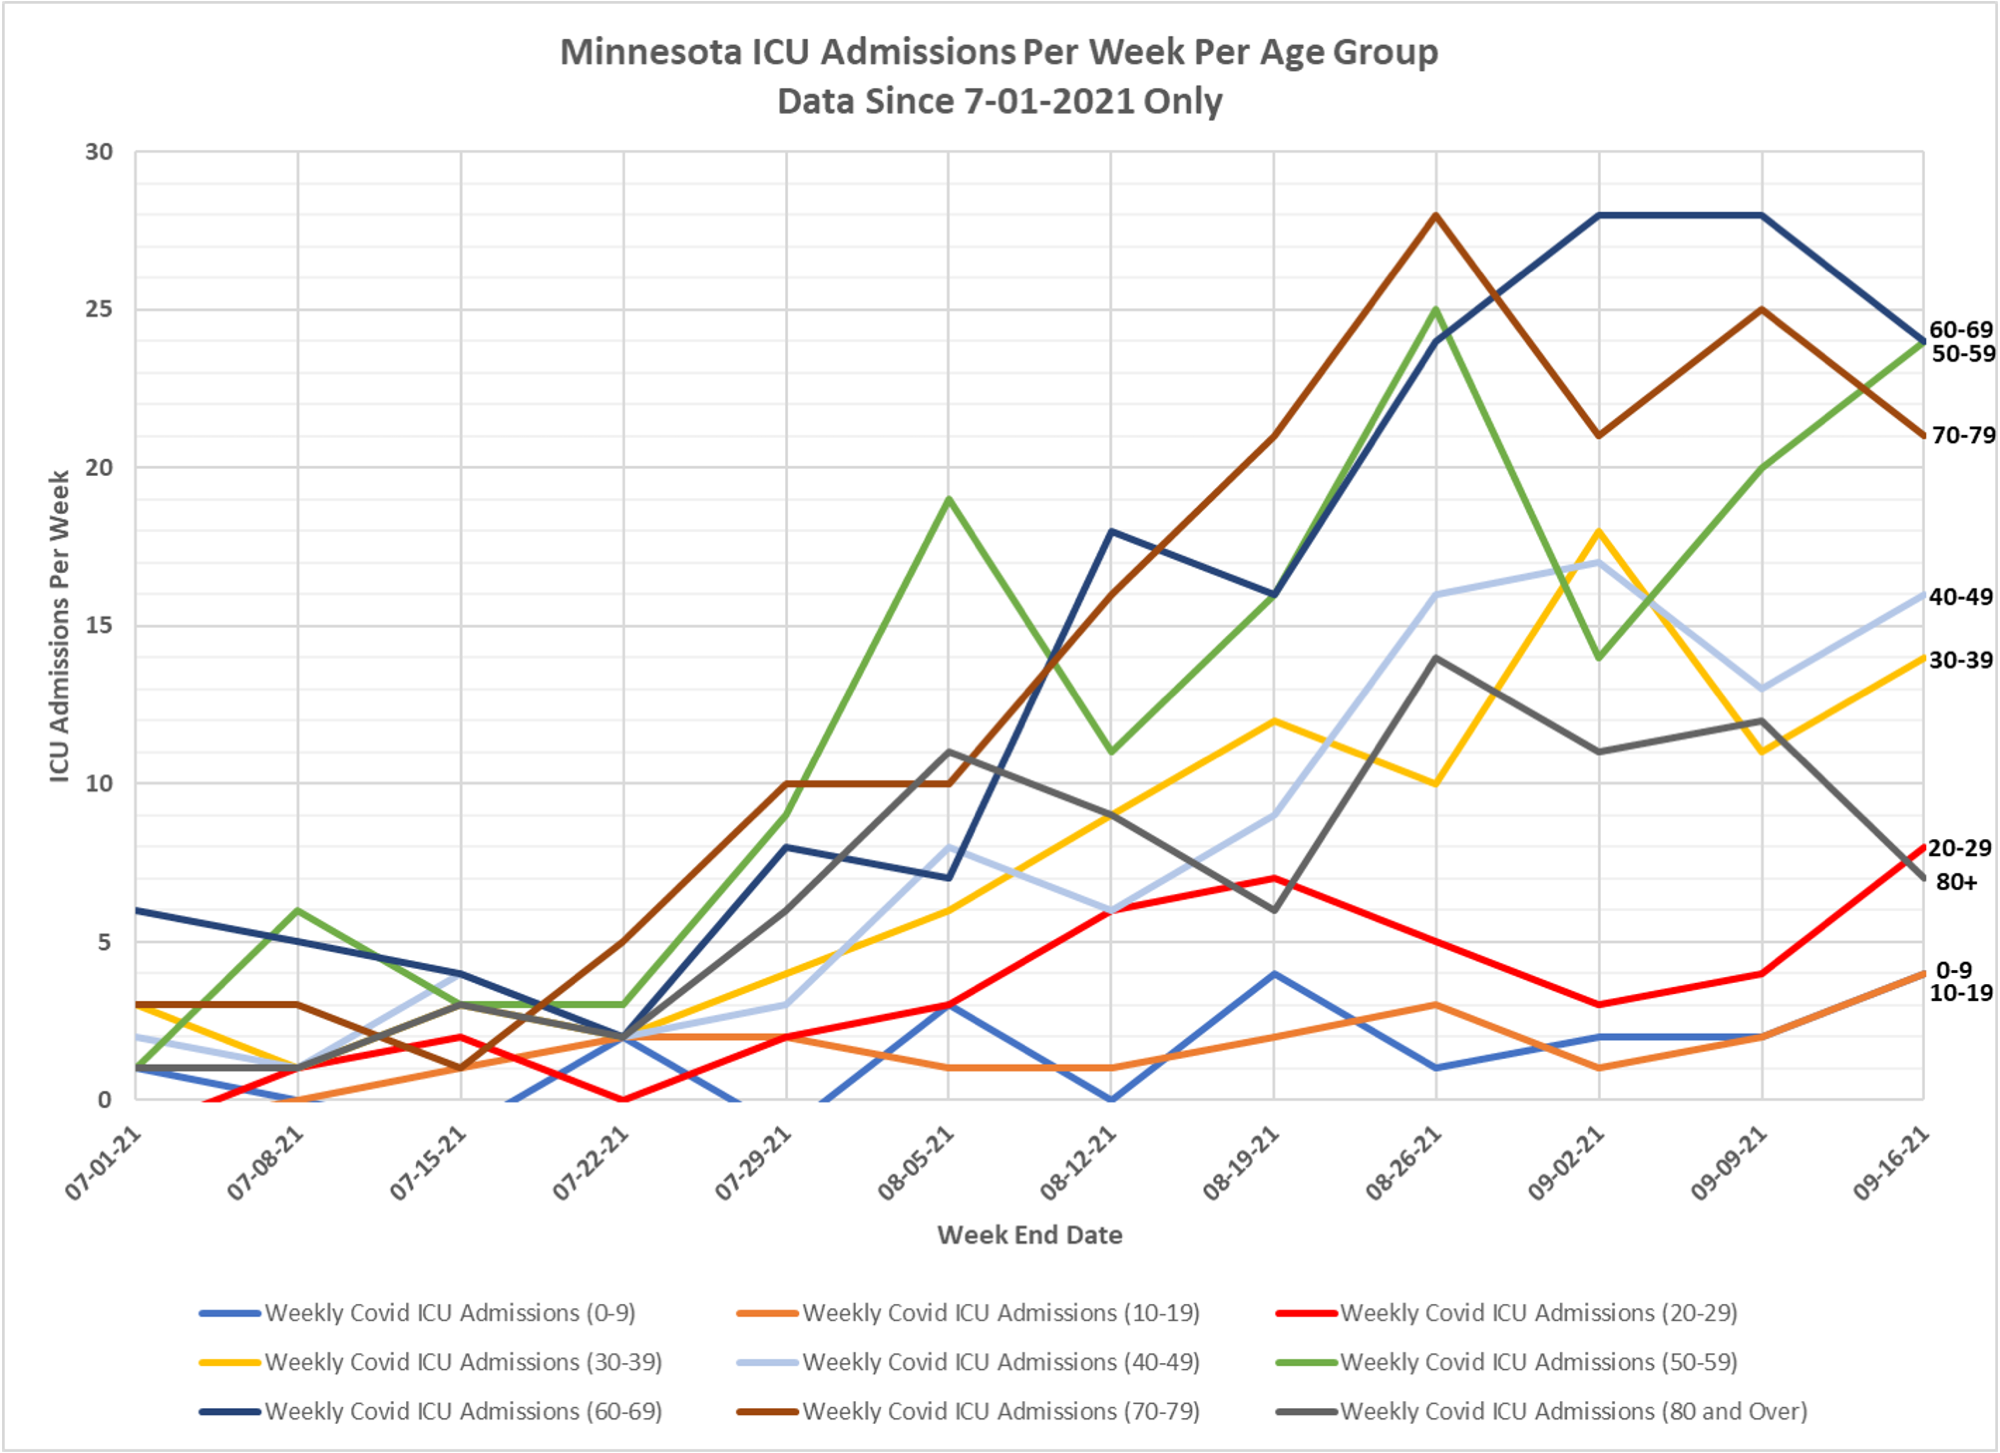
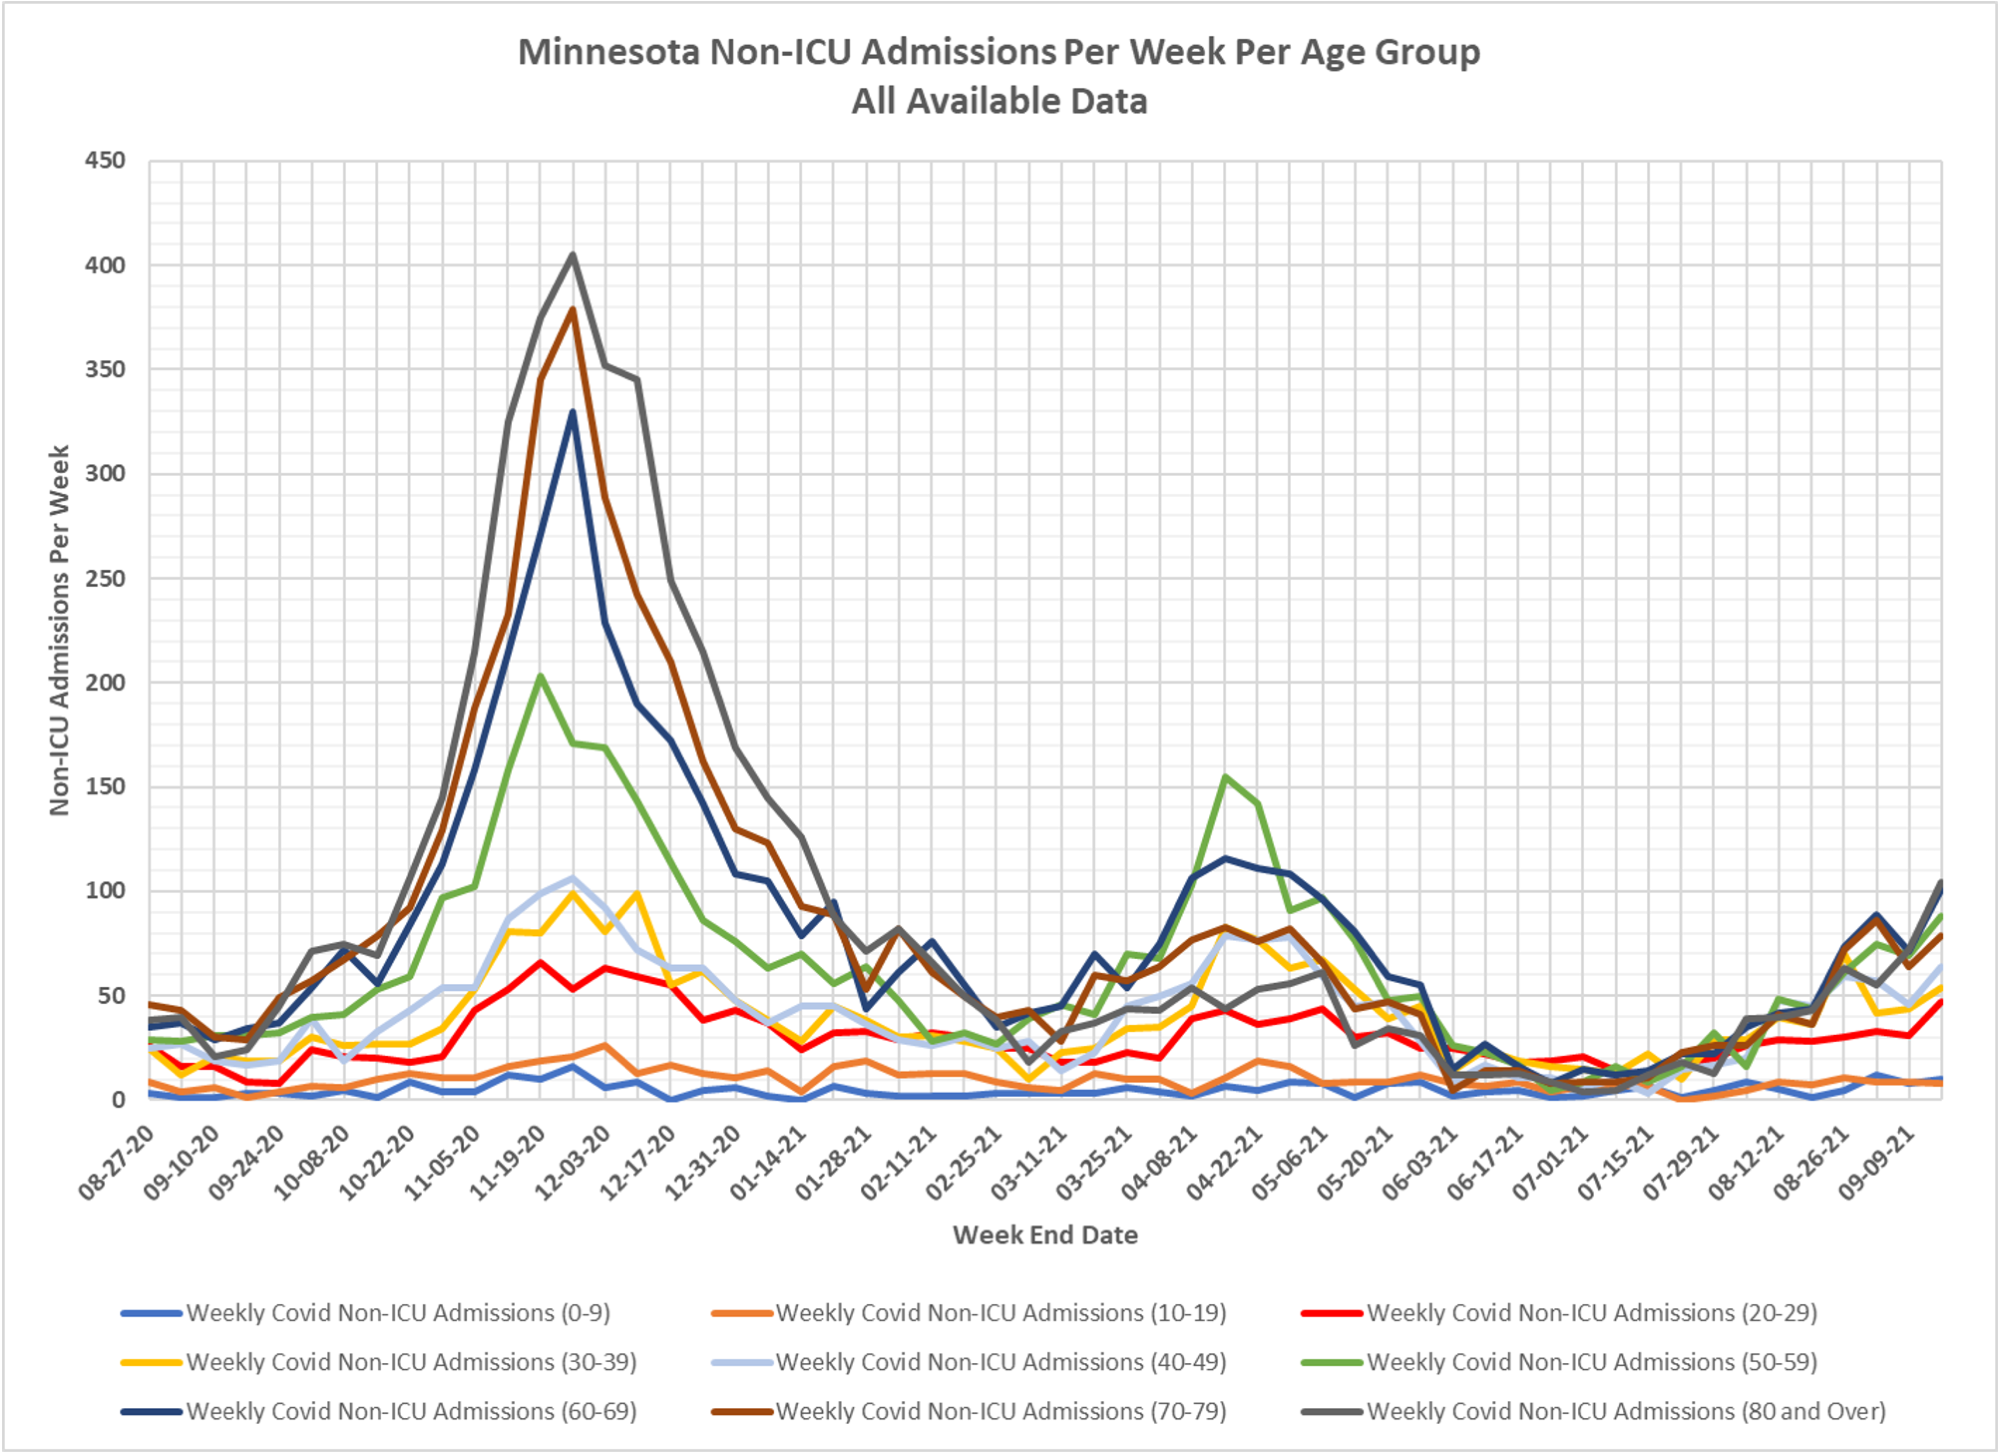
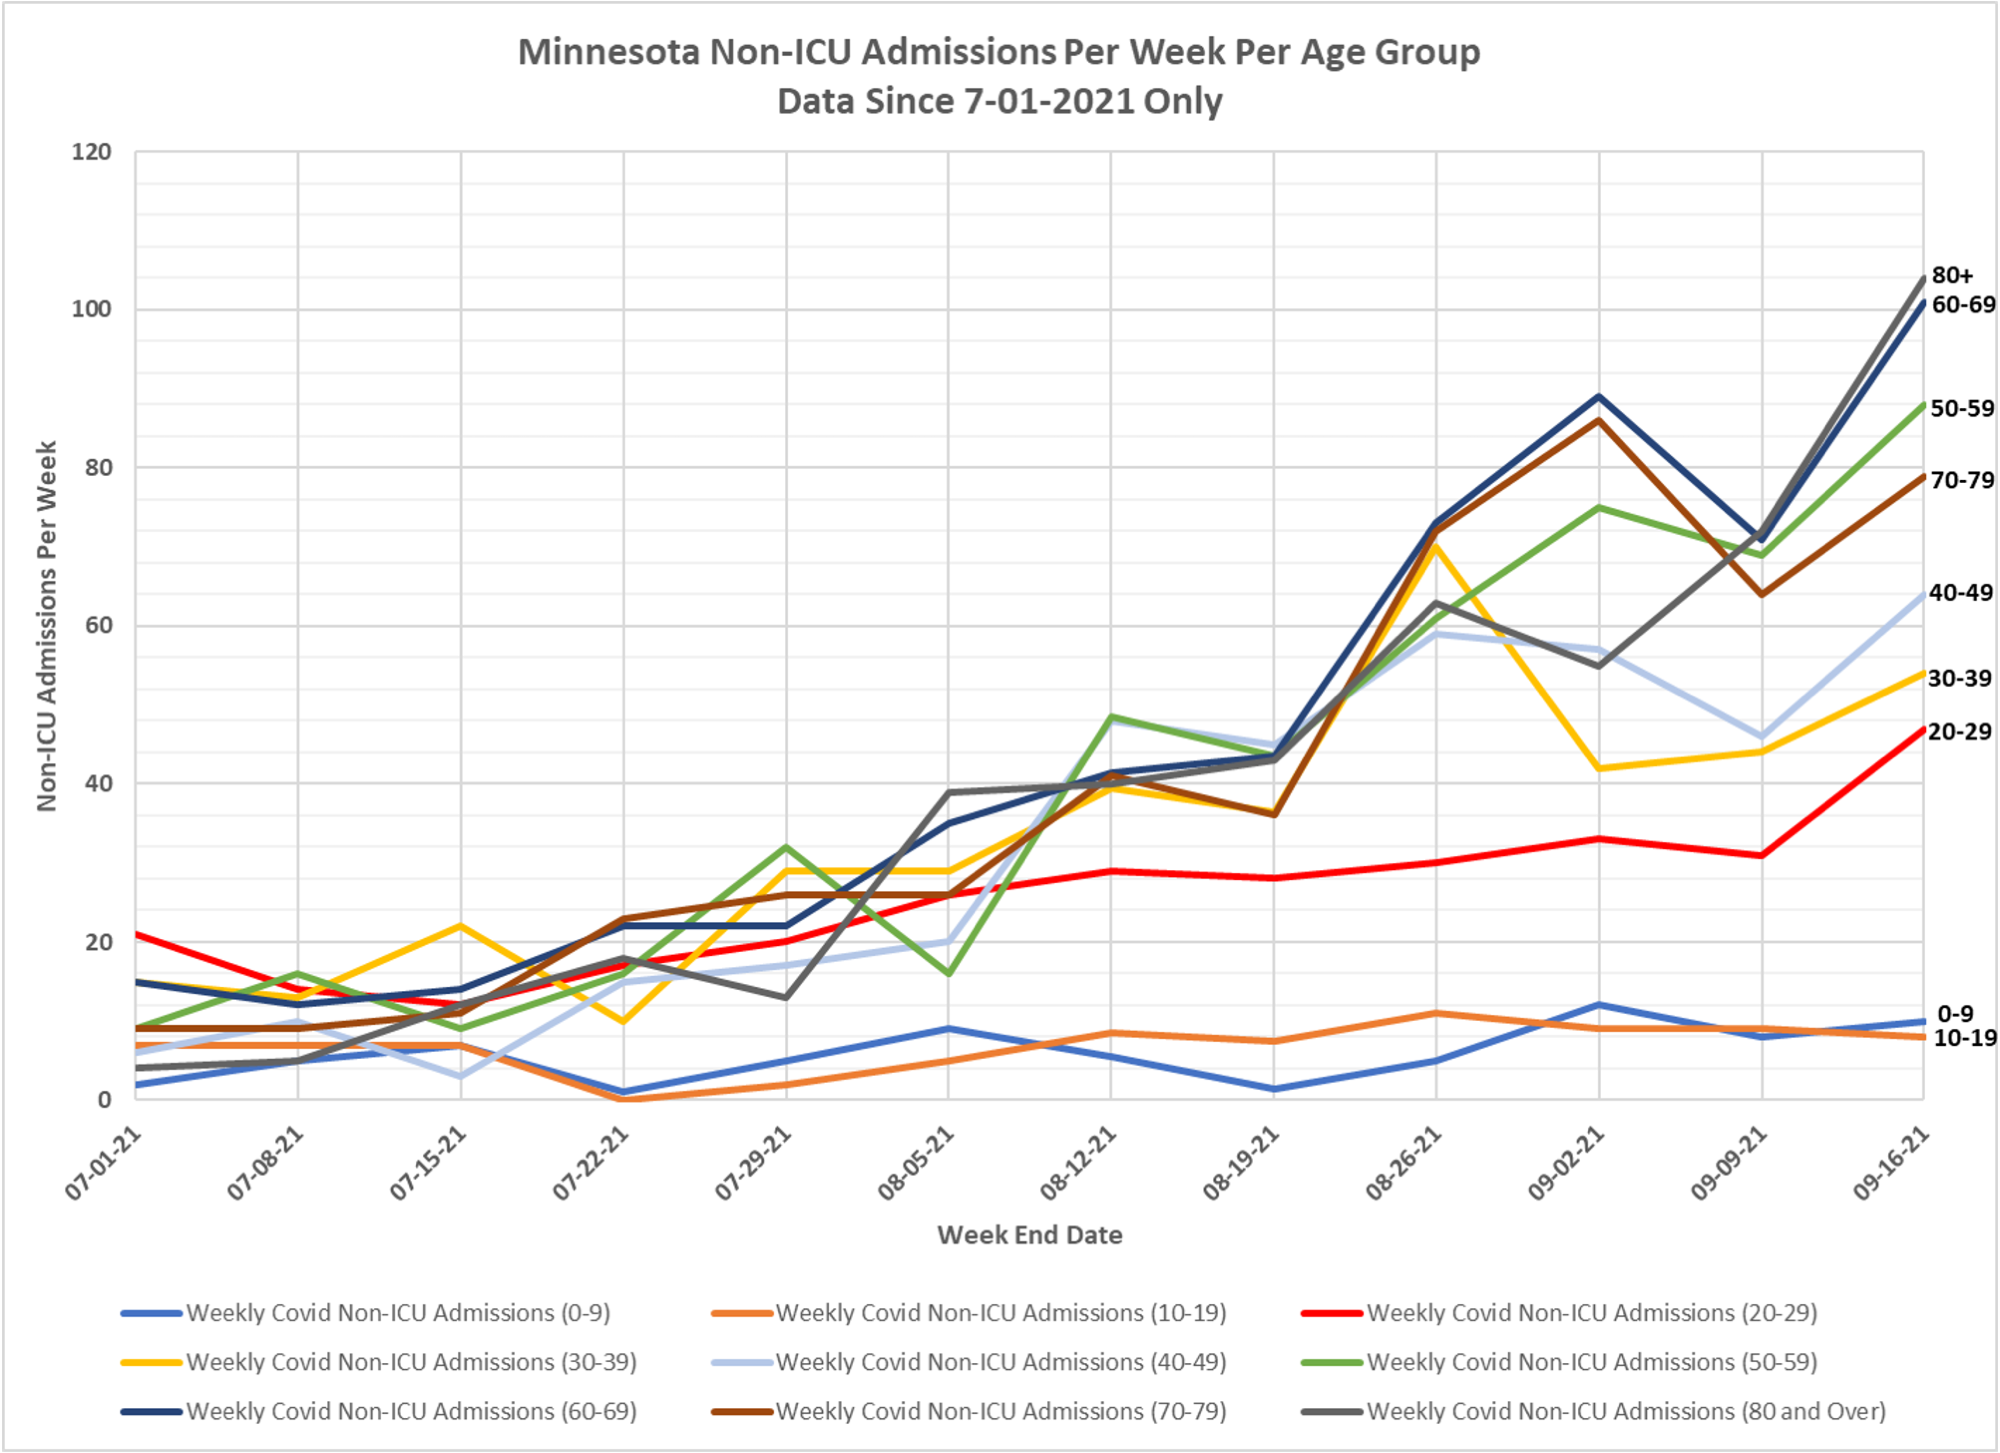


With the Pfizer study on safety of their vaccine in kids, I ran some numbers. The formula that is used for vaccine efficacy is the attack rates for: (control – test group)/control.
If you use “youth” as the test group and use death from covid as the metric, you get an efficacy of youth of 99.7%. Better than any vaccine.
If hospitalization is the metric, the efficacy of youth is around 88%. (Average stay in the hospital for kids is 1-2 days, and that’s counting all the “with-not-for covid” cases.)
There is no reason to be shooting kids up with the vaccine.
I tend to agree with that, and very, very large scale trials should be done before they are. The risk to a healthy child from CV-19 is about 0
Anne in L.A., that’s a nice way of looking at it. I love “youth” as the test group. However I question those numbers a bit.
In Canada, for example, the national government’s statistical body publishes their COVID stuff death rates here: https://health-infobase.canada.ca/covid-19/epidemiological-summary-covid-19-cases.html#figure3-header – you just have to switch the combobox from the default of “hospitalized” to “deceased”.
As of today, the number of deaths in Canada from the coof is n = 15, over the entire 19.5 month period, if we generously start the clock in March, 2020.
I had a harder time finding the population of Canada bucketed by age in the same way but using this website: https://www.statista.com/statistics/444858/canada-resident-population-by-gender-and-age-group/ we see 3.7M males and 3.55M females (total 7.25M) under 18 and 1.75M males plus 1.62M females 18-24 (total 3.37M). Adding 2/7ths of the latter population to the former, we get 7.25M plus 2/7th x 3.37M = 8.21M.
Now for the efficacy calculation, (control – test group) / control: (8,210,000 – 15) / 8,210,000 = 99.999817% efficacy against death.
Now that’s some good efficacy! Thanks, non-pharmaceutical fountain of youth!
———————————————————-
By the way, one of the big lies from the Pfizer phase 3 clinical trial (apart from the absurdly irrelevant age and health structure of the trial group members relative to the at-risk-from-COVID population), is TIME. They ran their silly study for FOUR MONTHS and pronounced their magic injection 95% effective, FOREVER.
Four months isn’t a very long time to measure anything. How we took that result seriously even for a second is beyond me – it’s a true indication of how silly our society has become. It’s like a Twitter study. HOT TAKE: PFIZER IS 95% EFFECTIVE. Now forget all about it and go back to sleep.
It would be good to see the numbers from Israel plugged into these efficacy math expressions since they have the oldest data set. If you ran this every month starting in 2021, I would bet that the efficacy value drops with time, especially when you include the breakthrough data (which I’m assuming Israel has the courage to collect). But NO worries, LT Data for FDA decision making is irrelevant when you have sales targets and the Biden administration breathing down your neck !
Just finished “Dissolving Illusions”, Disease, Vaccines and Forgotten History (Humphries / Bystianyk). It’s a very comprehensive historical perspective on health in general. The story line basically goes that all of the popular diseases that ‘vaccines’ were developed for were already mostly eradicated by public health measures, sanitation improvements and improved diets long before big pharma showed up to ‘save the day’. It also sheds light on vaccine development and the winding road that it leaves in its wake.
Looks like history is repeating itself again, same governmental fear porn/control tactics, vaccines to the rescue and another winding road ahead. It puts this into great perspective … if you think that living in the early 1900’s was a great time for medicine.
My comment above in response to Anne about the youth could have been clearer: I want to emphasize I’m referring to persons under 20 years sold.
So n = 15, as of the writing of that comment, means 15 deaths attributed to COVID in persons under 20, in the whole 19.5 or more of the COVId hysteria period.
One other clarification: the only thing I was “questioning” in Anne’s number is that I think it doesn’t have enough nines after the decimal!