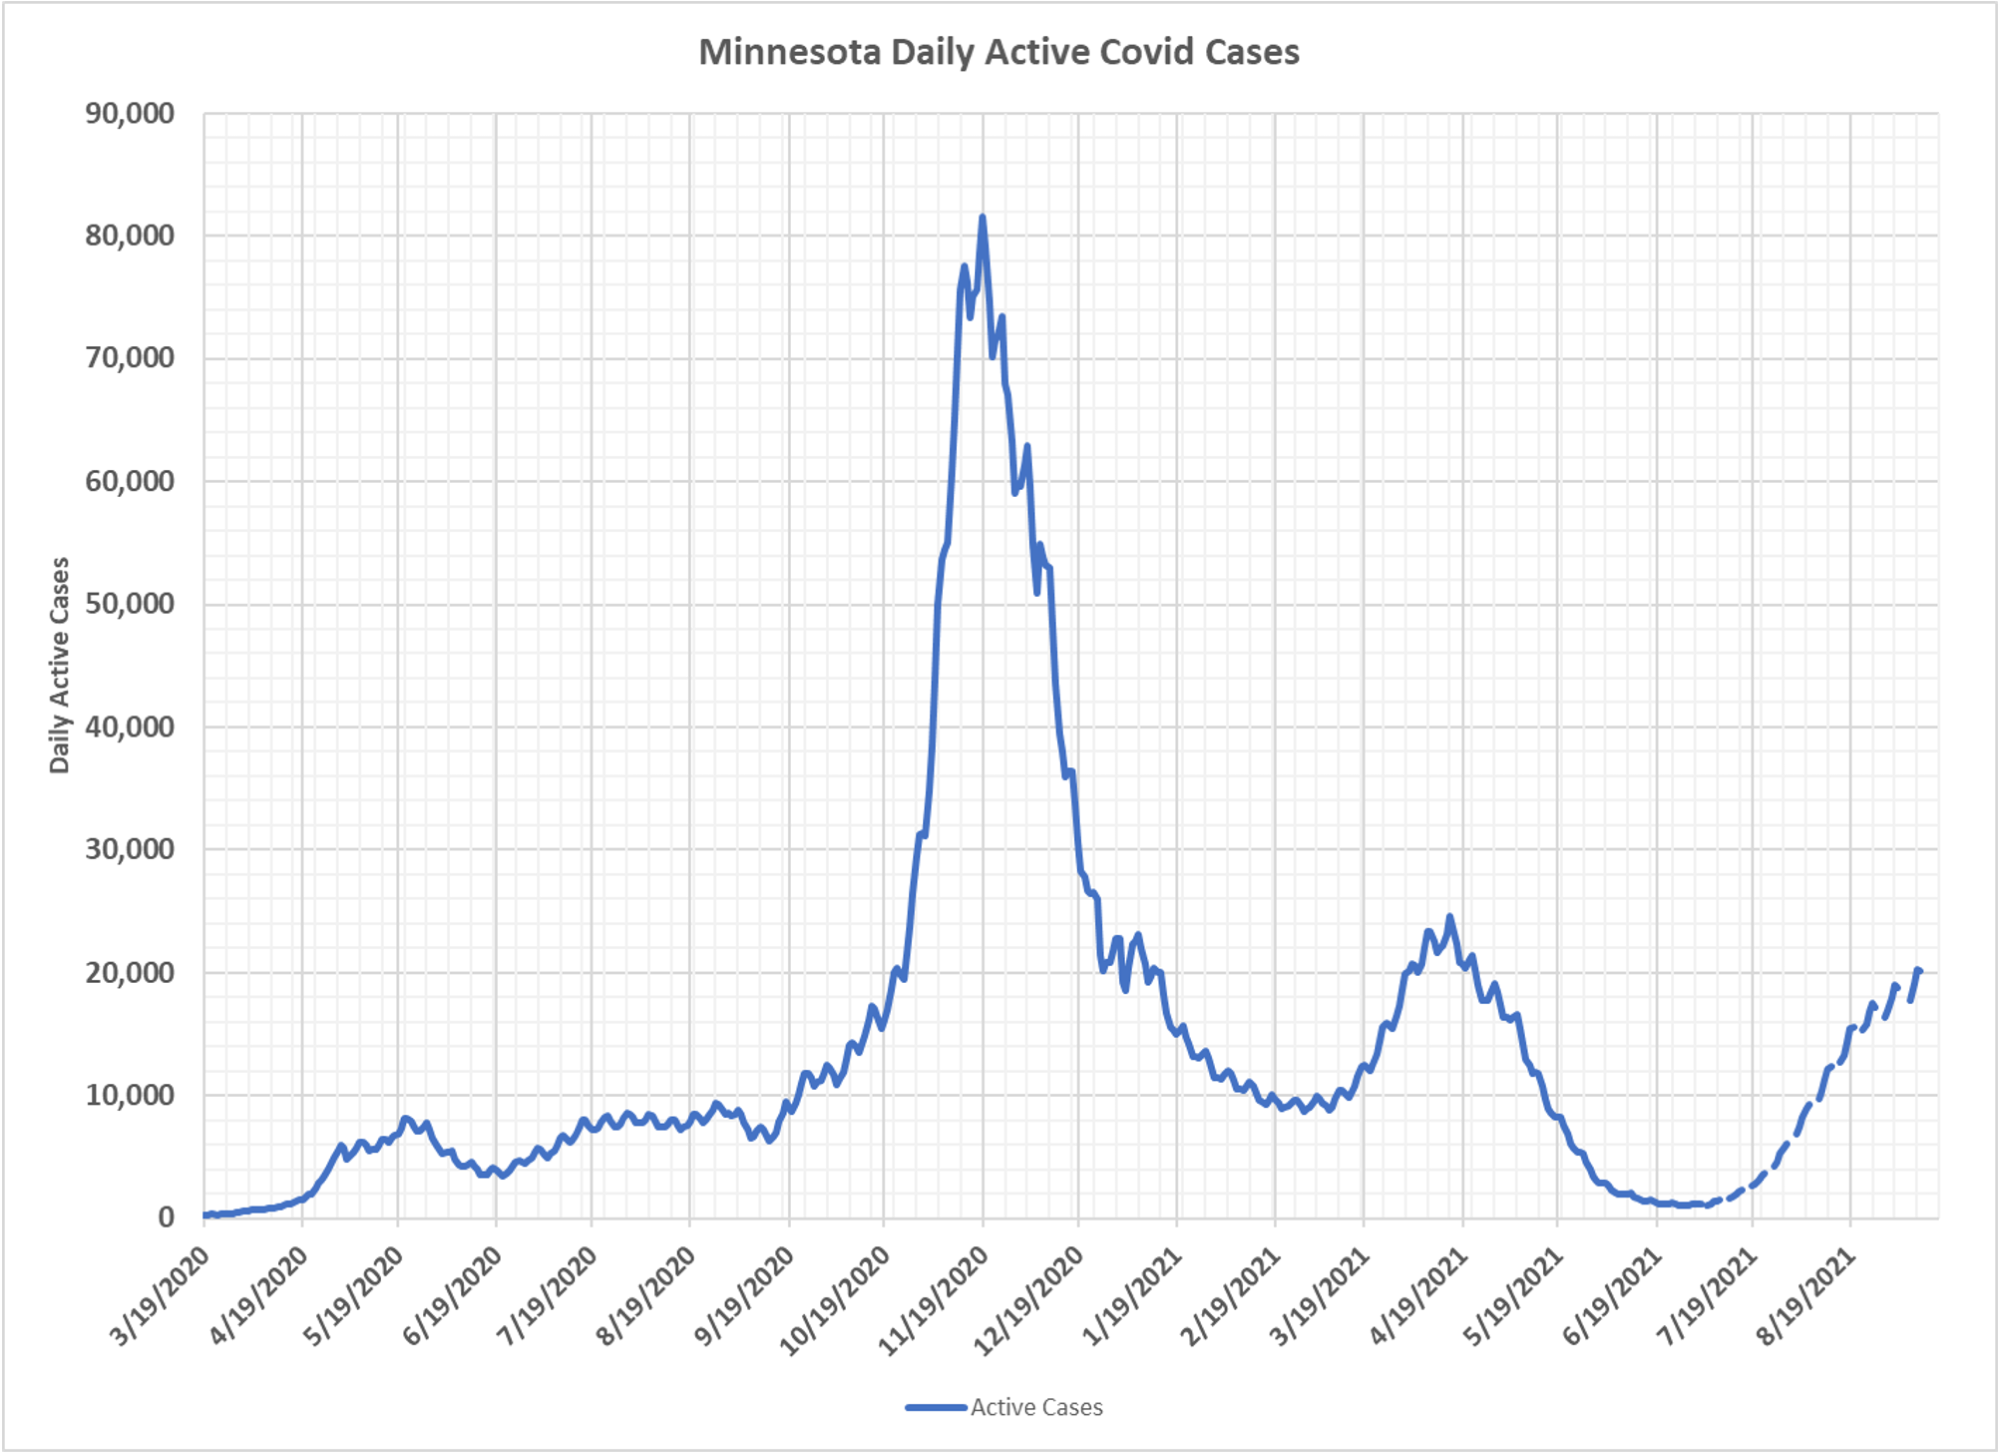
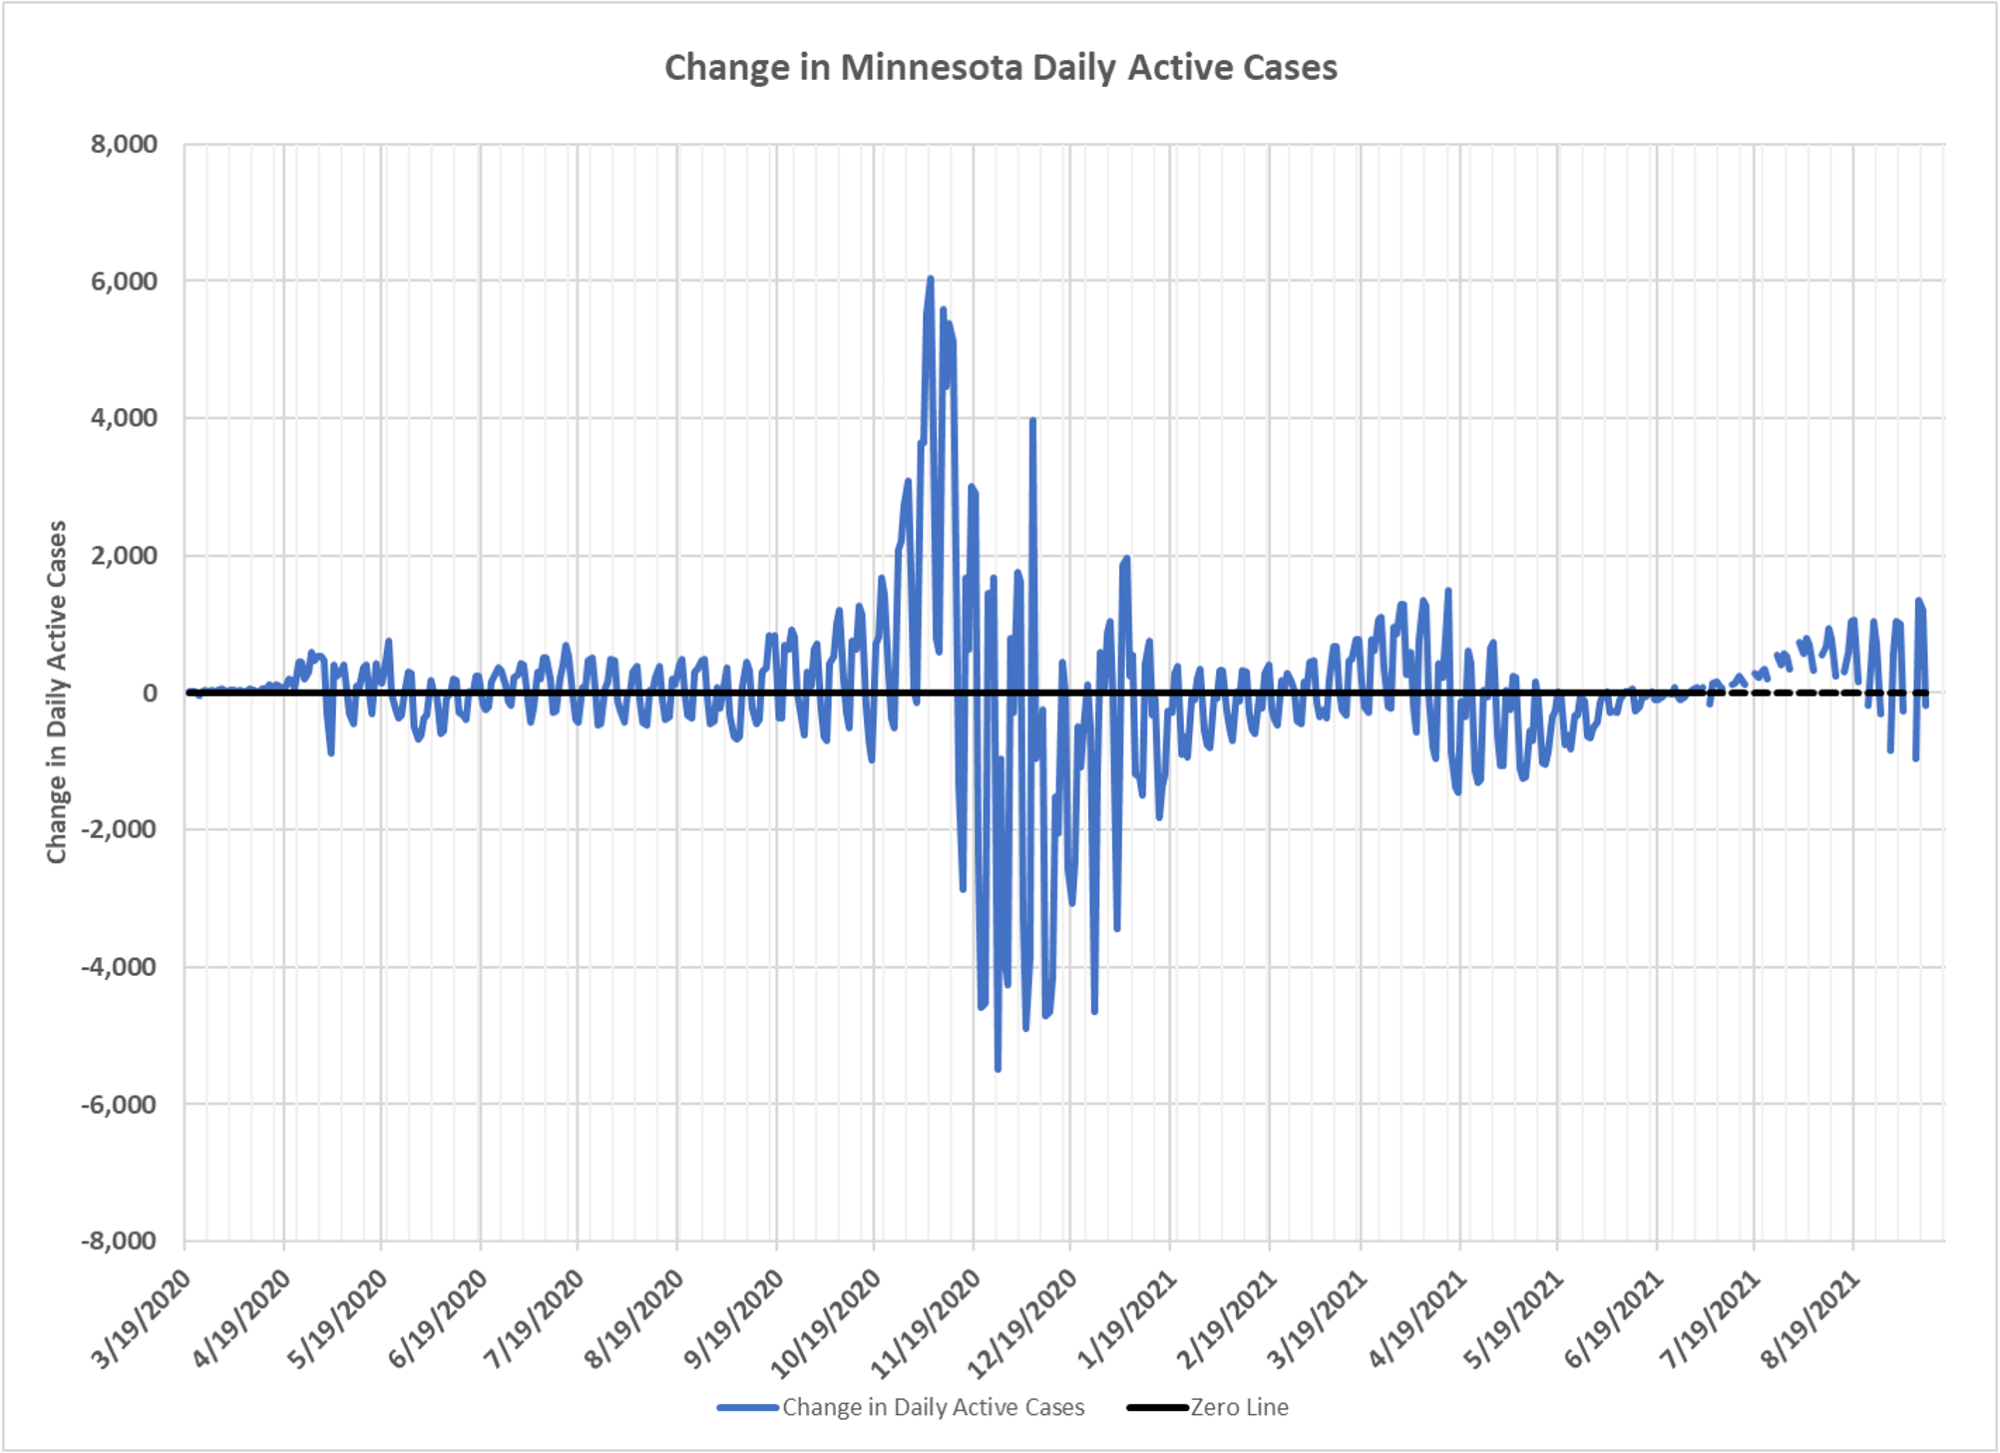
Once more, thanks to Dave Dixon, and this represents our best estimate, from the state’s data, of active cases, the number of people who are likely to be infectious. This is almost certainly an over-estimate based on the true period of infectiousness, but that may be somewhat offset by undetected infectious cases. The charts also show the changes in number and percent in cases. The saw tooth pattern reflects the fact that the virus knows what day of the week it is when it infects you. That is a little sarcastic because what it really reflects is that forced testing has more to do with “cases” than does actual presence of symptoms that leads someone to seek a test. In a way, weekend test levels actually reflect best what the true rate of needed tests would be. The rest is stuff forced by employers, health care providers, schools and others.
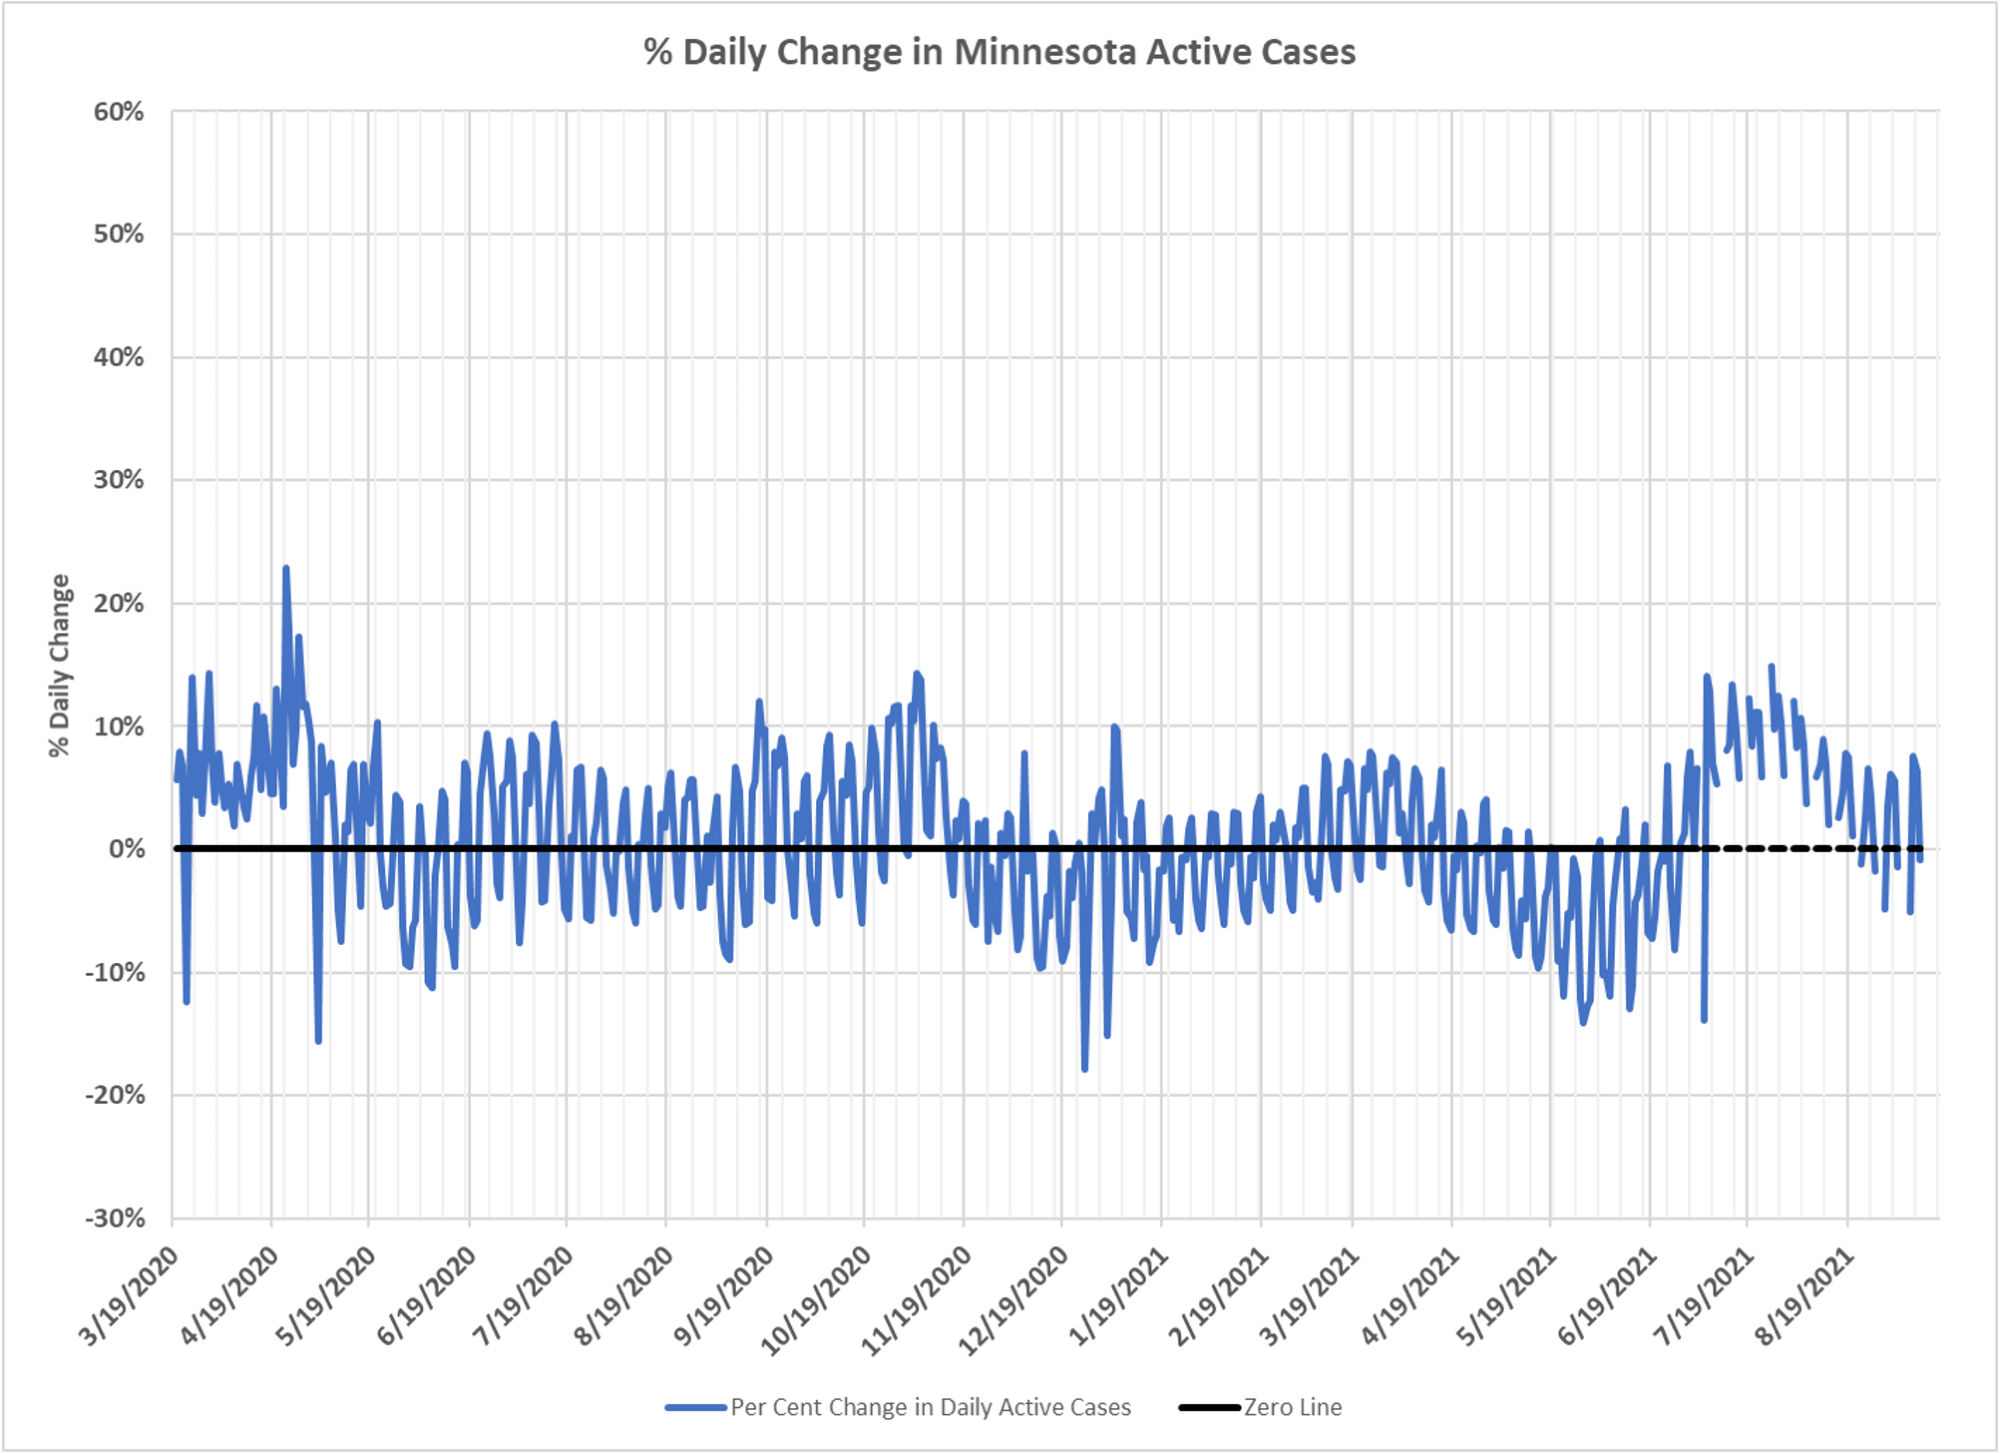
A few weeks ago I said I was uncertain where we were headed and that the active cases percent change, and week-over-week percent change, would be the best leading indicator of trend, except that we were heading to school starting and we were going to get a bunch of unnecessary tests with false and low positives. That is exactly what is happening and it is confounding the analysis.