It took Dave Dixon a lot of work to get something like what we wanted out of the database supposedly used for that bastardized CDC study on hospitalization rates among children. The data set is not user friendly, but Dave basically figured out how to show the rates and the absolute numbers among the age groups set out in COVID-Net. You can see the charts below. He is working on a version with all age groups lumped together. In any event, you will notice in picture form what liars these people are.
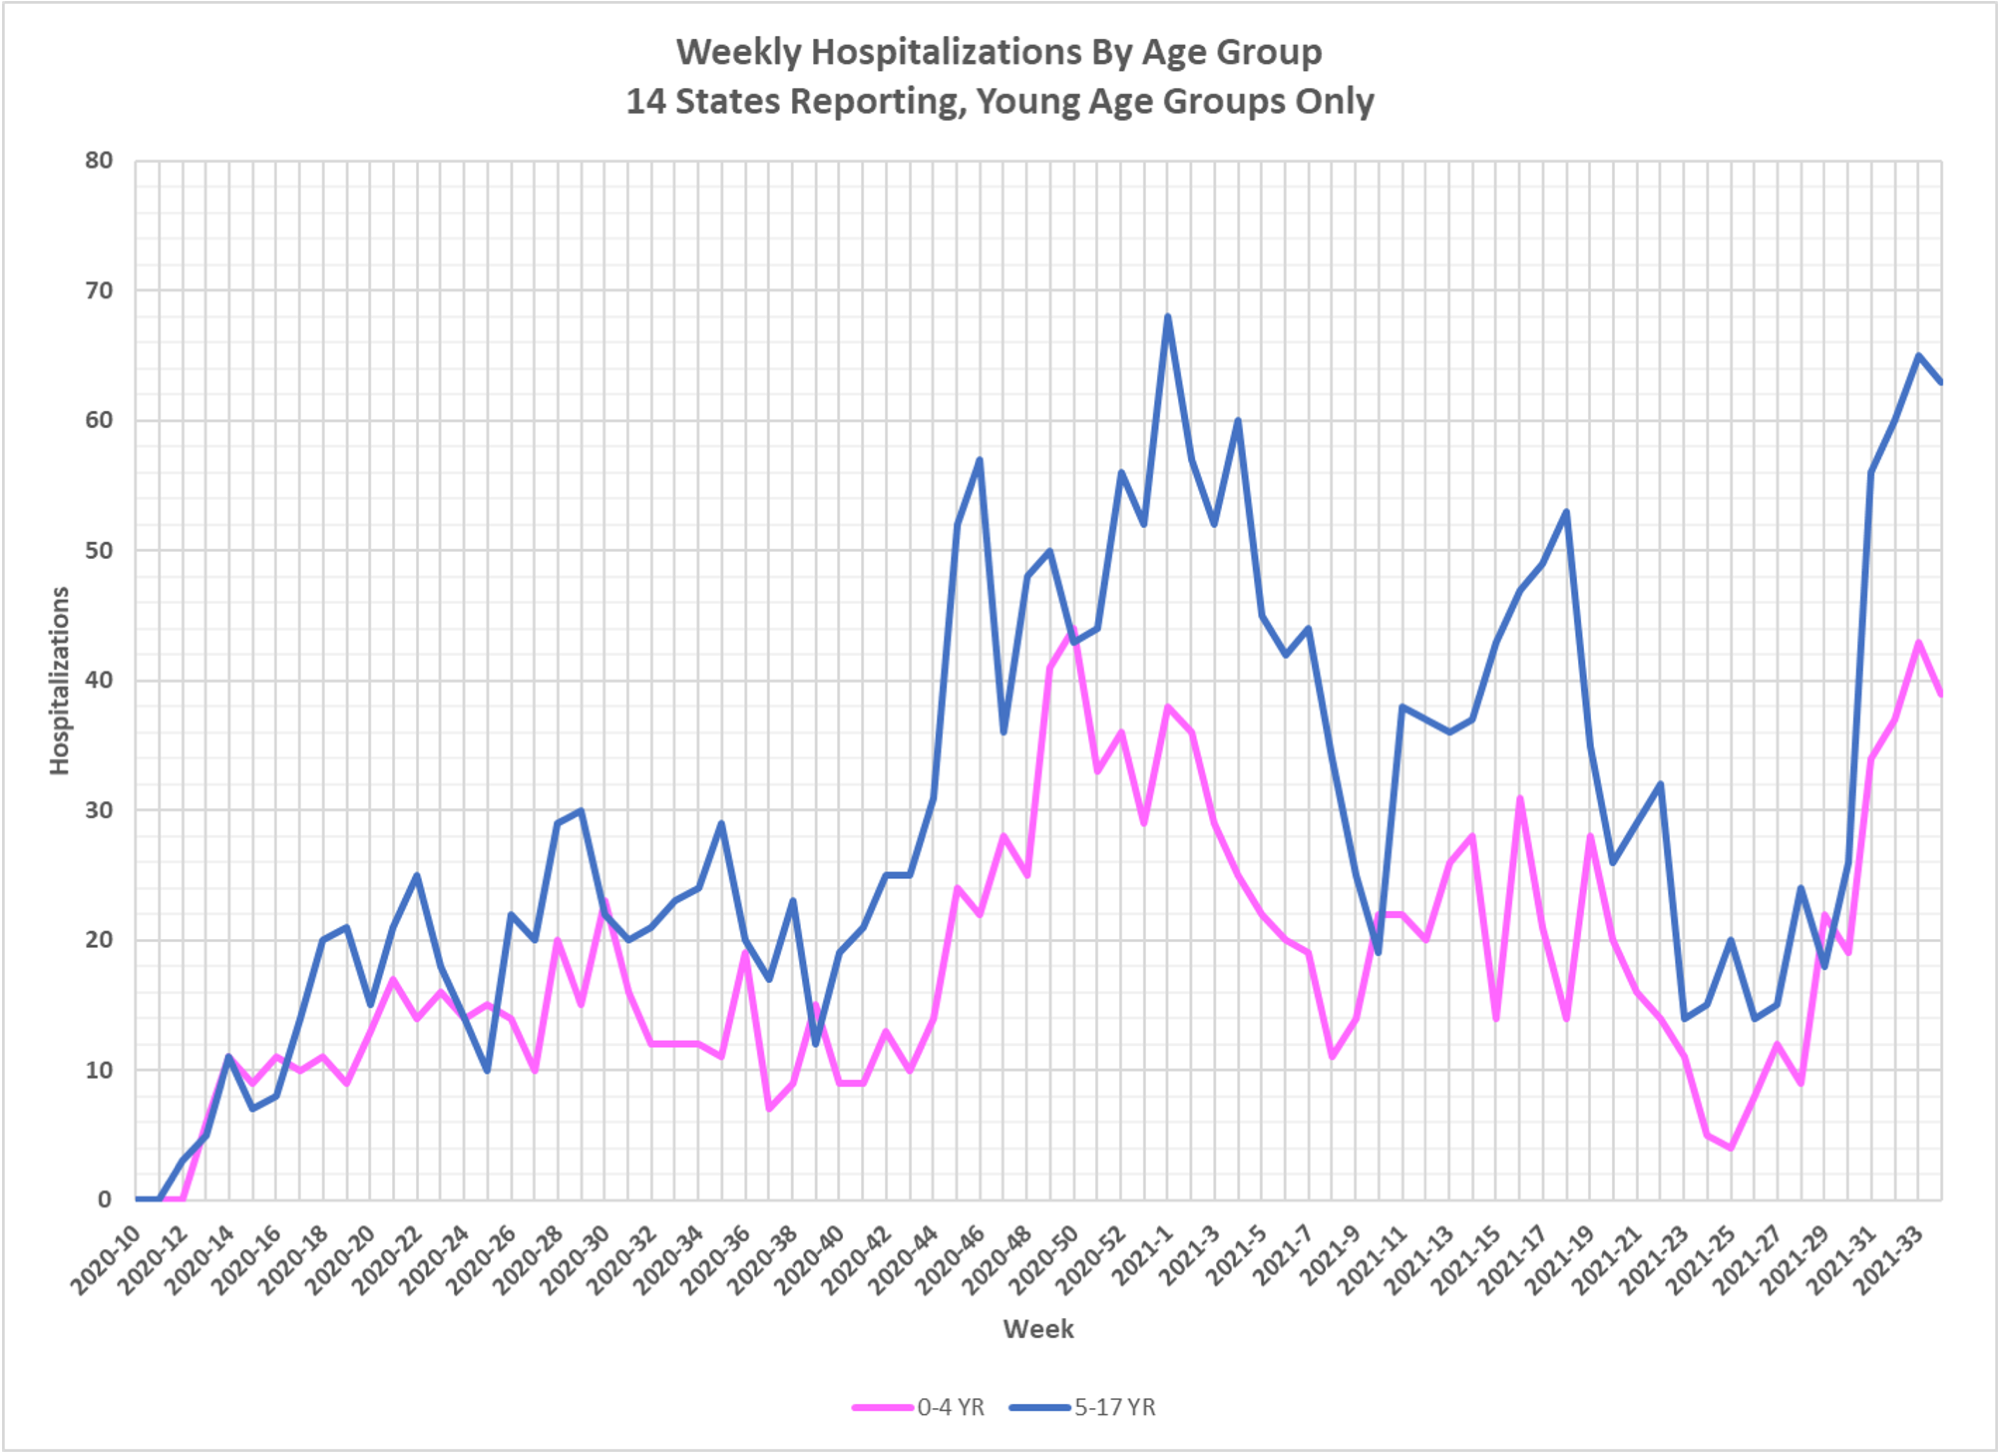
Look at the last graph first, the one with the absolute numbers among the age groups that include children. Look at those absolute numbers. In 14 states, many quite large, this is all the total hospitalizations of children we have supposedly due to CV-19. And remember that even the study itself acknowledged the extremely liberal definition of a CV-19 hospitalization that was being used. Now look at the second graph, the one showing all age groups. The only thing noticeable there is that vaccination has clearly made a difference in the absolute number of hospitalizations in the oldest cohort. The gap in cases is down dramatically. See anything in those younger age groups? Now you don’t, same trend as always–such low numbers that you can barely see any change, but if there is any bump up it occurs at the exact same time as other groups move up, and in a lower proportion, not higher.
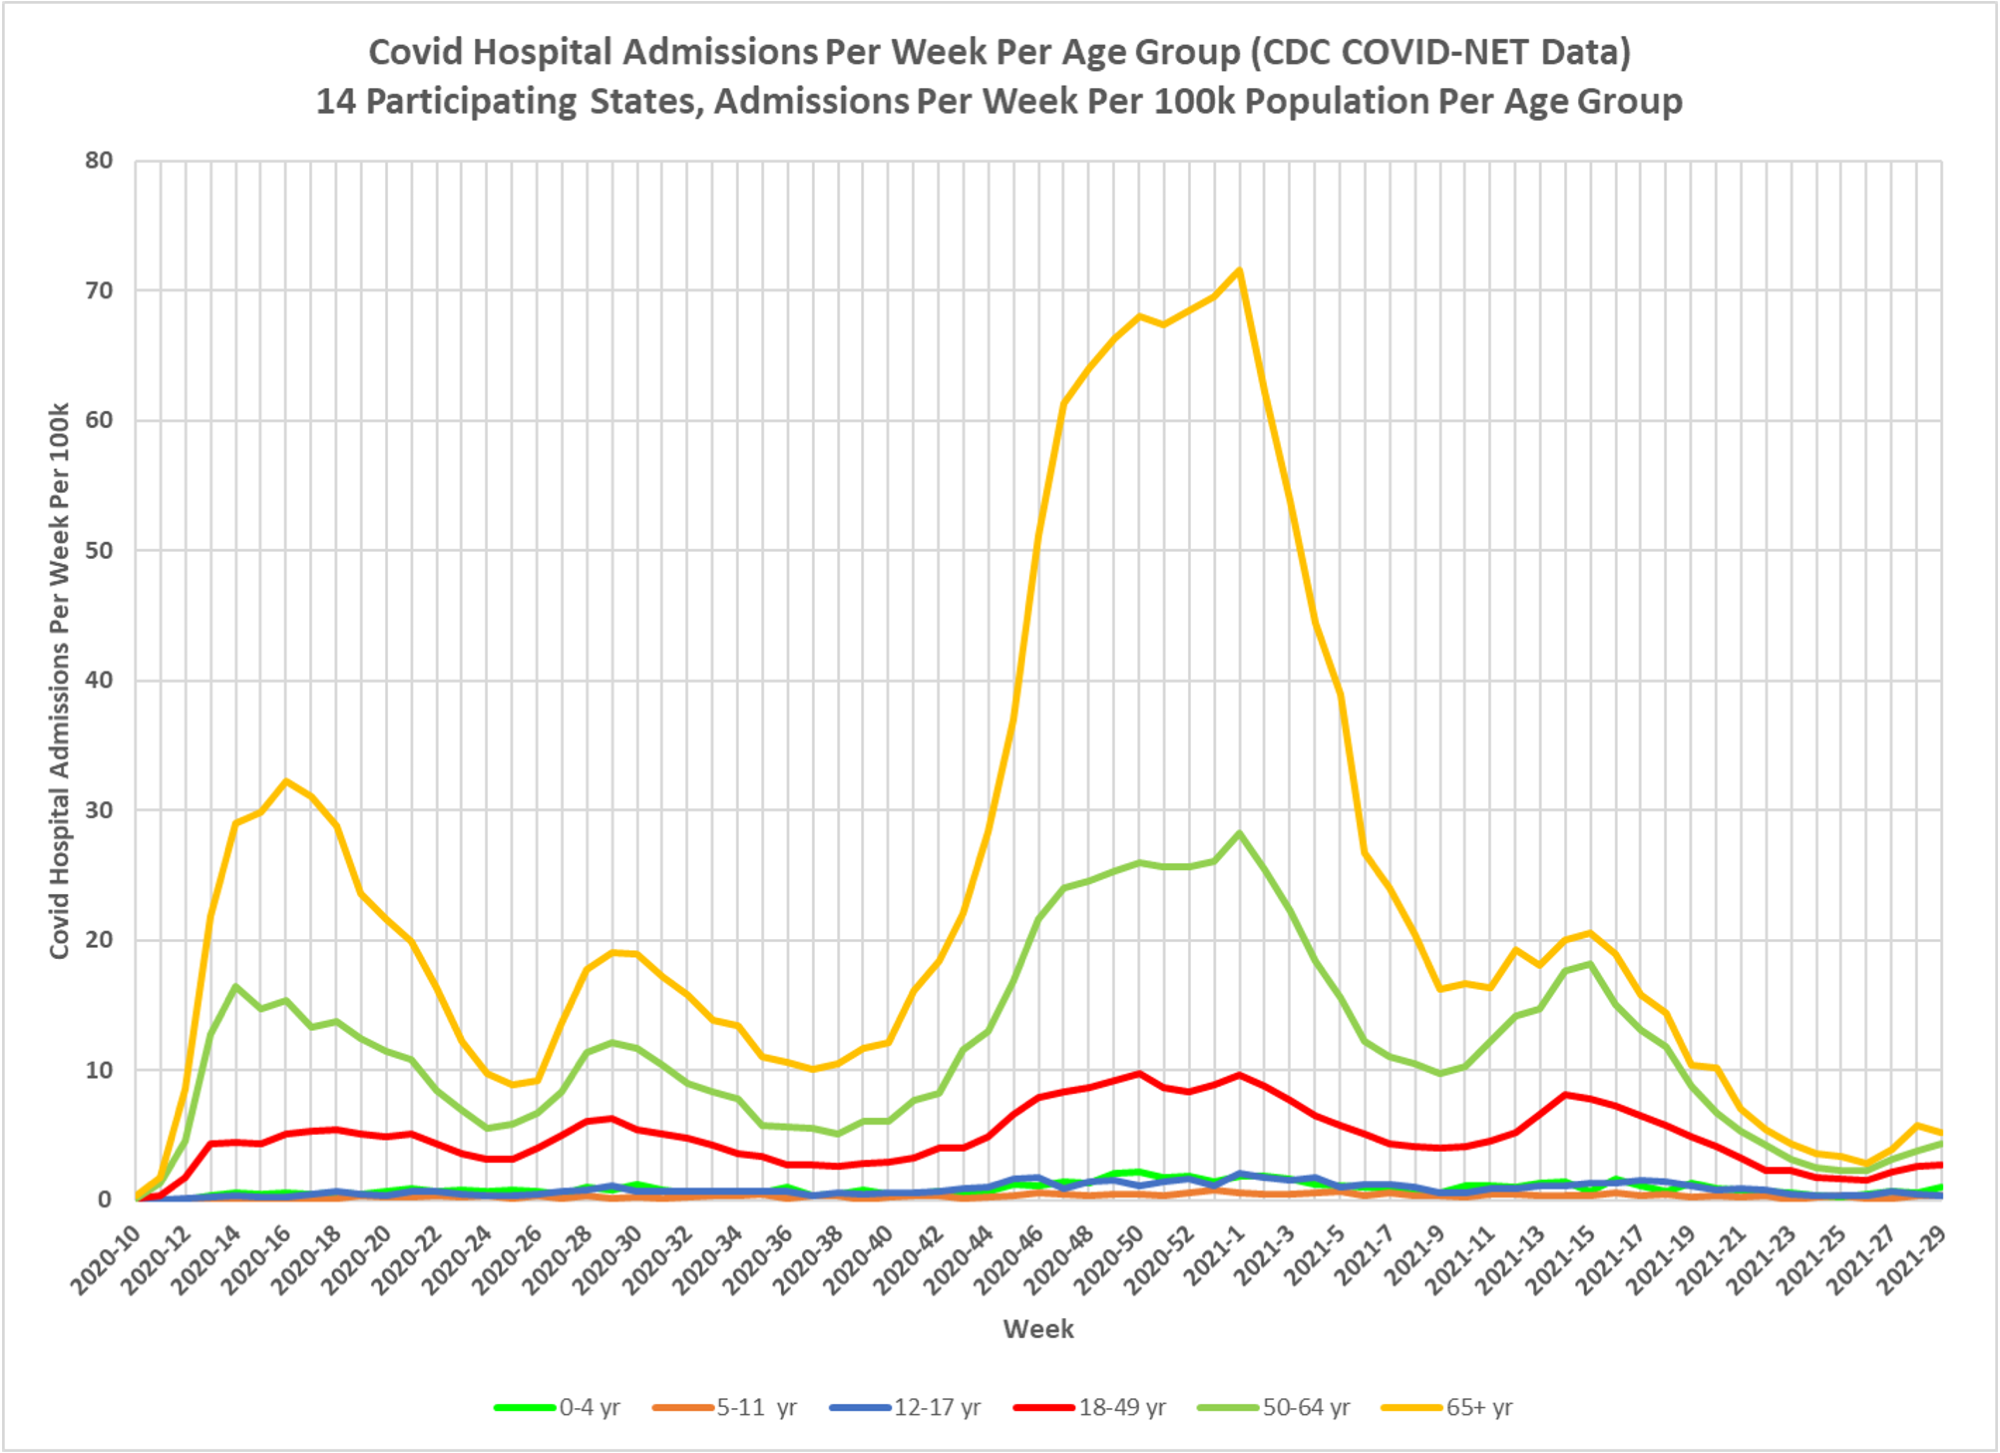
Finally, the money graph, that takes the per capita analysis these clowns tried to do and shows it to you for the entire epidemic. Looks a lot different than what they tried to pass off as research. You will again really be struck by the effect of vaccination on the older groups per capita rates of hospitalization. But look at those school age groups–the rates were clearly higher in the big wave last fall and winter, and with the exception of those over 12, there was no vaccination during the entire epidemic period. So despite no vaccination, in fact, it looks like hospitalizations among children are lower now than they were during the fall/winter. A travesty.
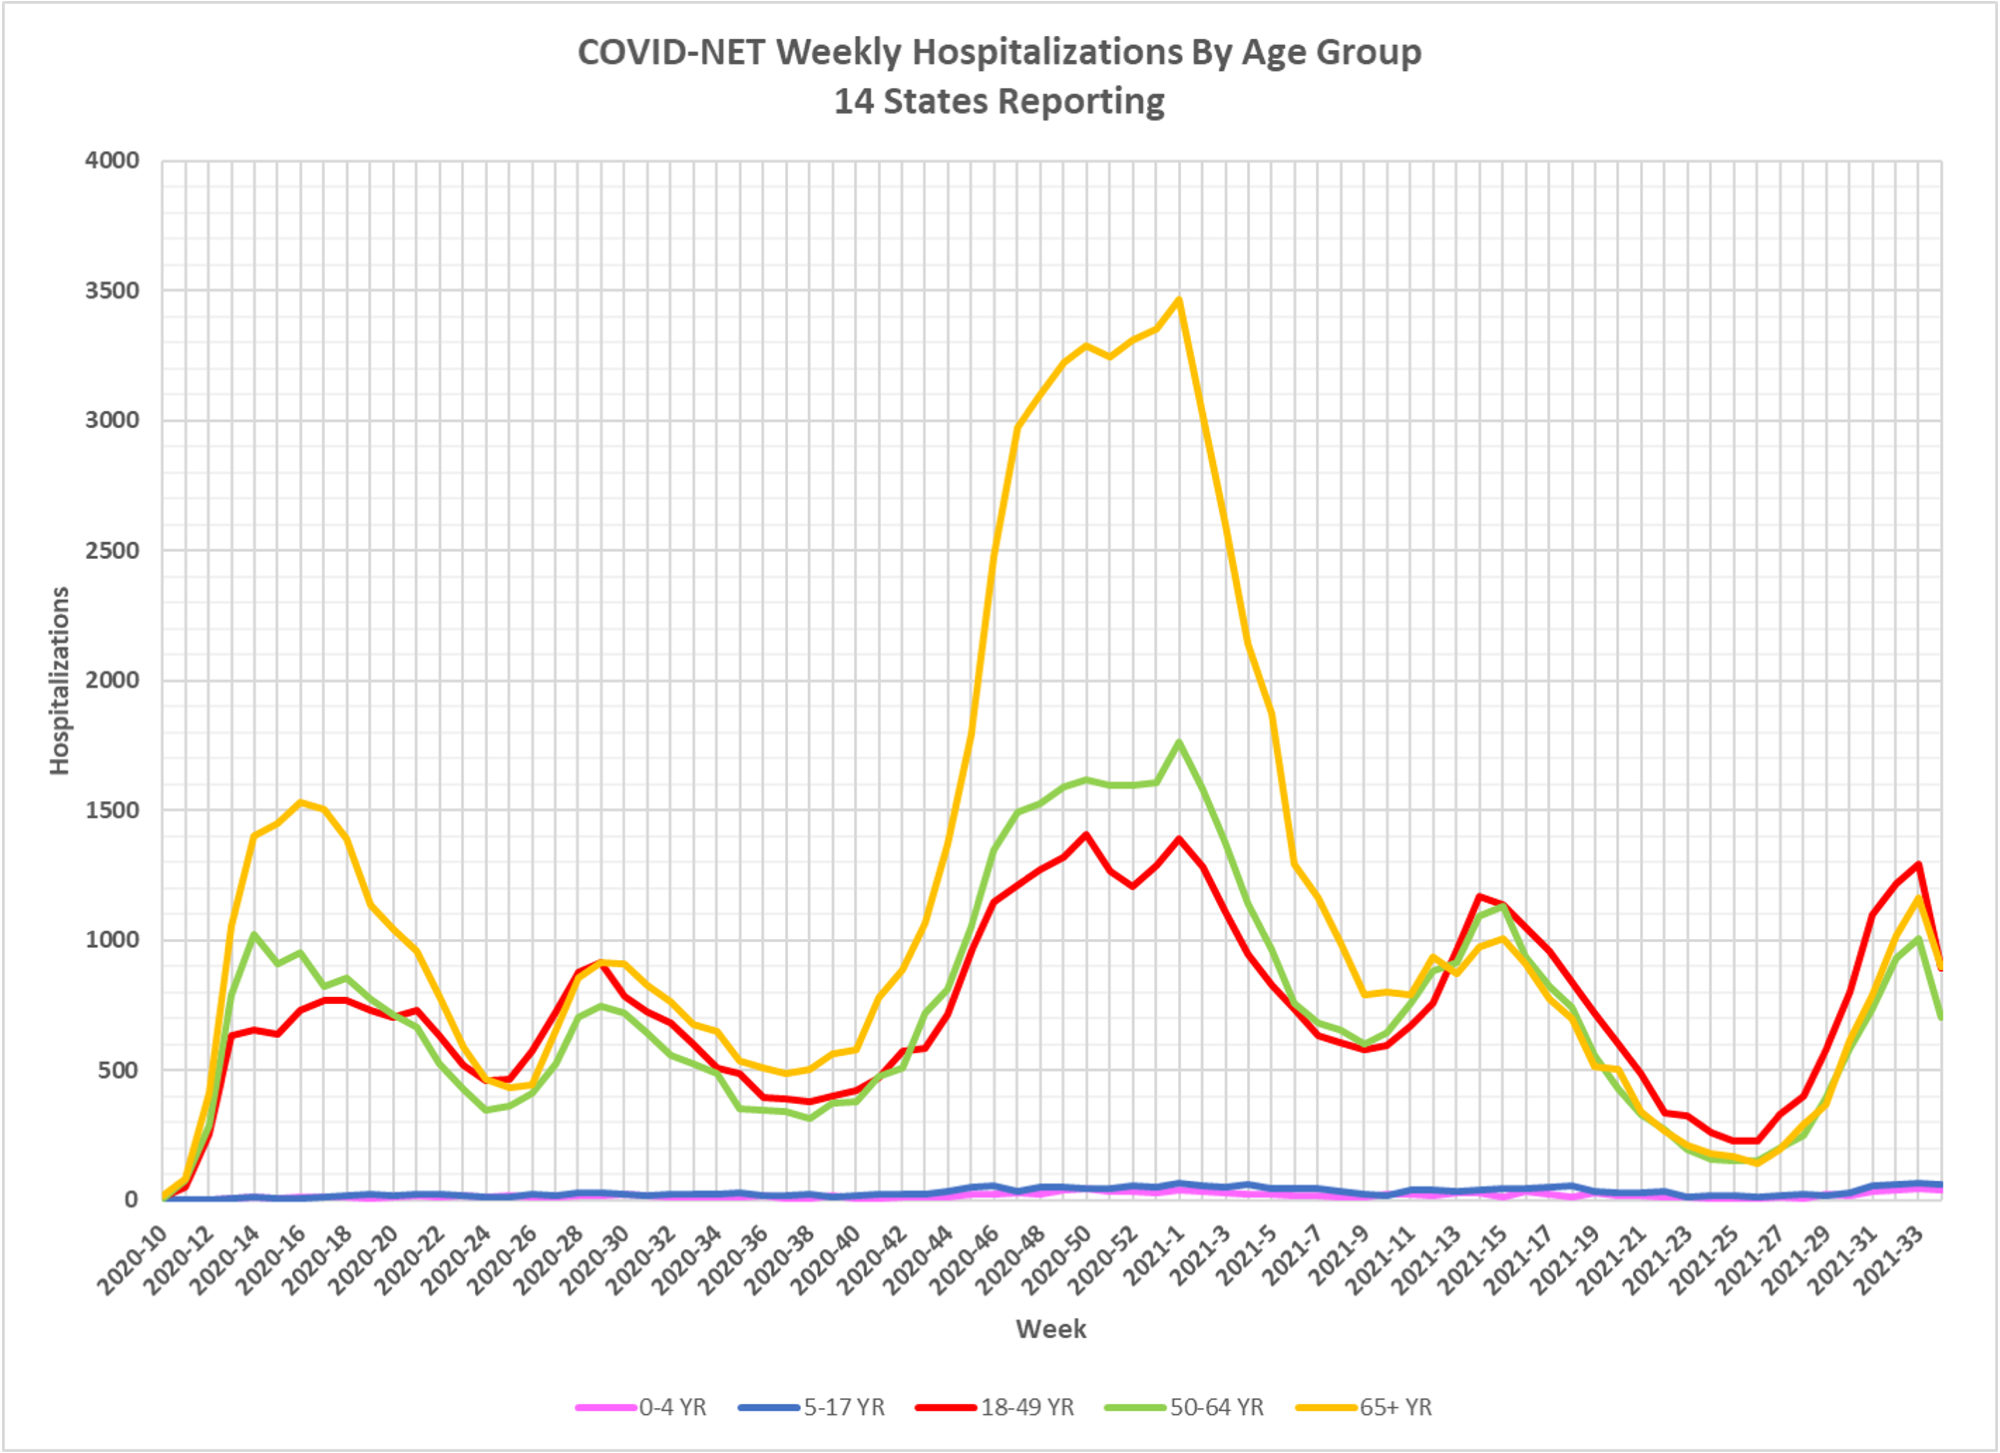

Nice data, but I am not sure I understand this: “Now look at the second graph, the one showing all age groups. The only thing noticeable there is that vaccination has clearly made a difference in the absolute number of hospitalizations in the oldest cohort. The gap in cases is down dramatically.”
I am looking at the graph with all five age groups with the vertical axis labelled “hospitalizations”. There are 5 waves. In the first and third (the biggest one), hospitalizations are much higher in the 65+ group compared to the 18-49 and 50-64 groups. But in the other three waves, all three groups are similar. So comparing the third to the last two waves, there is a very clear difference in the oldest cohort and it is tempting to credit vaccination. I think that is what you are referring to. But what about the second wave, in summer 2020? That one looks very similar to the last two waves. And that is not due to vaccination. So maybe there is more to the story.
But no question as to the main point: Kids are not at any real risk from any variant.
The second wave was really the first wave in the South, then everybody had kind of a surge in the fall/winter.
I know how fond you (we) are of the treatment of our children. You can always count on AT for a reality check !
https://www.americanthinker.com/articles/2021/09/the_disposable_children_of_the_pandemic.html