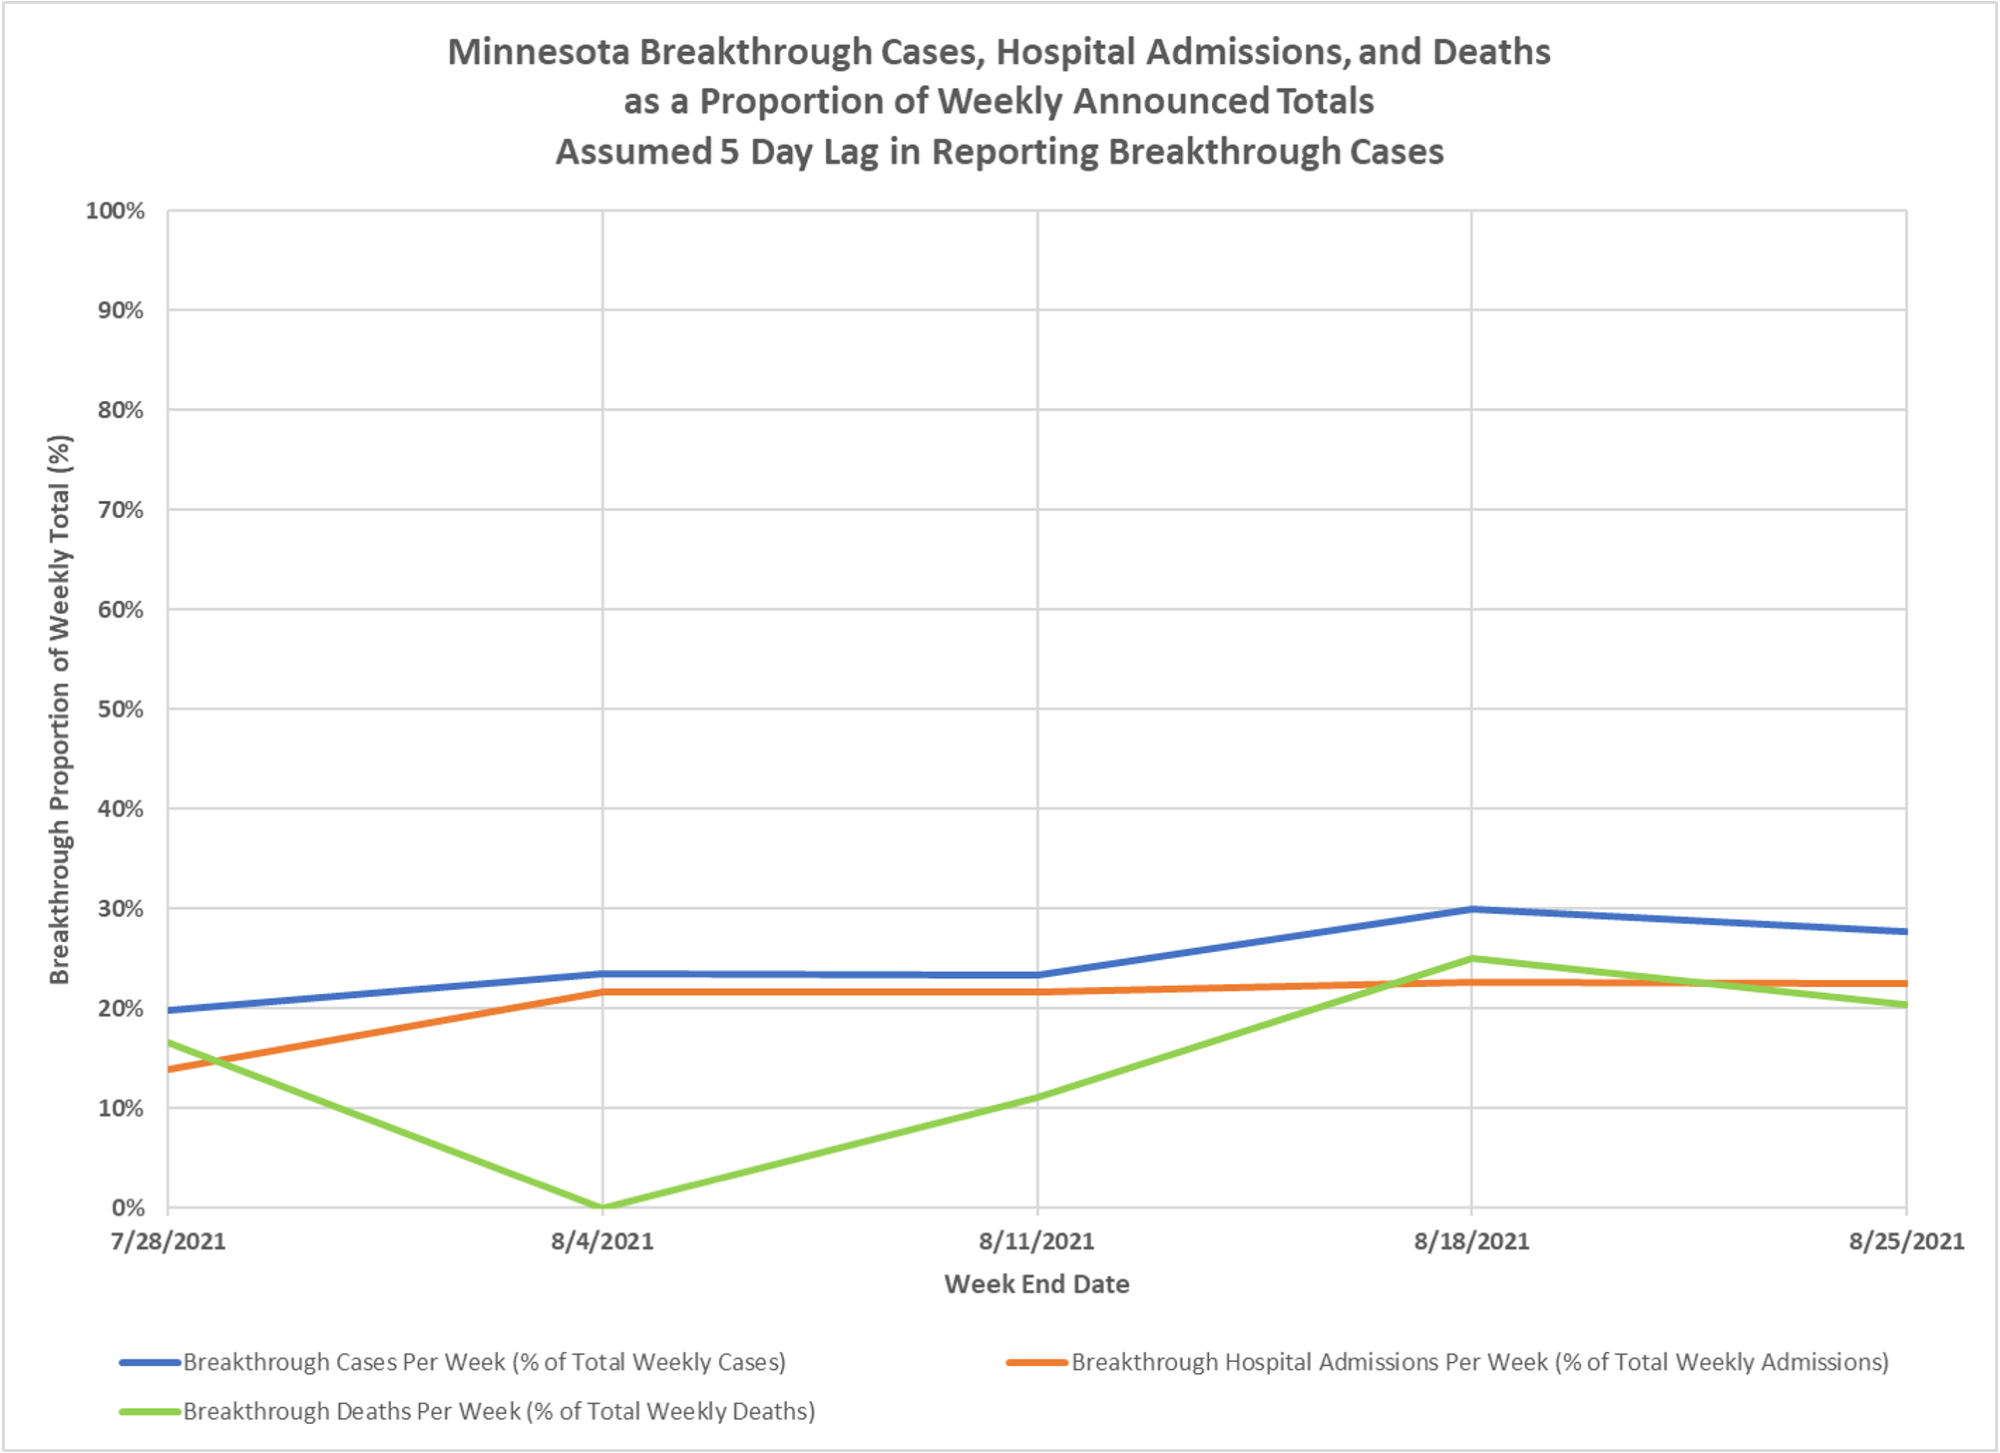
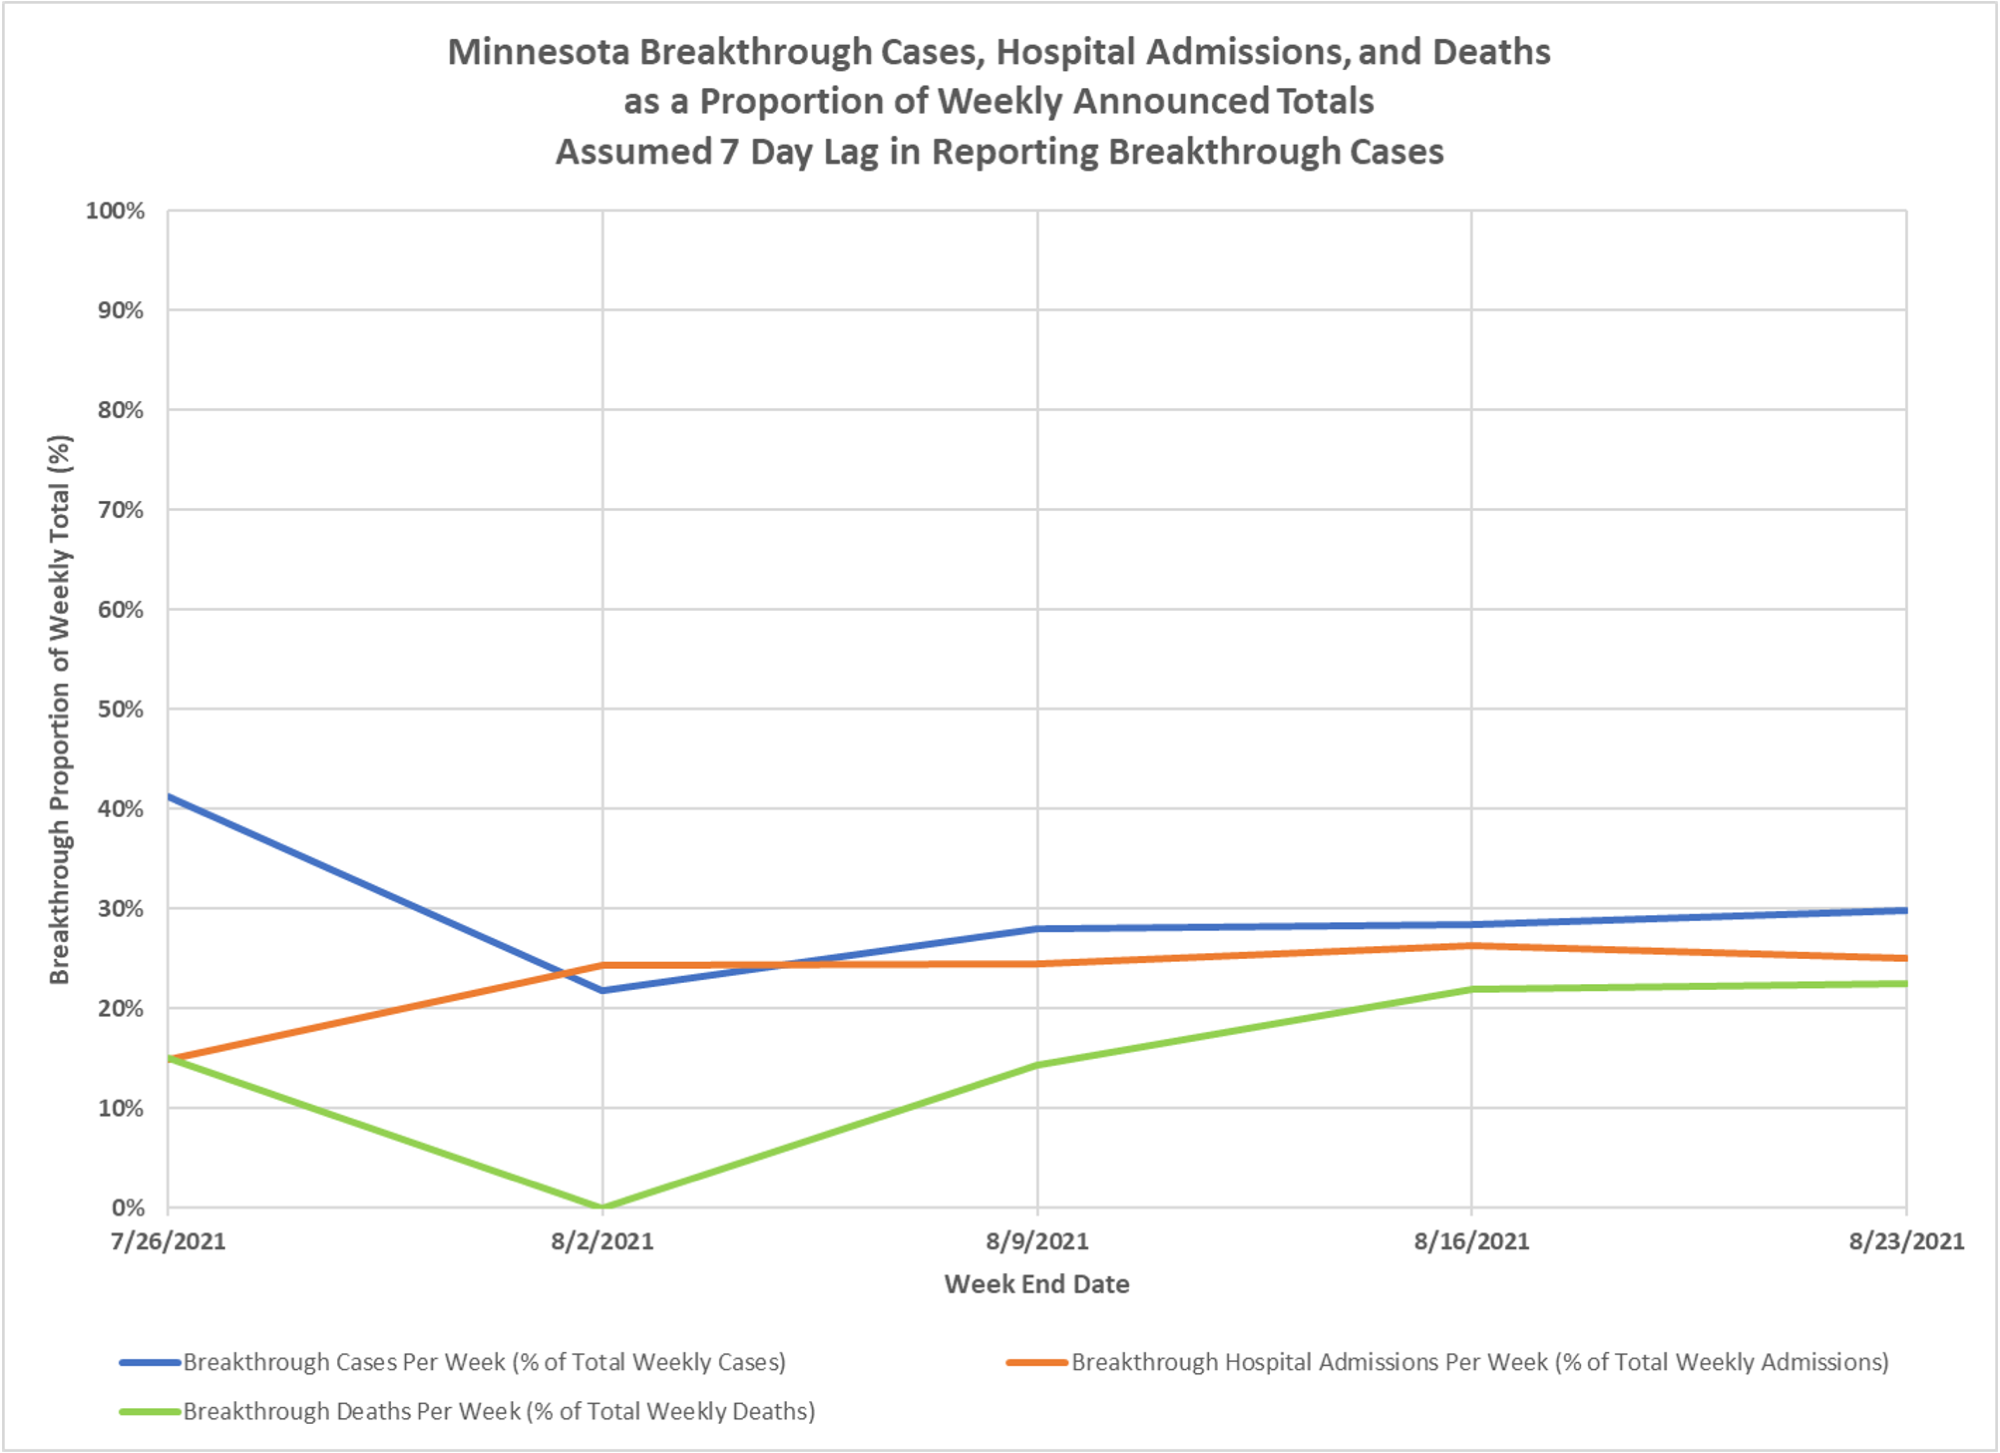
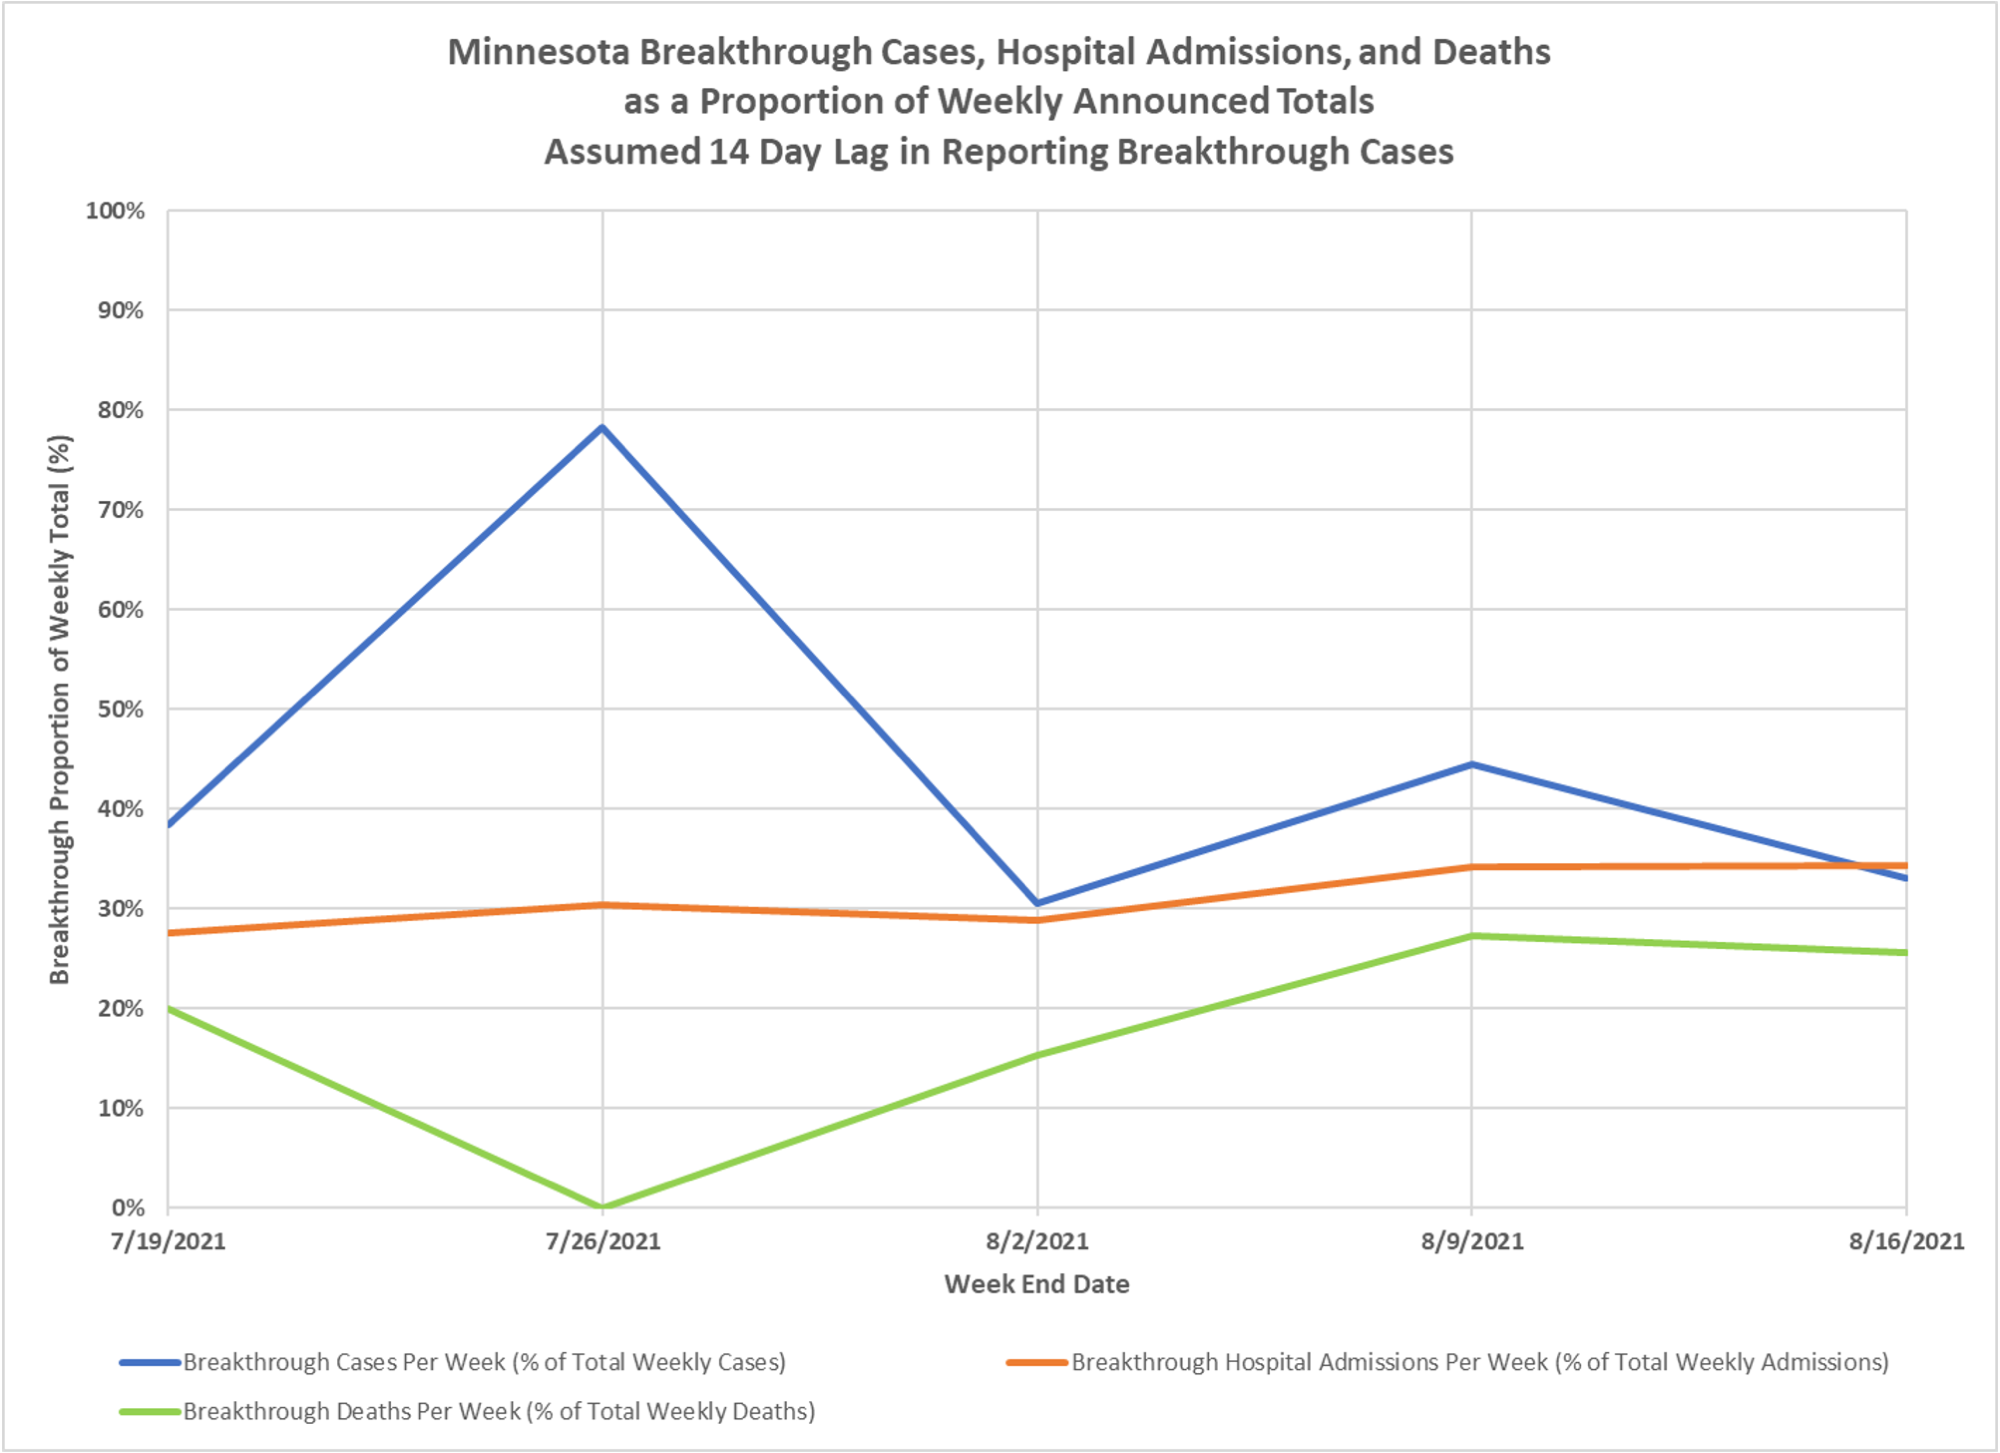
Trying to match up breakthrough cases and outcomes with the totals reported is very difficult in Minnesota. Dave Dixon is doing his best to run different approaches. The fundamental problem since we started looking at this is that the state reports once a week, but never tells you what dates the events actually occurred on. So you are reduced to trying to understand relative data lags and infer what subset of cases for a particular timeframe are breakthroughs. The state told a reporter earlier this week that it was around 30% of recent cases, consistent with what we were estimating. We will keep plugging away on this and trying to get better data reporting from the state. These charts use three different lag periods. We think the 14 day one is the most accurate guess. But the other two show you the possible range, until we get more data from the state on either the actual data lag or the real paradise, breaking out these events by actual date of occurrence.
Just to be clear, all of the breakthrough events are initially included in the total cases, hospitalizations and deaths reported by the state and distributed to the tables of occurrence by date. The state then does a separate process to match these events to fully vaccinated persons. So there is no change to the totals when an event is identified as breakthrough, but it does change to proportions. Oh, and substantively, note that we have a substantial proportion of cases among the fully vaxed and I am very confident that will continue to rise.