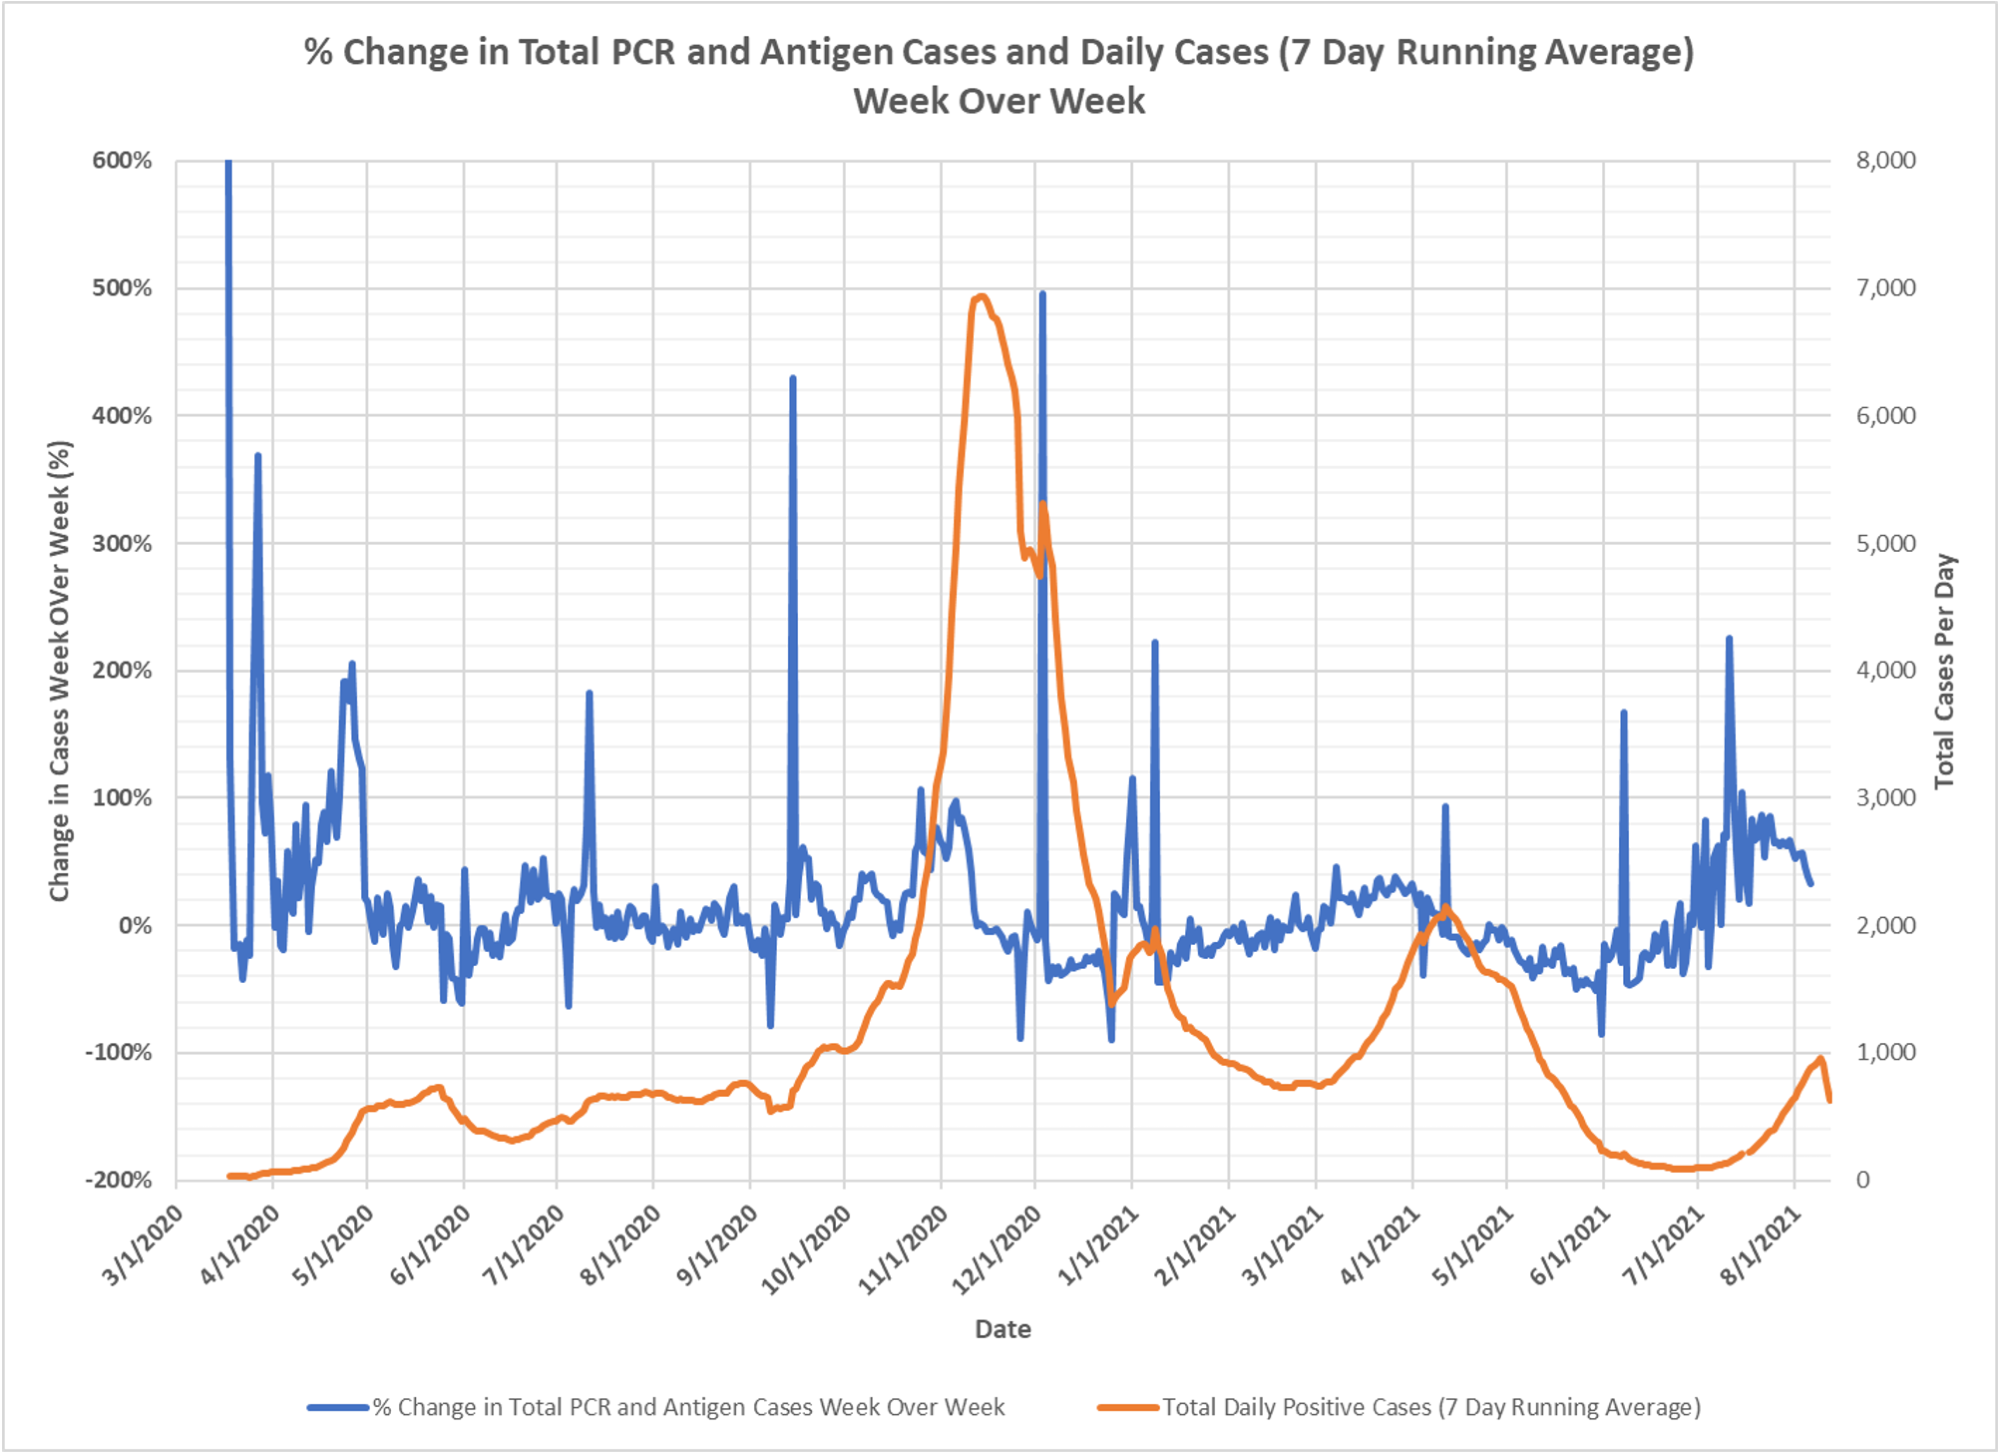
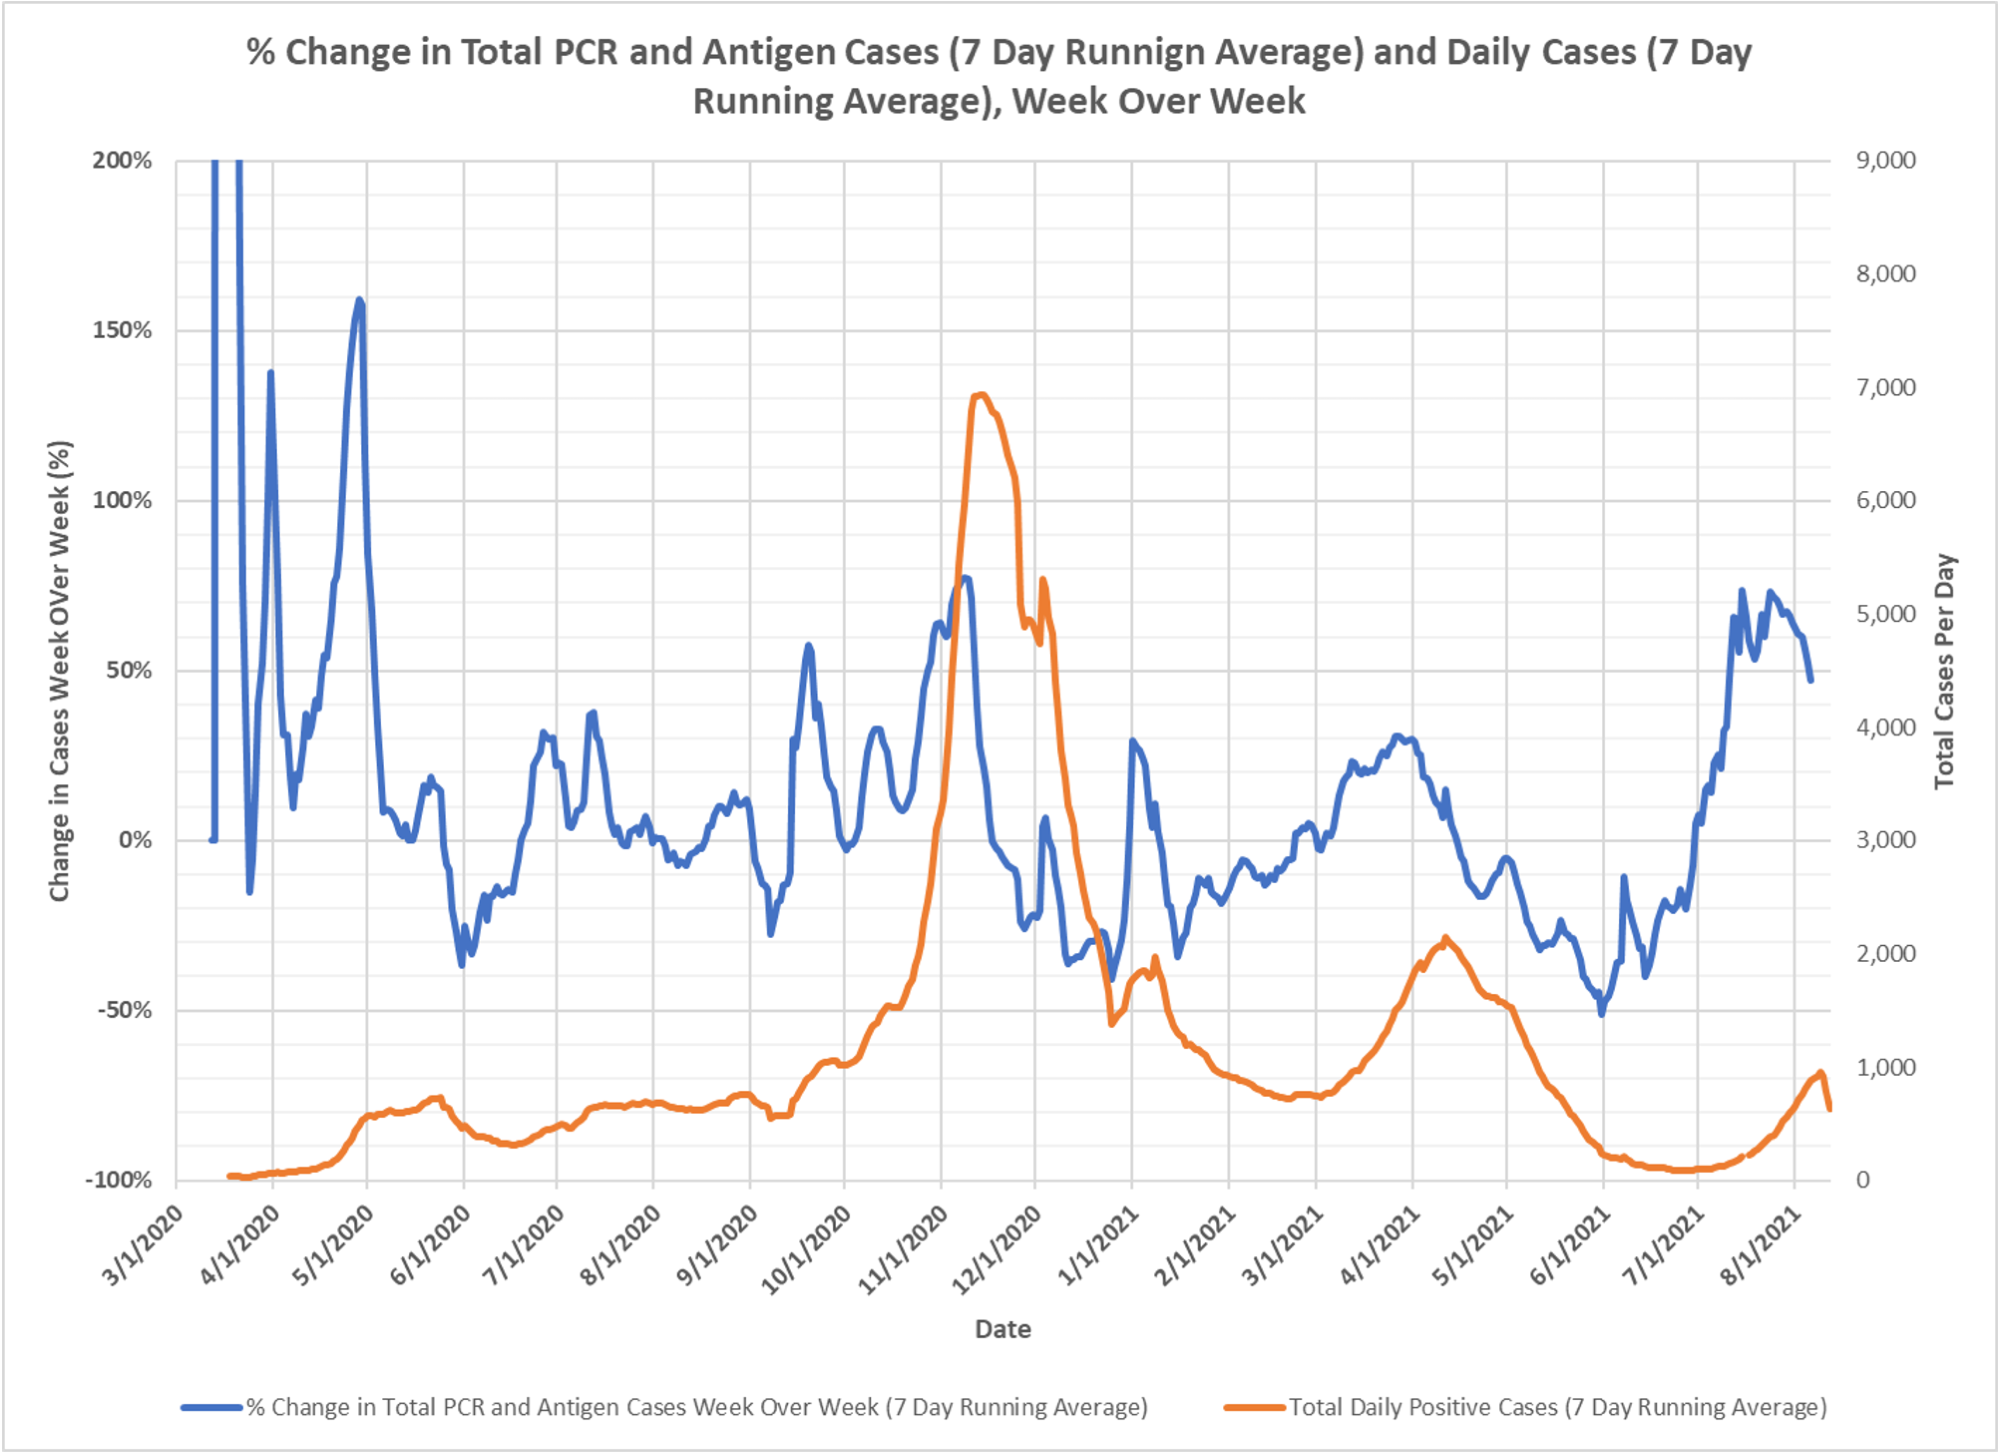
Another way to track trajectory is to look at the percent change in cases for the same day of the week a week later. It isn’t the week-over-week percent change that is most important, it is the change or trend in those percents. If the percent week-over-week trend is up, the epidemic is gaining steam, if it is declining, it is running out of steam. This analysis is lagged a little to allow for fuller reporting of cases for a specific day; it takes a number of days for the cases that were identified on a specific day to be reported to DOH. You can see, however, that the week-over-week change peaked before cases did, so it is a leading indicator. I would not yet read too much into the most recent part of the charts, but they might indicate that we are not headed for a significant wave. Relatively small number of cases, however, so could change quickly. The spikes are as usual due to some weird data reporting artefacts at the state. If we have another week of rough plateauing, however, we have at least an intermediate top. Great work from Dave Dixon once more.

Hard to place too much meaning here as the ardor for doing PCR tests has fallen somewhat, and the false +s are likely in the 90% range. One needs to look at morbidity and mortality with reliable post illness testing for abys. Otherwise, it’s all smoke.