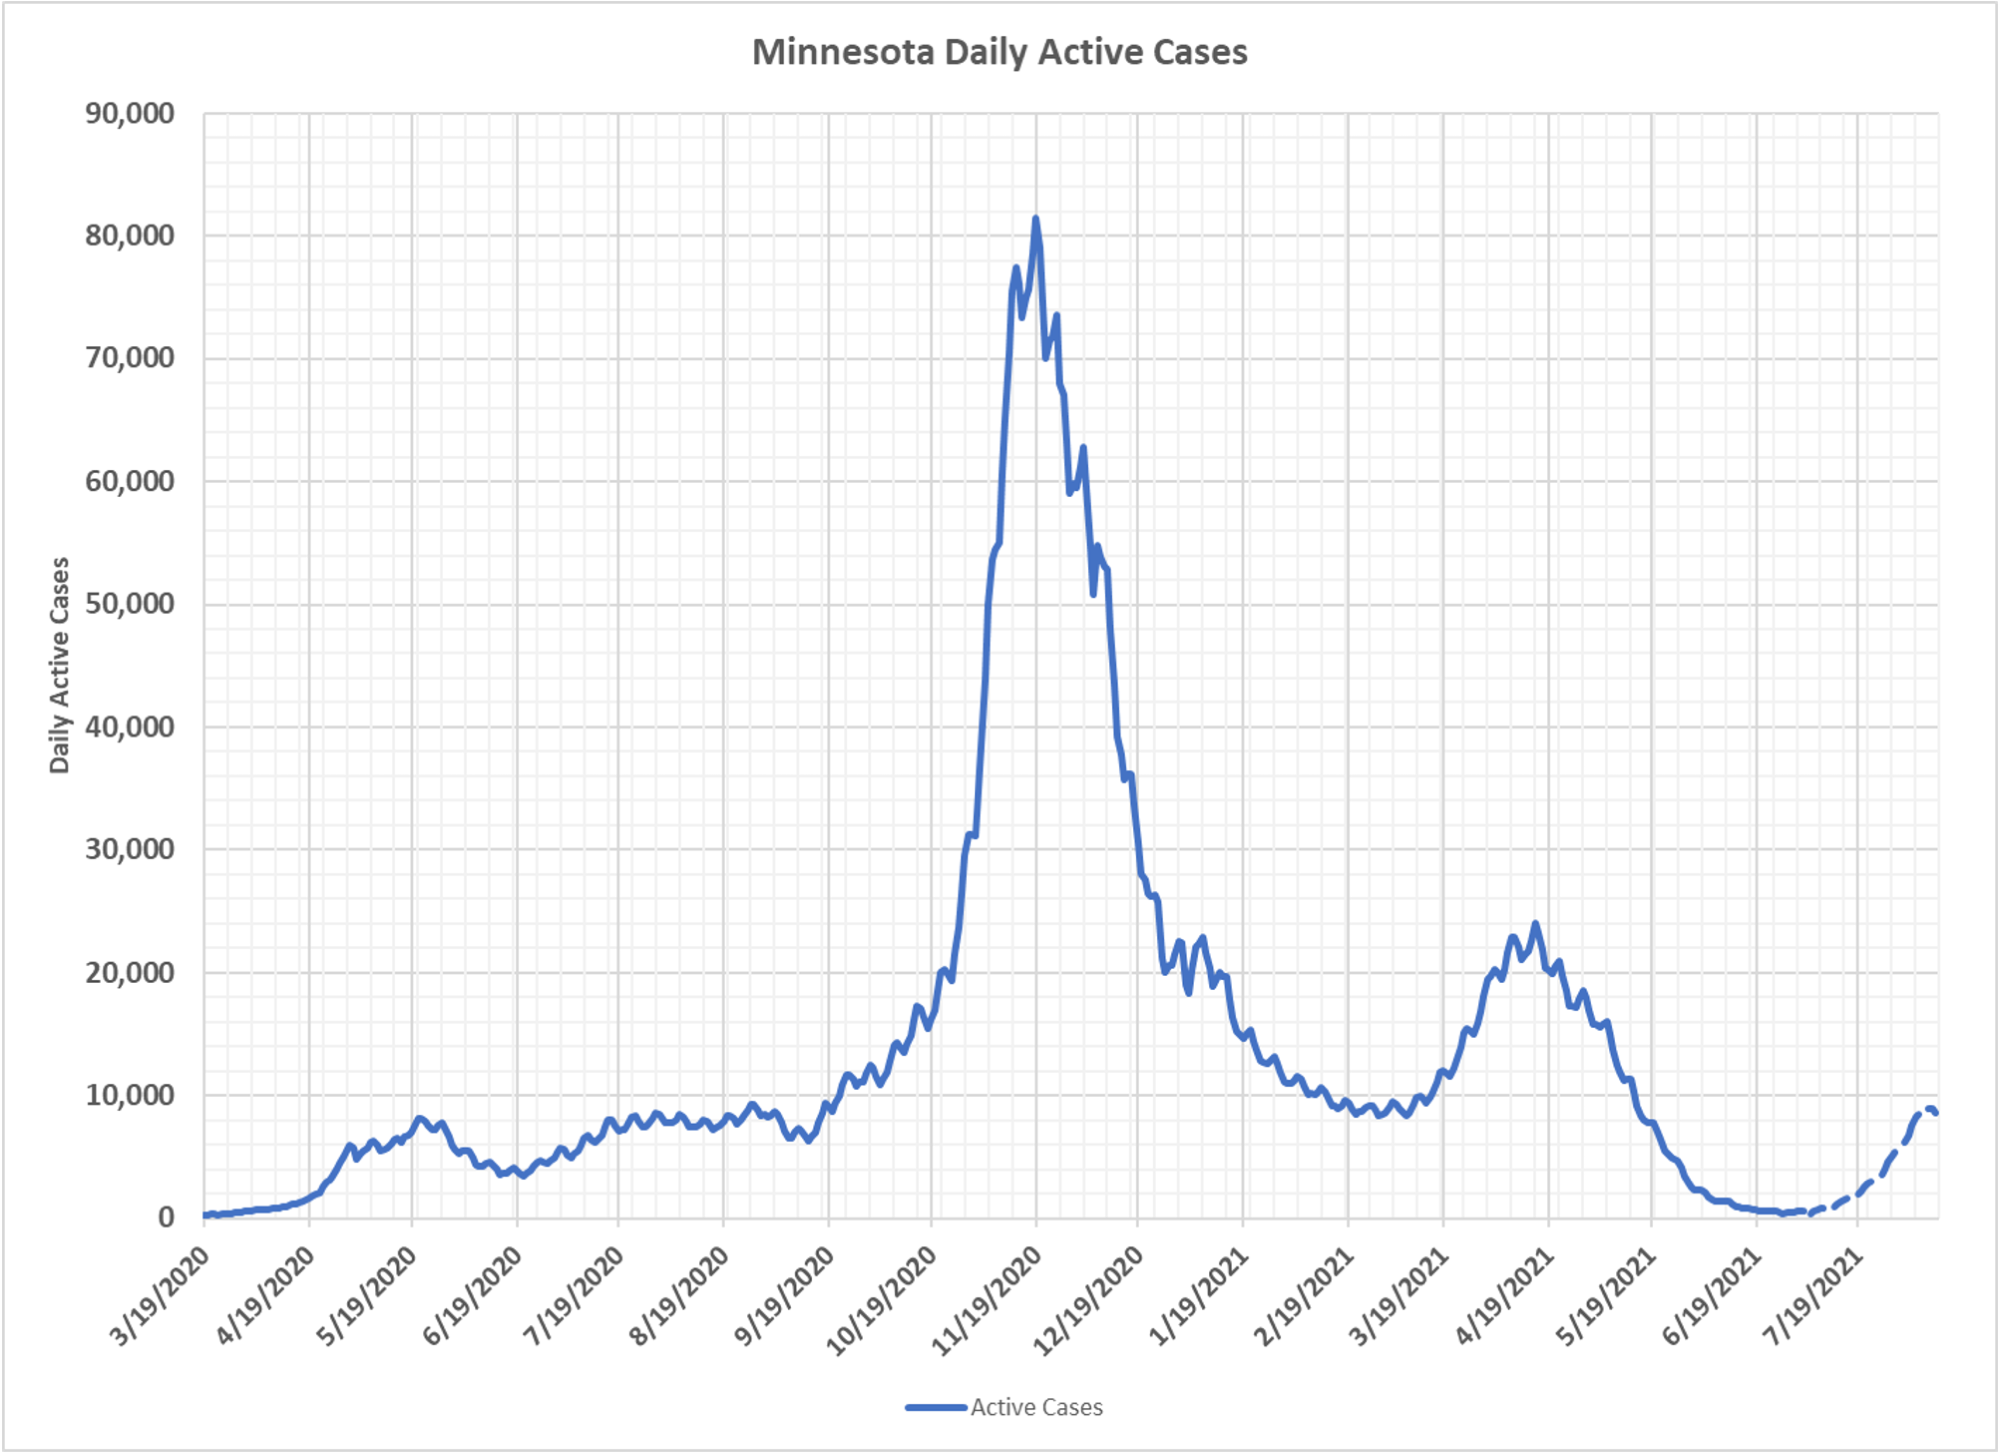
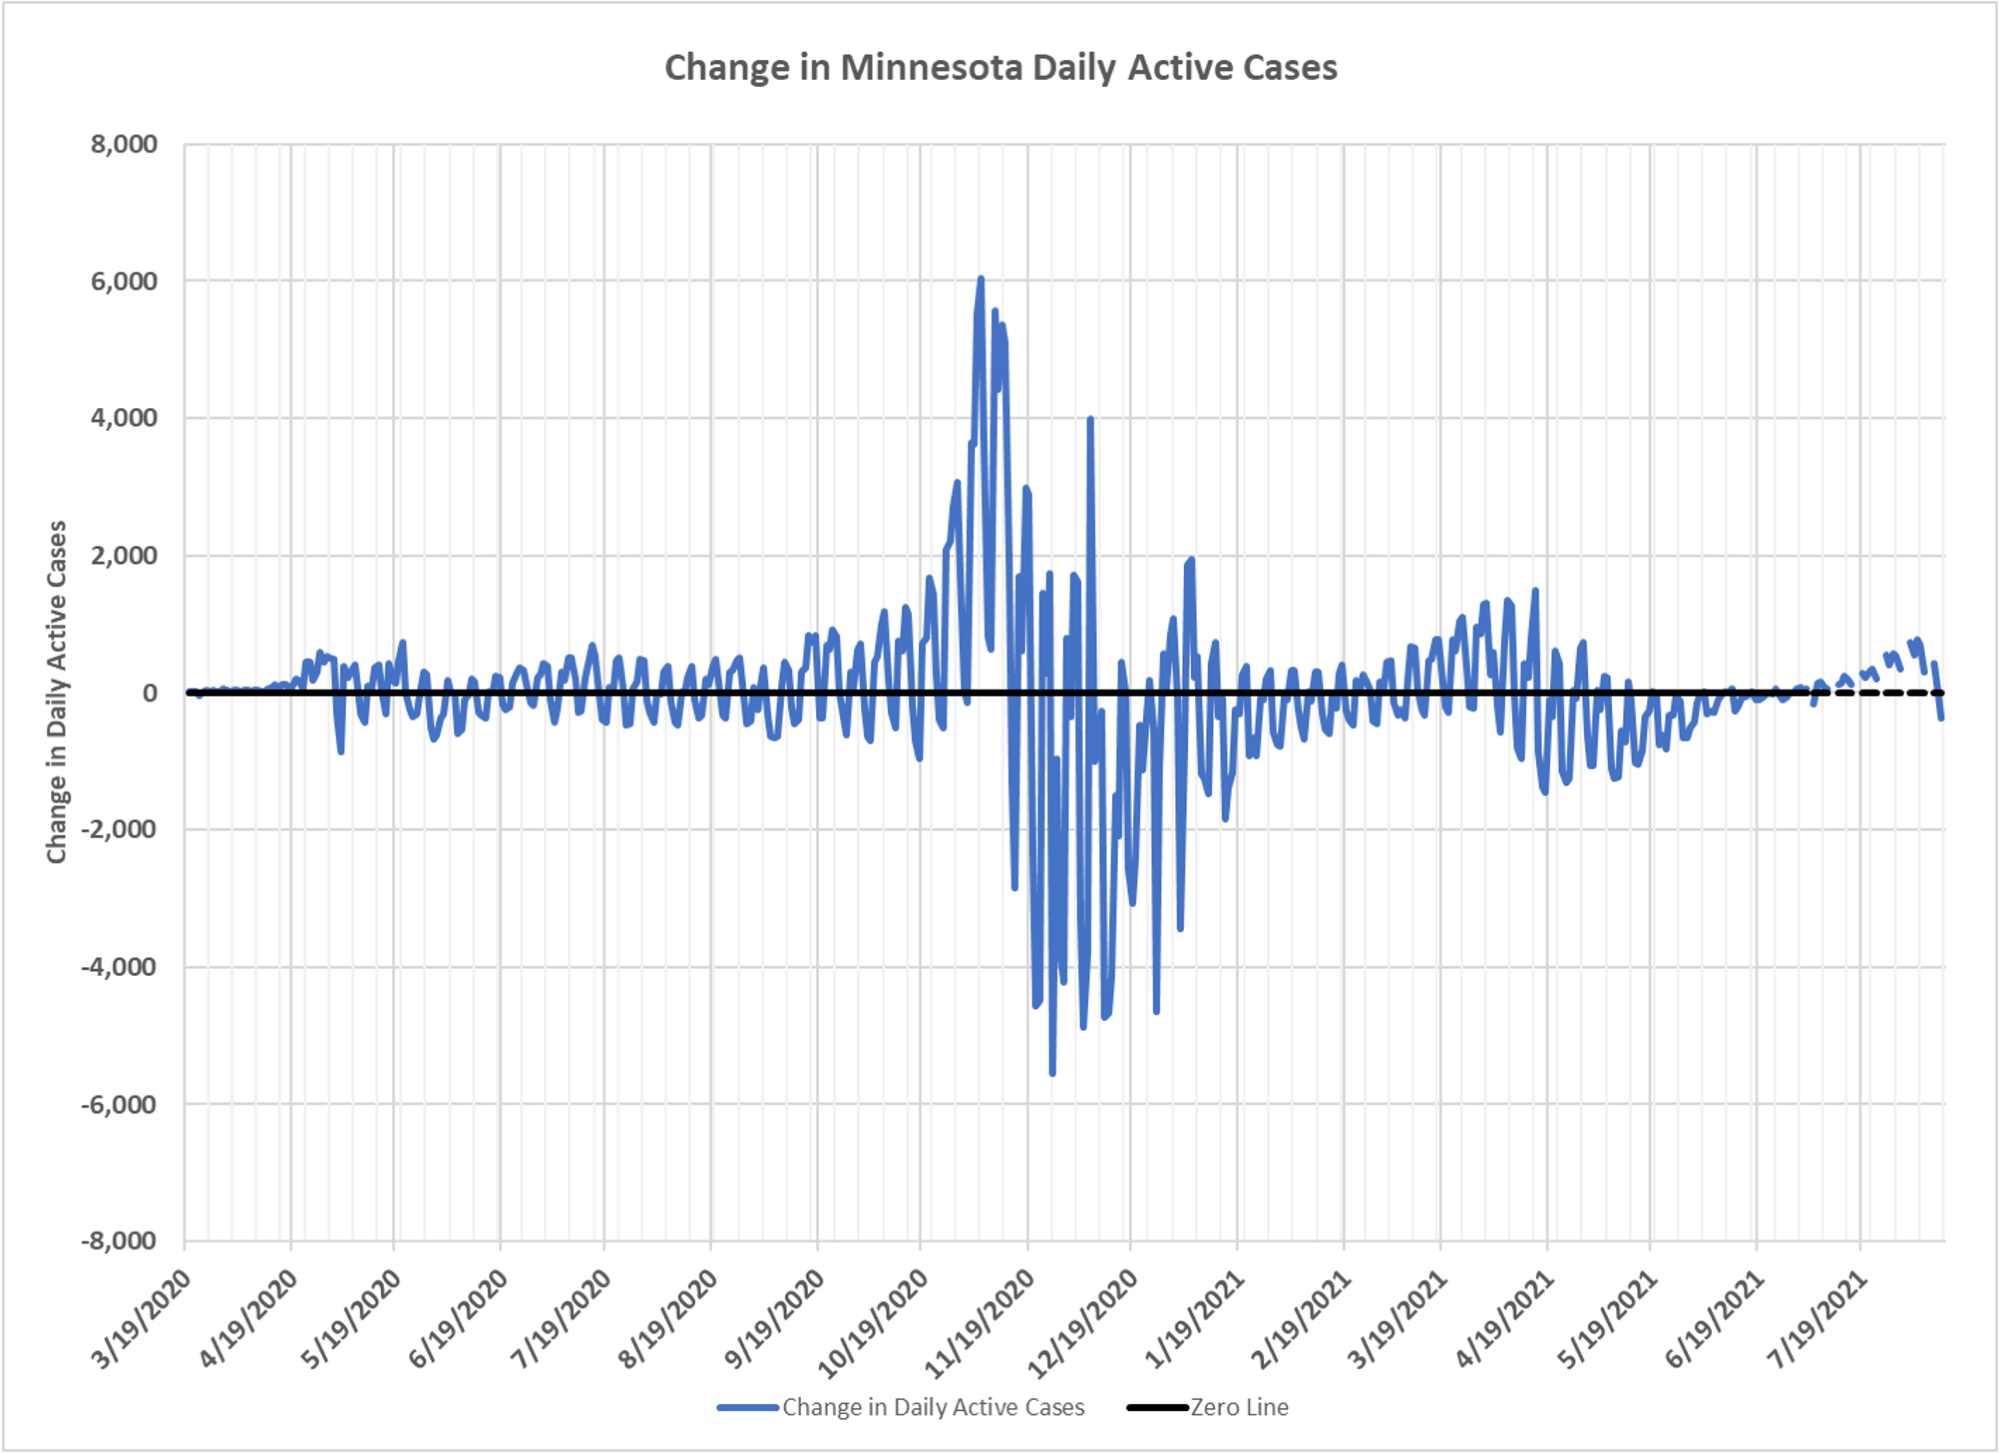
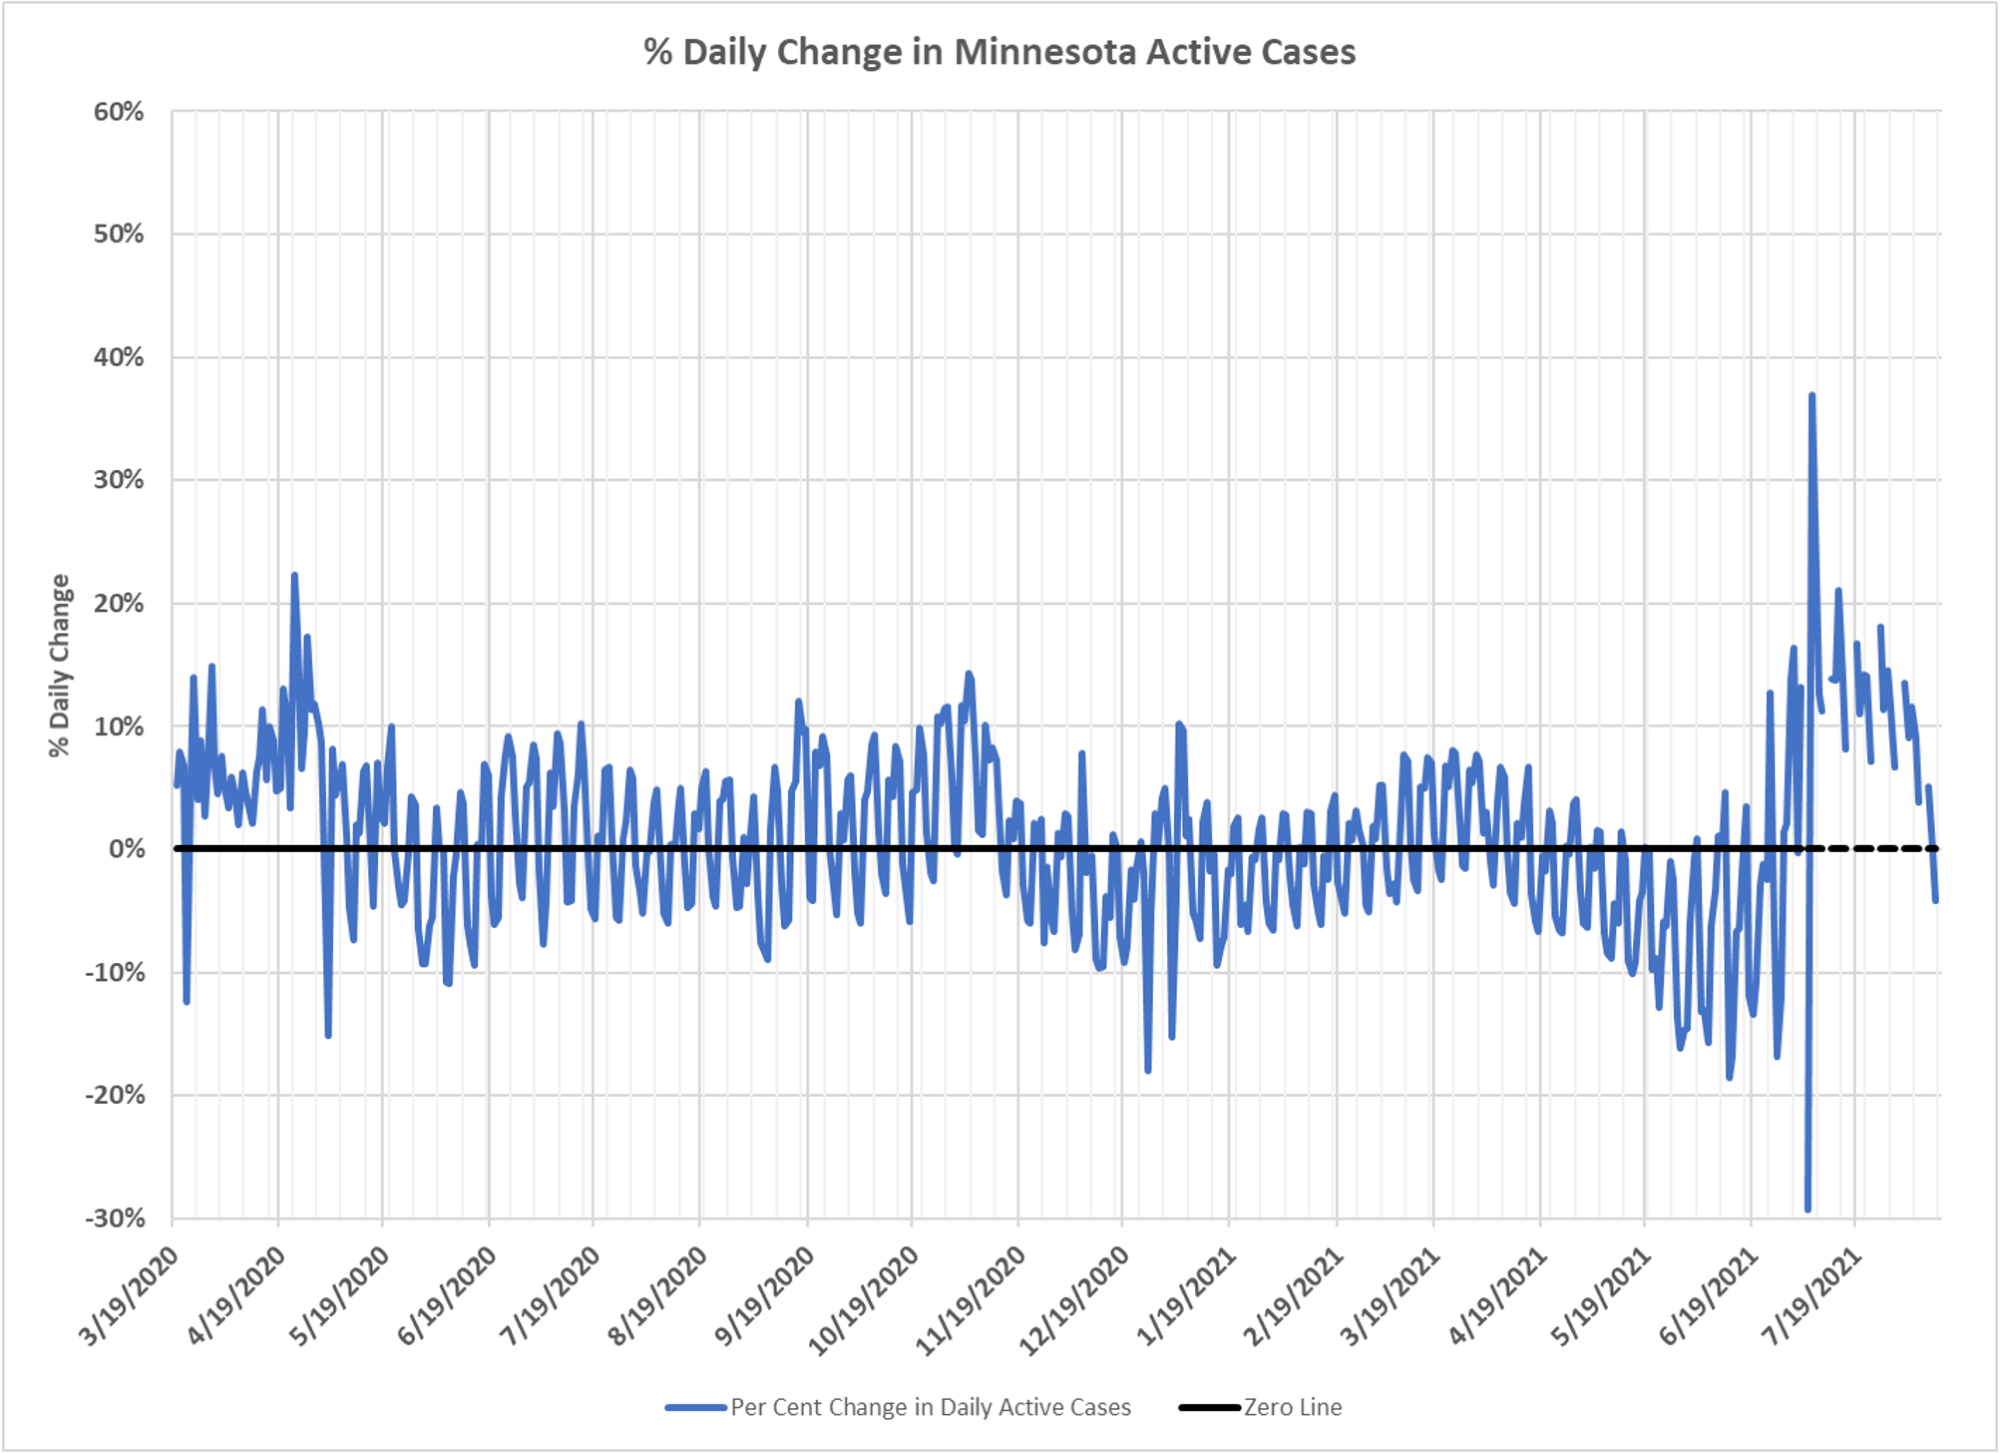
The usual charts on Active Cases from Dave Dixon. Again these represent the likely actual infectious people, although we are missing undetected cases on the one hand and it likely overstates how long people are infectious on the other hand. In any event you see the recent bump; but it looks possible that case growth rates are already plateauing. Have to see what the next few weeks brings, before we hit the fall period that might be quite favorable for transmission.
✅ Subscribe via Email
About this Blog
Healthy Skeptic Podcast
Research
MedPAC 2019 Report to Congress
June 18, 2019
Headlines
Tags
Access
ACO
Care Management
Chronic Disease
Comparative Effectiveness
Consumer Directed Health
Consumers
Devices
Disease Management
Drugs
EHRs
Elder Care
End-of-Life Care
FDA
Financings
Genomics
Government
Health Care Costs
Health Care Quality
Health Care Reform
Health Insurance
Health Insurance Exchange
HIT
HomeCare
Hospital
Hospital Readmissions
Legislation
M&A
Malpractice
Meaningful Use
Medicaid
Medical Care
Medicare
Medicare Advantage
Mobile
Pay For Performance
Pharmaceutical
Physicians
Providers
Regulation
Repealing Reform
Telehealth
Telemedicine
Wellness and Prevention
Workplace
Related Posts
Commentary
February 1, 2023
United States Excess Deaths, Part 2
Per capita rates of deaths in the US as Dave continues his excellent analysis of…
Commentary
January 30, 2023
Excess Deaths in Minnesota, Part 7 Revisited
A revised look at excess deaths and death rates using a ten year baseline.
Commentary
January 30, 2023
Excess Deaths in the United States
A foray into excess death calculations in the entire nation.