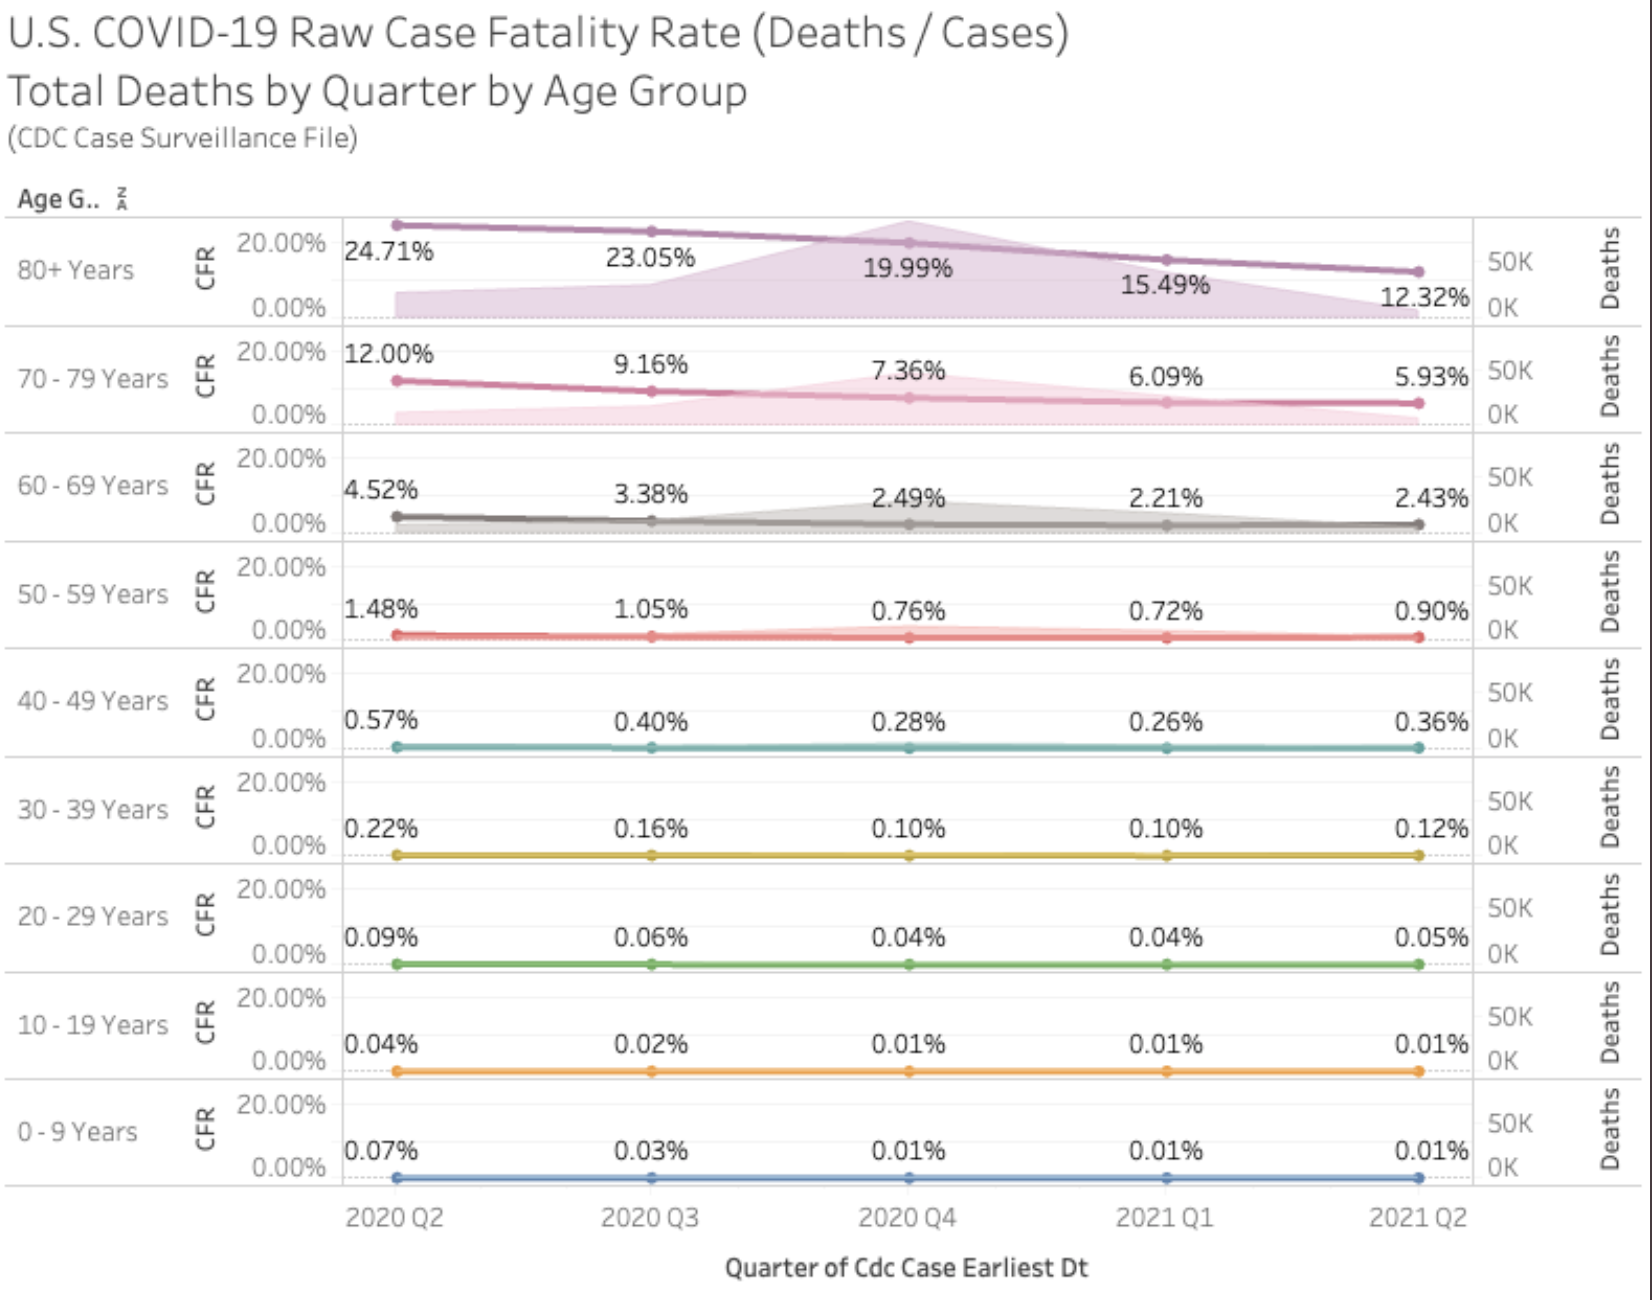
Chart thanks to Phil Kerpen on Twitter. At one point early on people were saying that the epidemic would kill 20% of the people the virus infected, then 5%, then 1%, then .5%. Turns out the real CFR or case fatality rate might be .2%. And for those who haven’t been reading for a while, we know that the reported infections or cases are likely only a fraction of the total. Many people have such mild or asymptomatic infections that they never get tested. So the infection fatality rate or IFR is likely .1% or less, down in influenza territory. Yep deadly virus ever. The chart shows the effect of better treatment, vaccines and also front-loading, where the most vulnerable get infected earlier in the epidemic.

It’s all fear porn.
Using the COVID-19 Dashboard of the Johns Hopkins University, I’ve been doing a bit of my own tabulations. For this year, the month with the highest CFR was Feb with 2.98%. Prior to July and August, the month with the lowest was April at 1.28%. Here’s what I’ve come up with from May on:
May Cases 970,175 Deaths 19,237 (594,431) 1.98
Jun Cases 392,494 Deaths 10,036 (604,467) 2.56
Jul Cases 1,294,274 Deaths 8,548 (612,122) 0.66
Aug Cases 817,824 Deaths 3,814 (616,829) 0.47
So, while the cases surge there is a definite decline in the CFR.
excellent analysis, and I suspect it is even lower because we likely are missing a lot of “infections” in both the previously infected and the vaccinated, who have much higher rates of asymptomatic infection.
Kevin Roche,
Thank you. In addition to the question with regard to infections, it seems to me, some time ago, there was a question of the number of deaths. There’s something which sticks in my mind the CDC even stated they might have been over estimated to the extent of 130,000. We go with what’s at hand with the hope we’re able to gain as accurate perspective as possible.