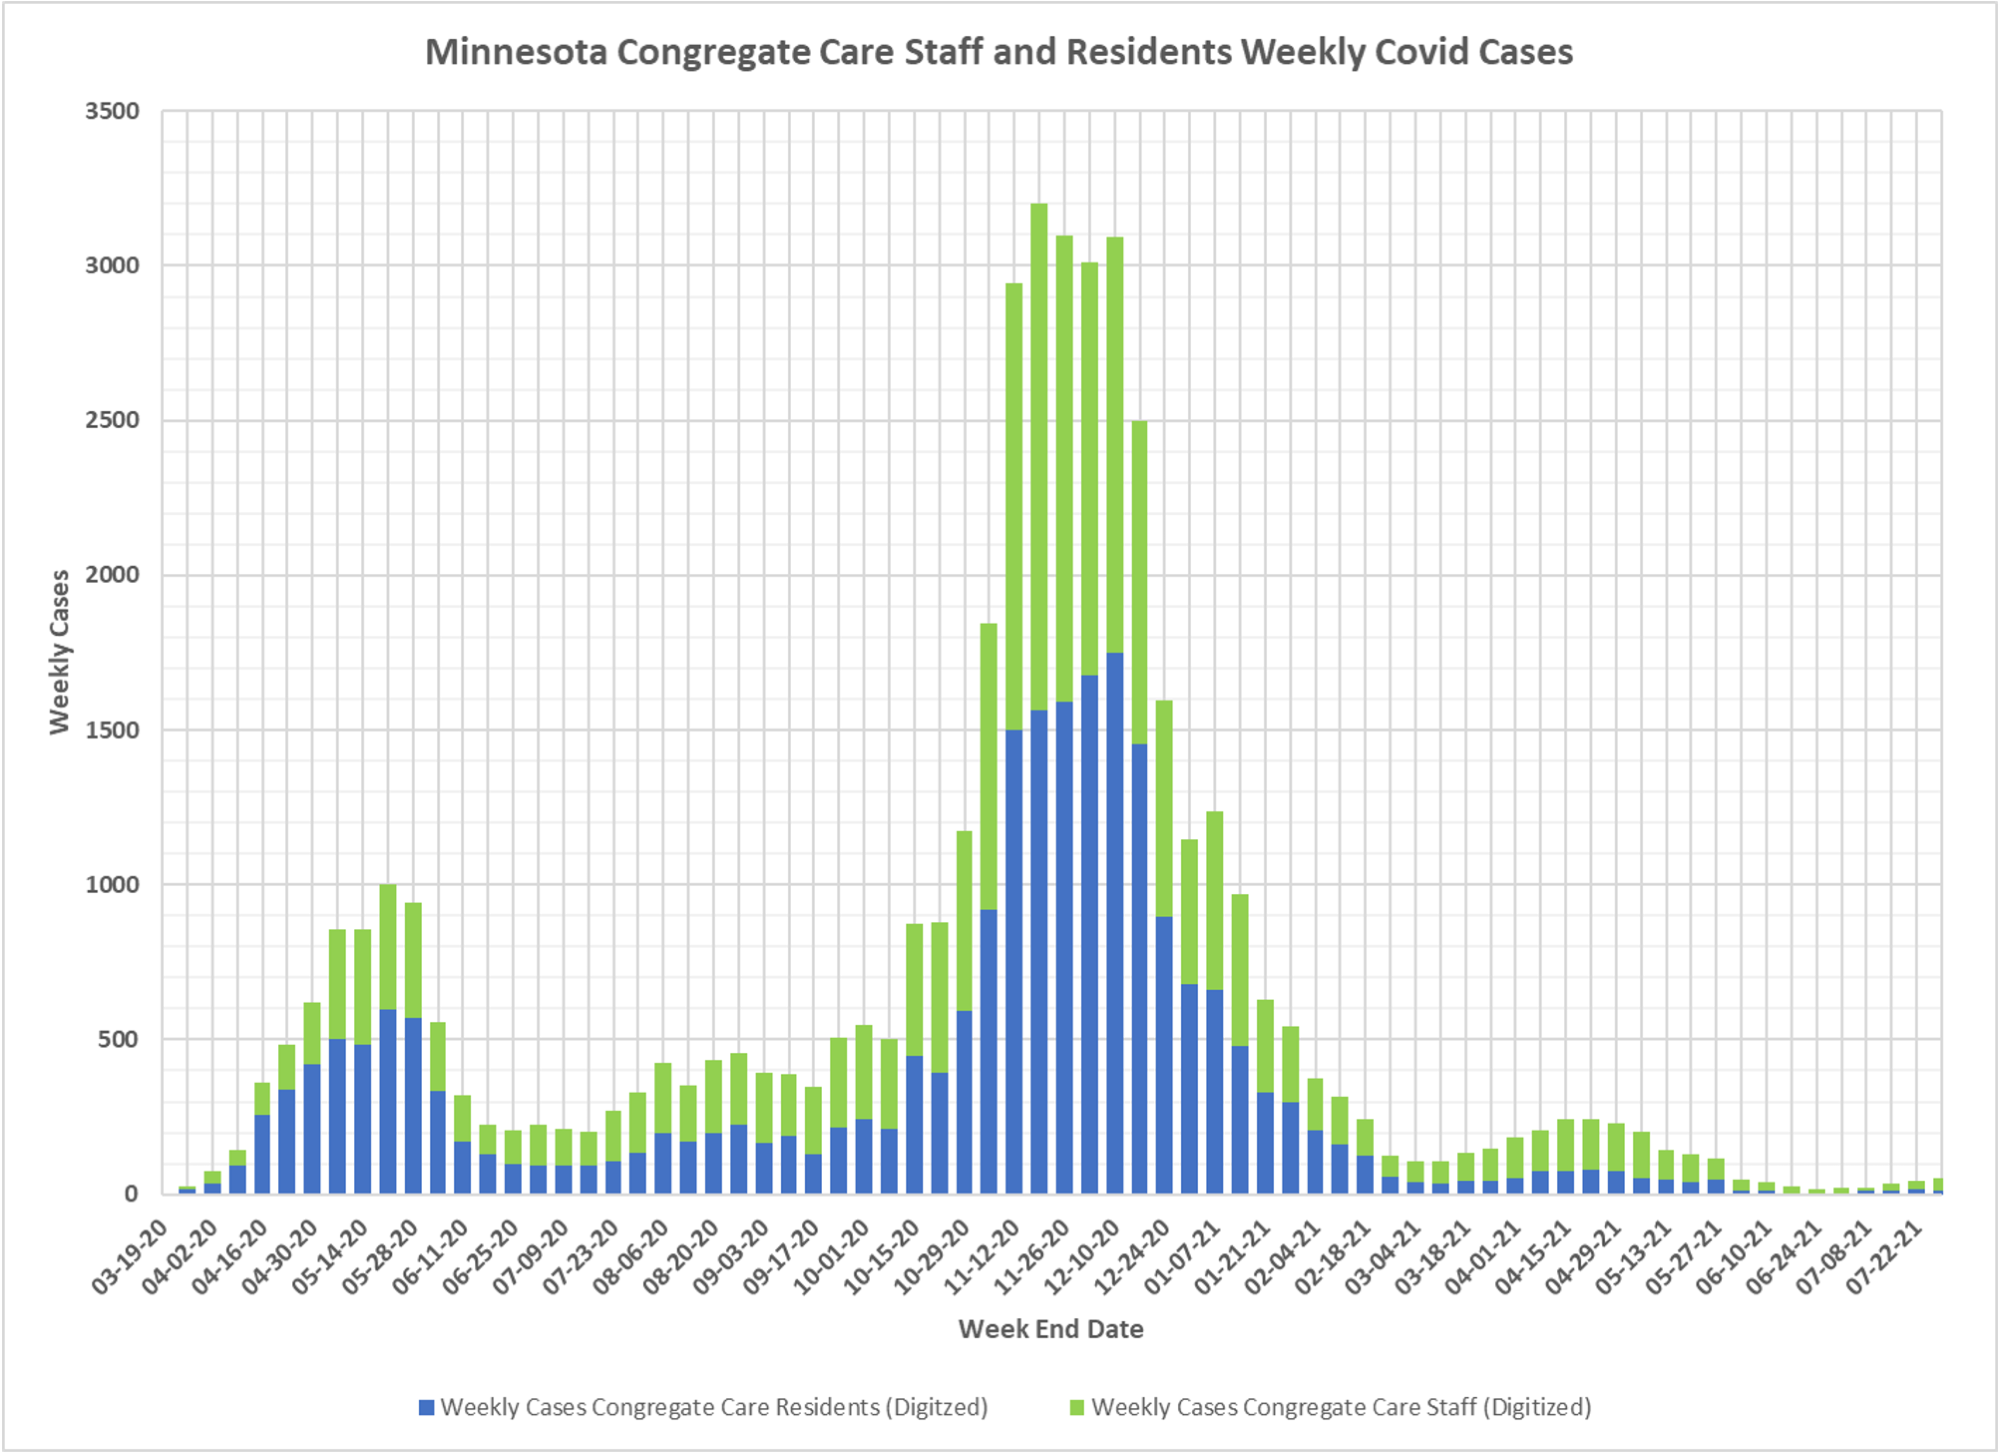
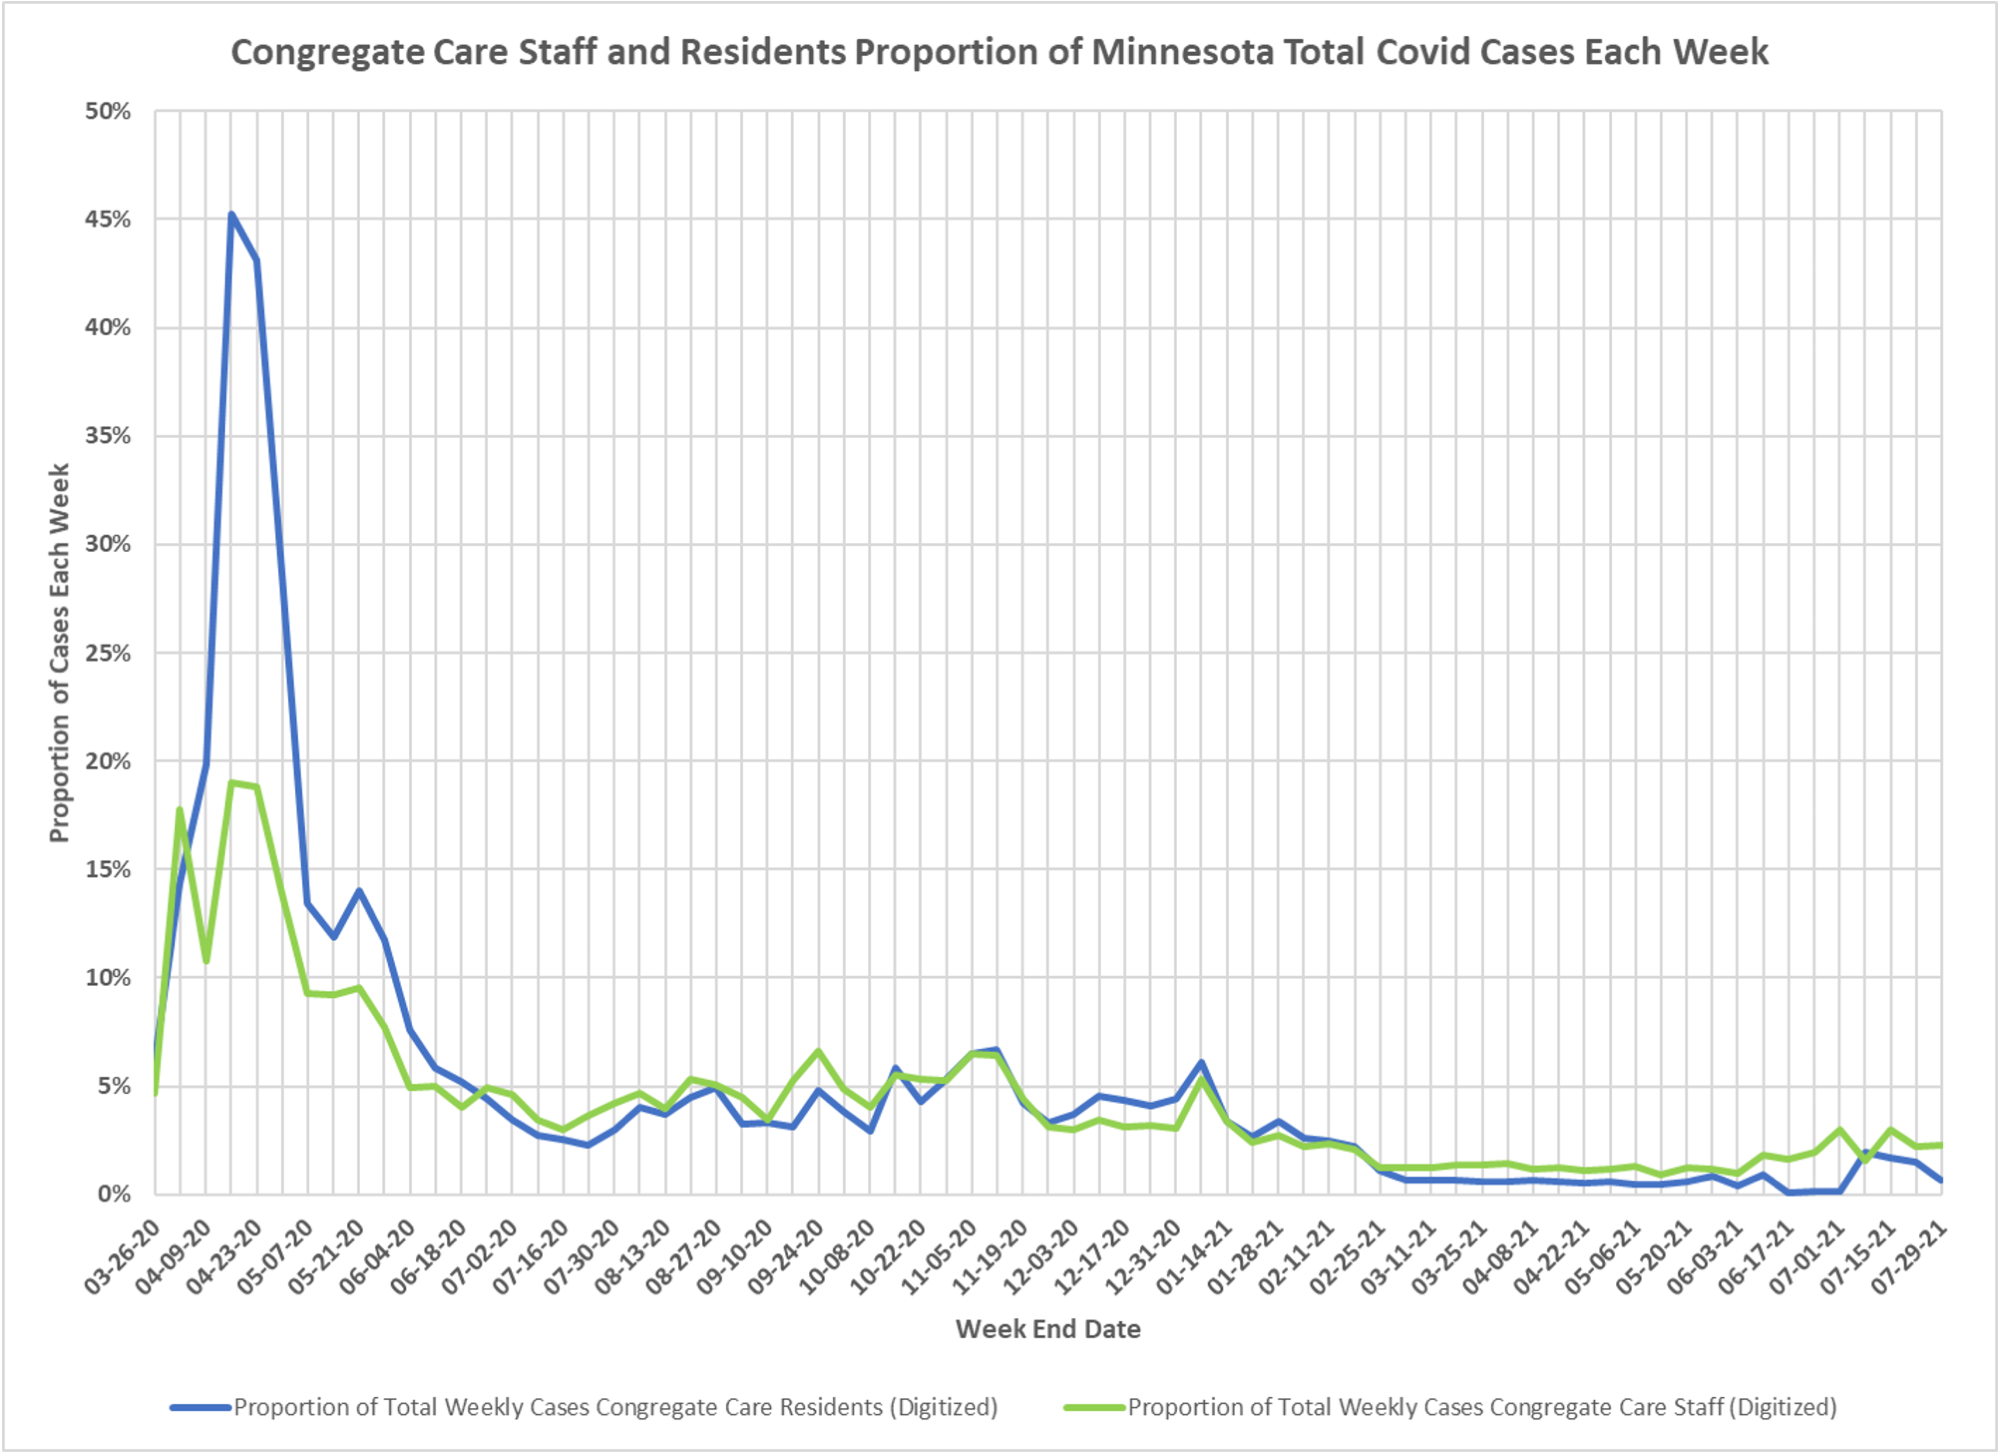
Note the volatility of the ratio of LTC and non-LTC cases. Early on with little testing, very high percent of cases, but not in reality although there is some front-loading as most vulnerable get infected most easily, then as testing ramps up, proportion falls rapidly, then a plateau, then as vaccination kicks in early this year, which this group going first, another fall, a plateau, and as both other groups are heavily vaccinated, and vaccination is less effective in this group, a slight increase in recent weeks. On the case numbers chart, you can see the fall to very low absolute numbers, with maybe a slight rise in recent weeks. Have I mentioned that the age structure, and ratio of LTC cases, would be similar in a fully unvaxed and a fully vaxed population? Trust me, it will. Thanks once more to DD.
✅ Subscribe via Email
About this Blog
Healthy Skeptic Podcast
Research
MedPAC 2019 Report to Congress
June 18, 2019
Headlines
Tags
Access
ACO
Care Management
Chronic Disease
Comparative Effectiveness
Consumer Directed Health
Consumers
Devices
Disease Management
Drugs
EHRs
Elder Care
End-of-Life Care
FDA
Financings
Genomics
Government
Health Care Costs
Health Care Quality
Health Care Reform
Health Insurance
Health Insurance Exchange
HIT
HomeCare
Hospital
Hospital Readmissions
Legislation
M&A
Malpractice
Meaningful Use
Medicaid
Medical Care
Medicare
Medicare Advantage
Mobile
Pay For Performance
Pharmaceutical
Physicians
Providers
Regulation
Repealing Reform
Telehealth
Telemedicine
Wellness and Prevention
Workplace
Related Posts
Commentary
February 1, 2023
United States Excess Deaths, Part 2
Per capita rates of deaths in the US as Dave continues his excellent analysis of…
Commentary
January 30, 2023
Excess Deaths in Minnesota, Part 7 Revisited
A revised look at excess deaths and death rates using a ten year baseline.
Commentary
January 30, 2023
Excess Deaths in the United States
A foray into excess death calculations in the entire nation.