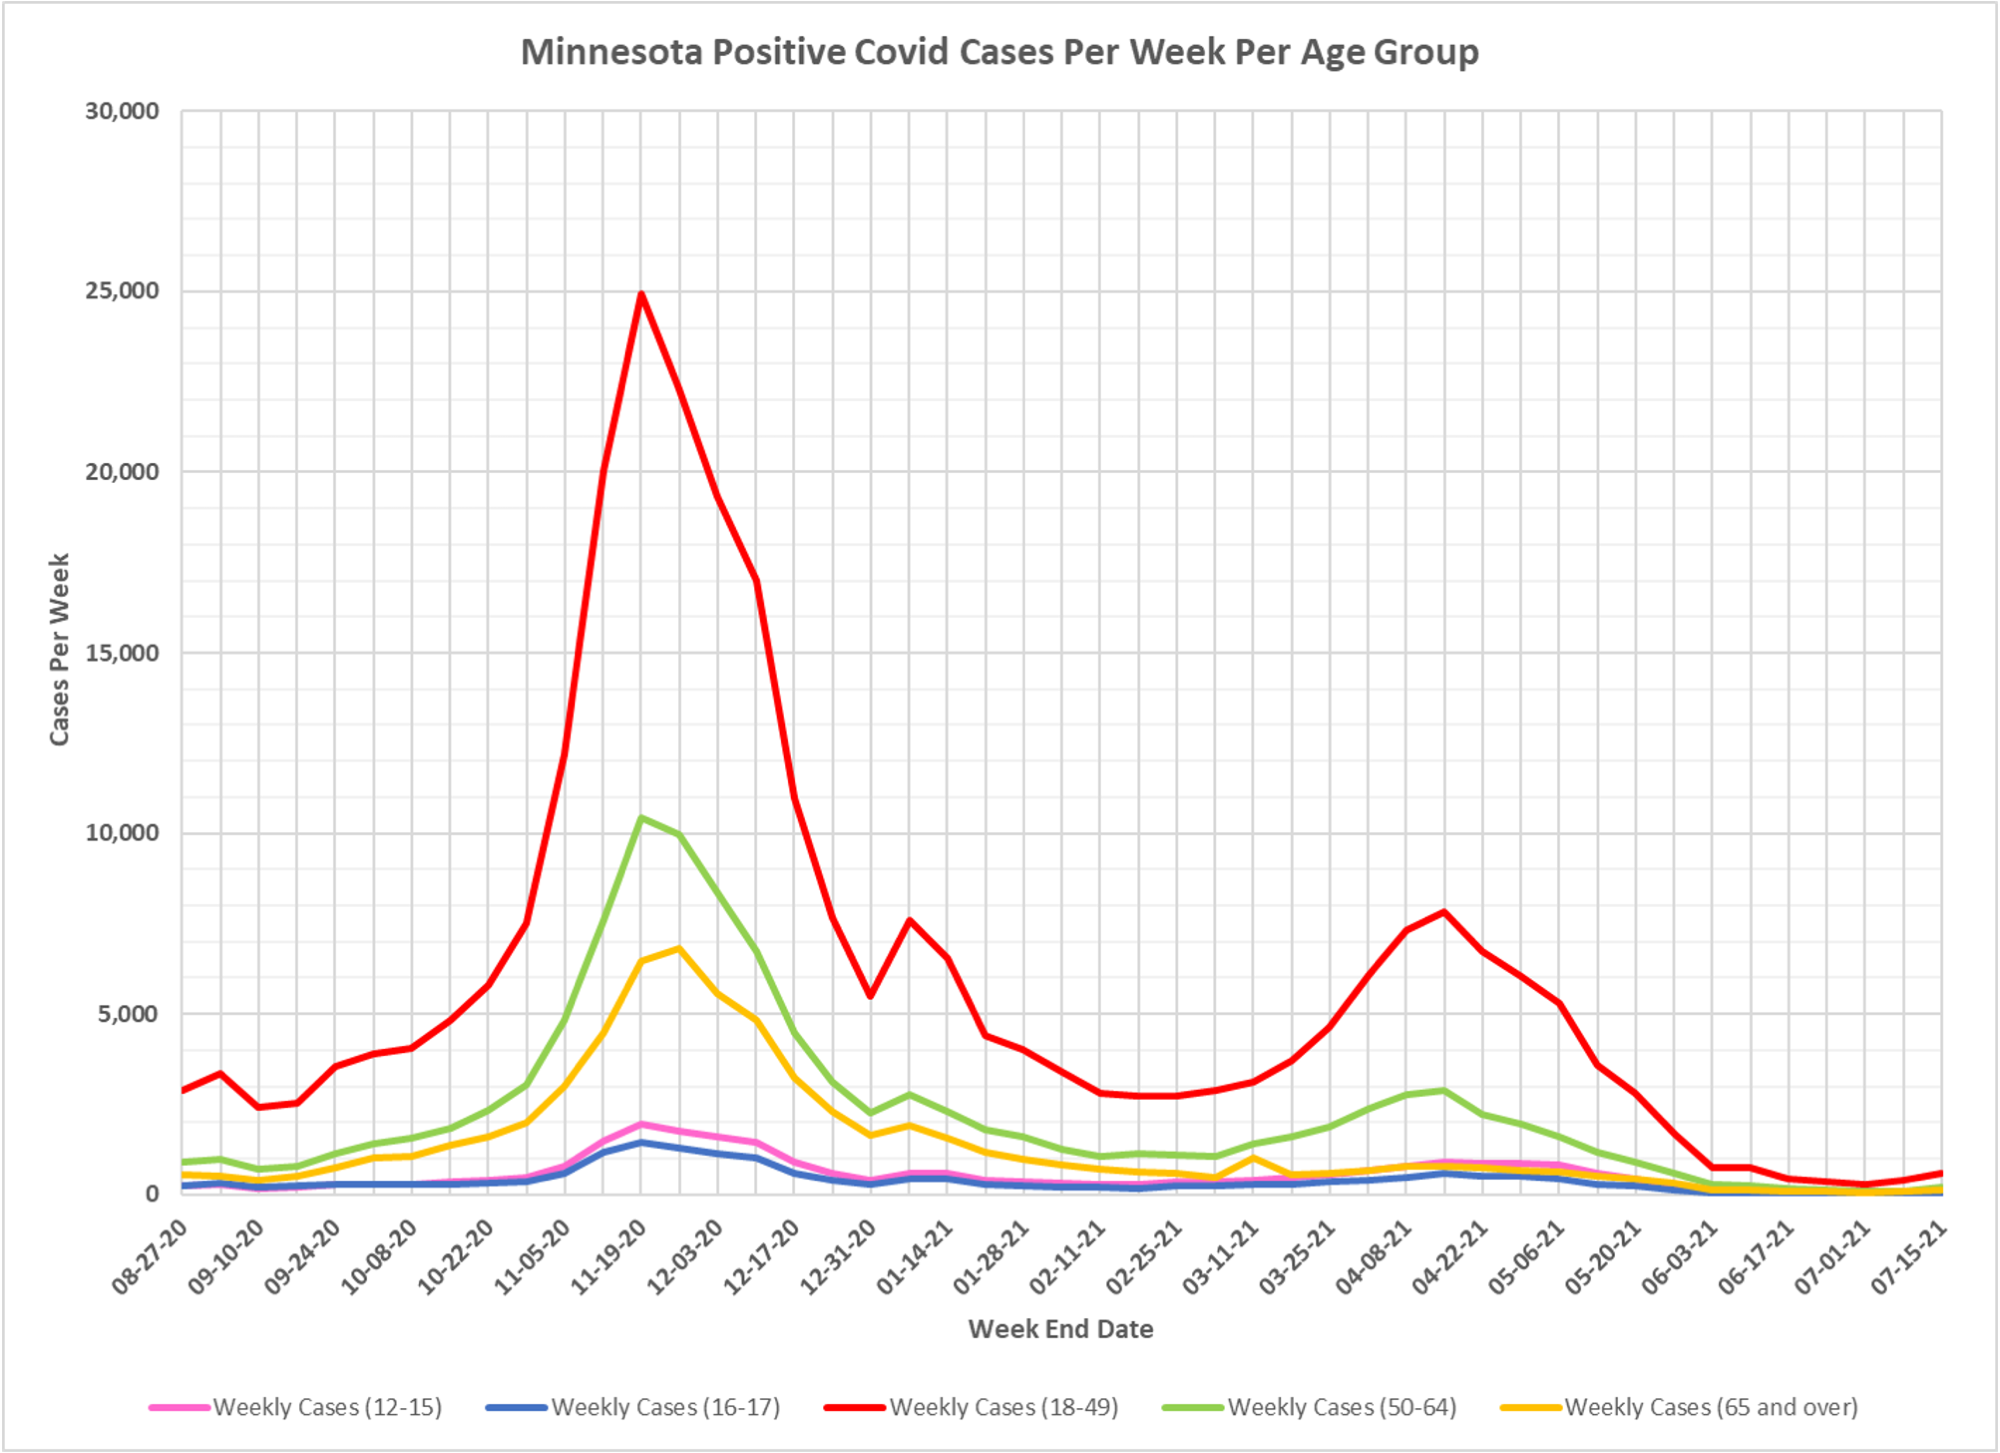
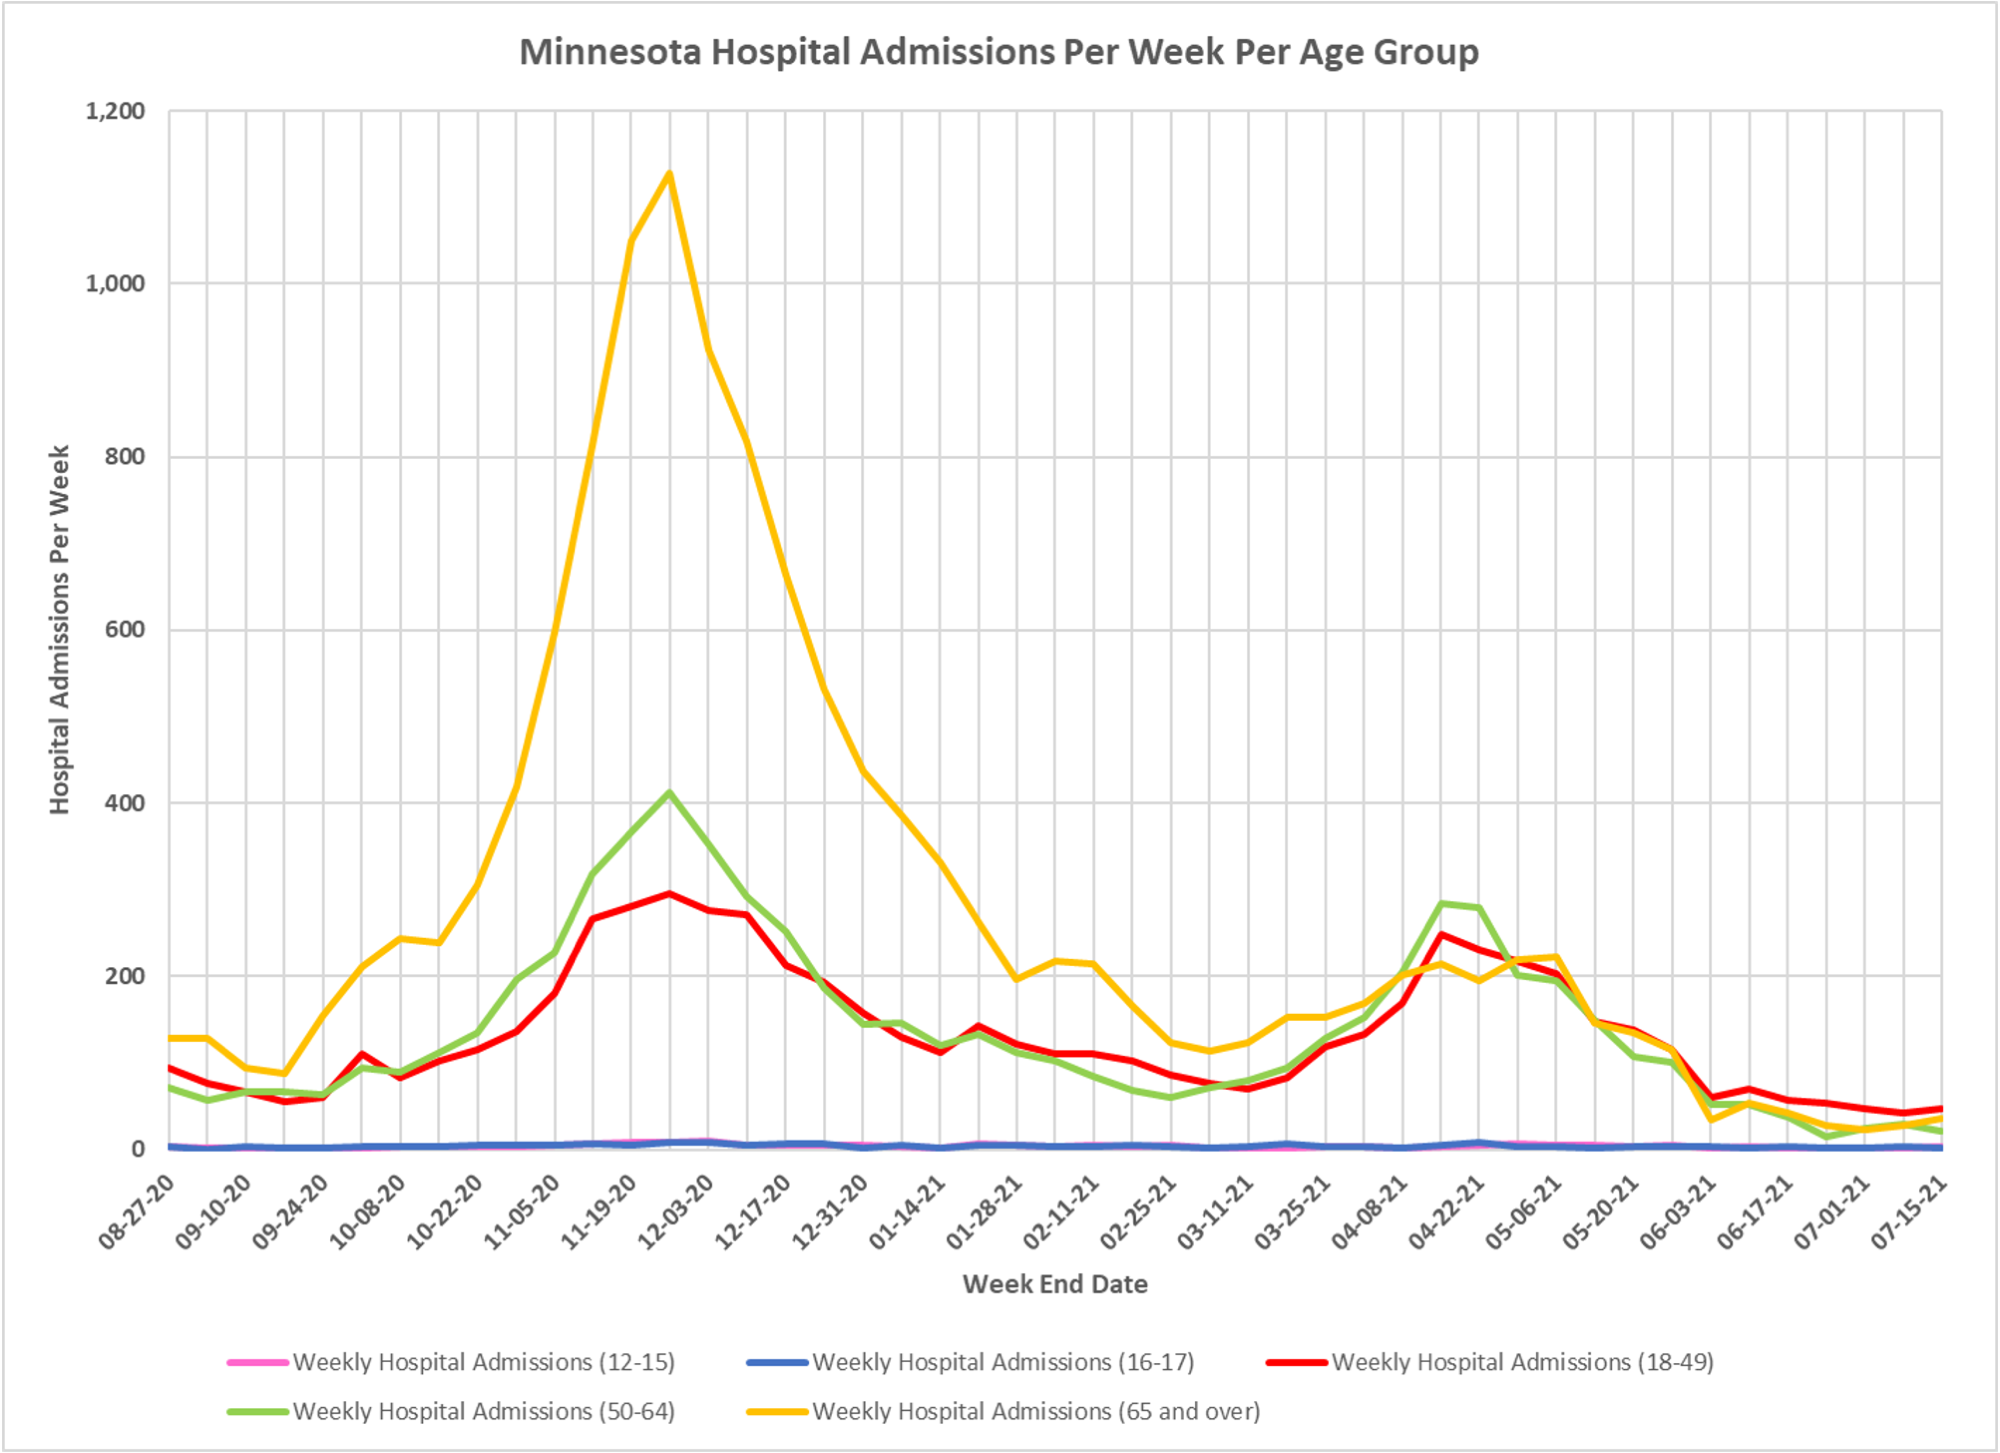
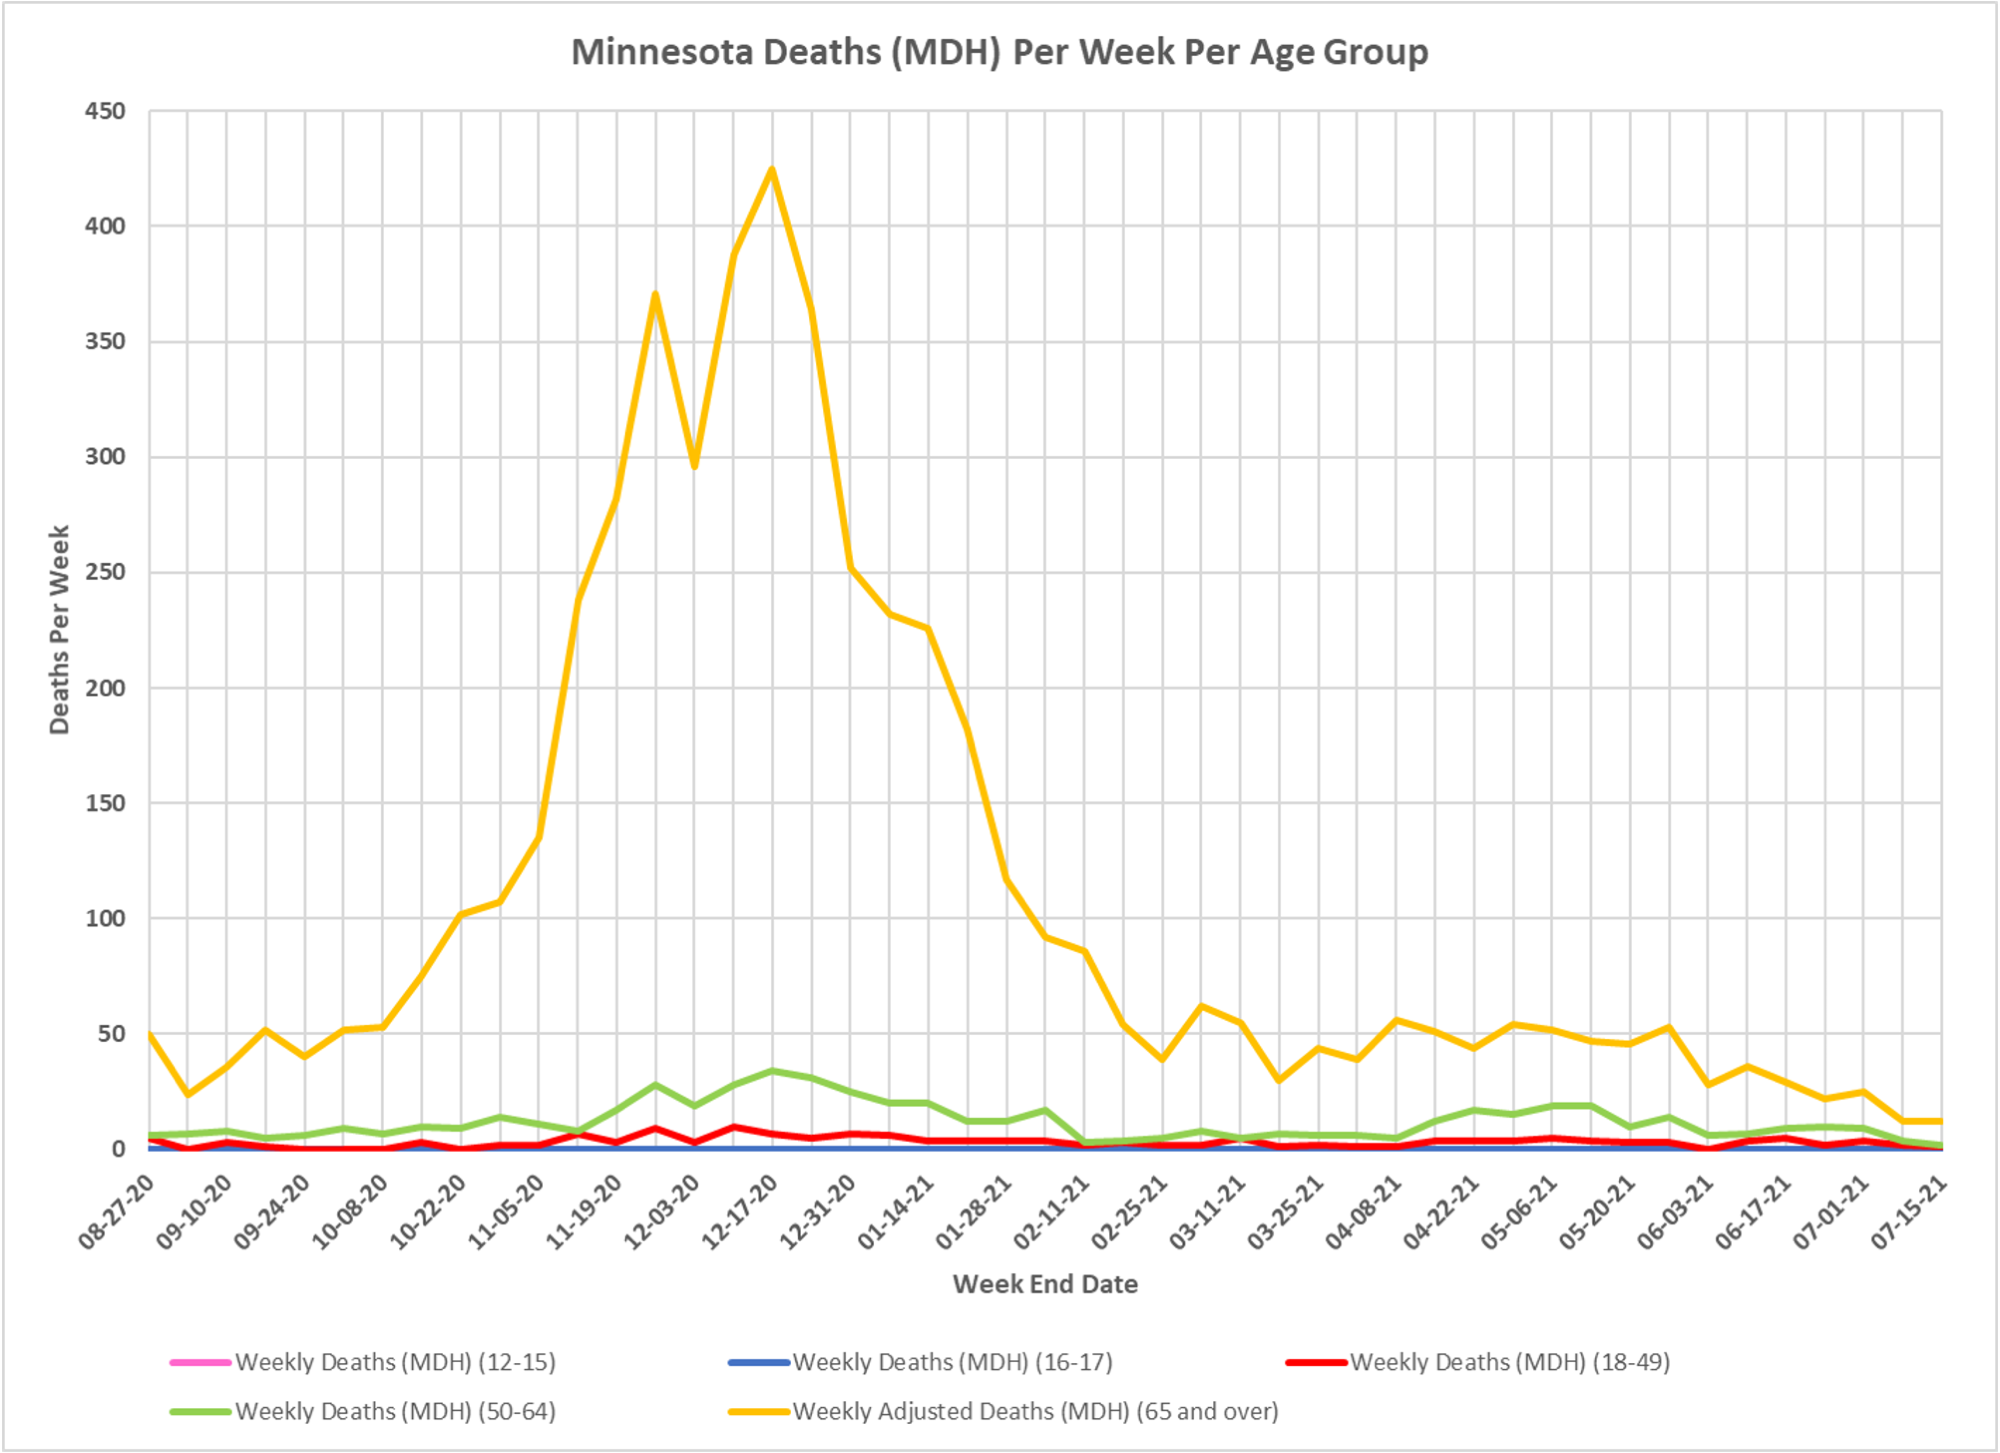
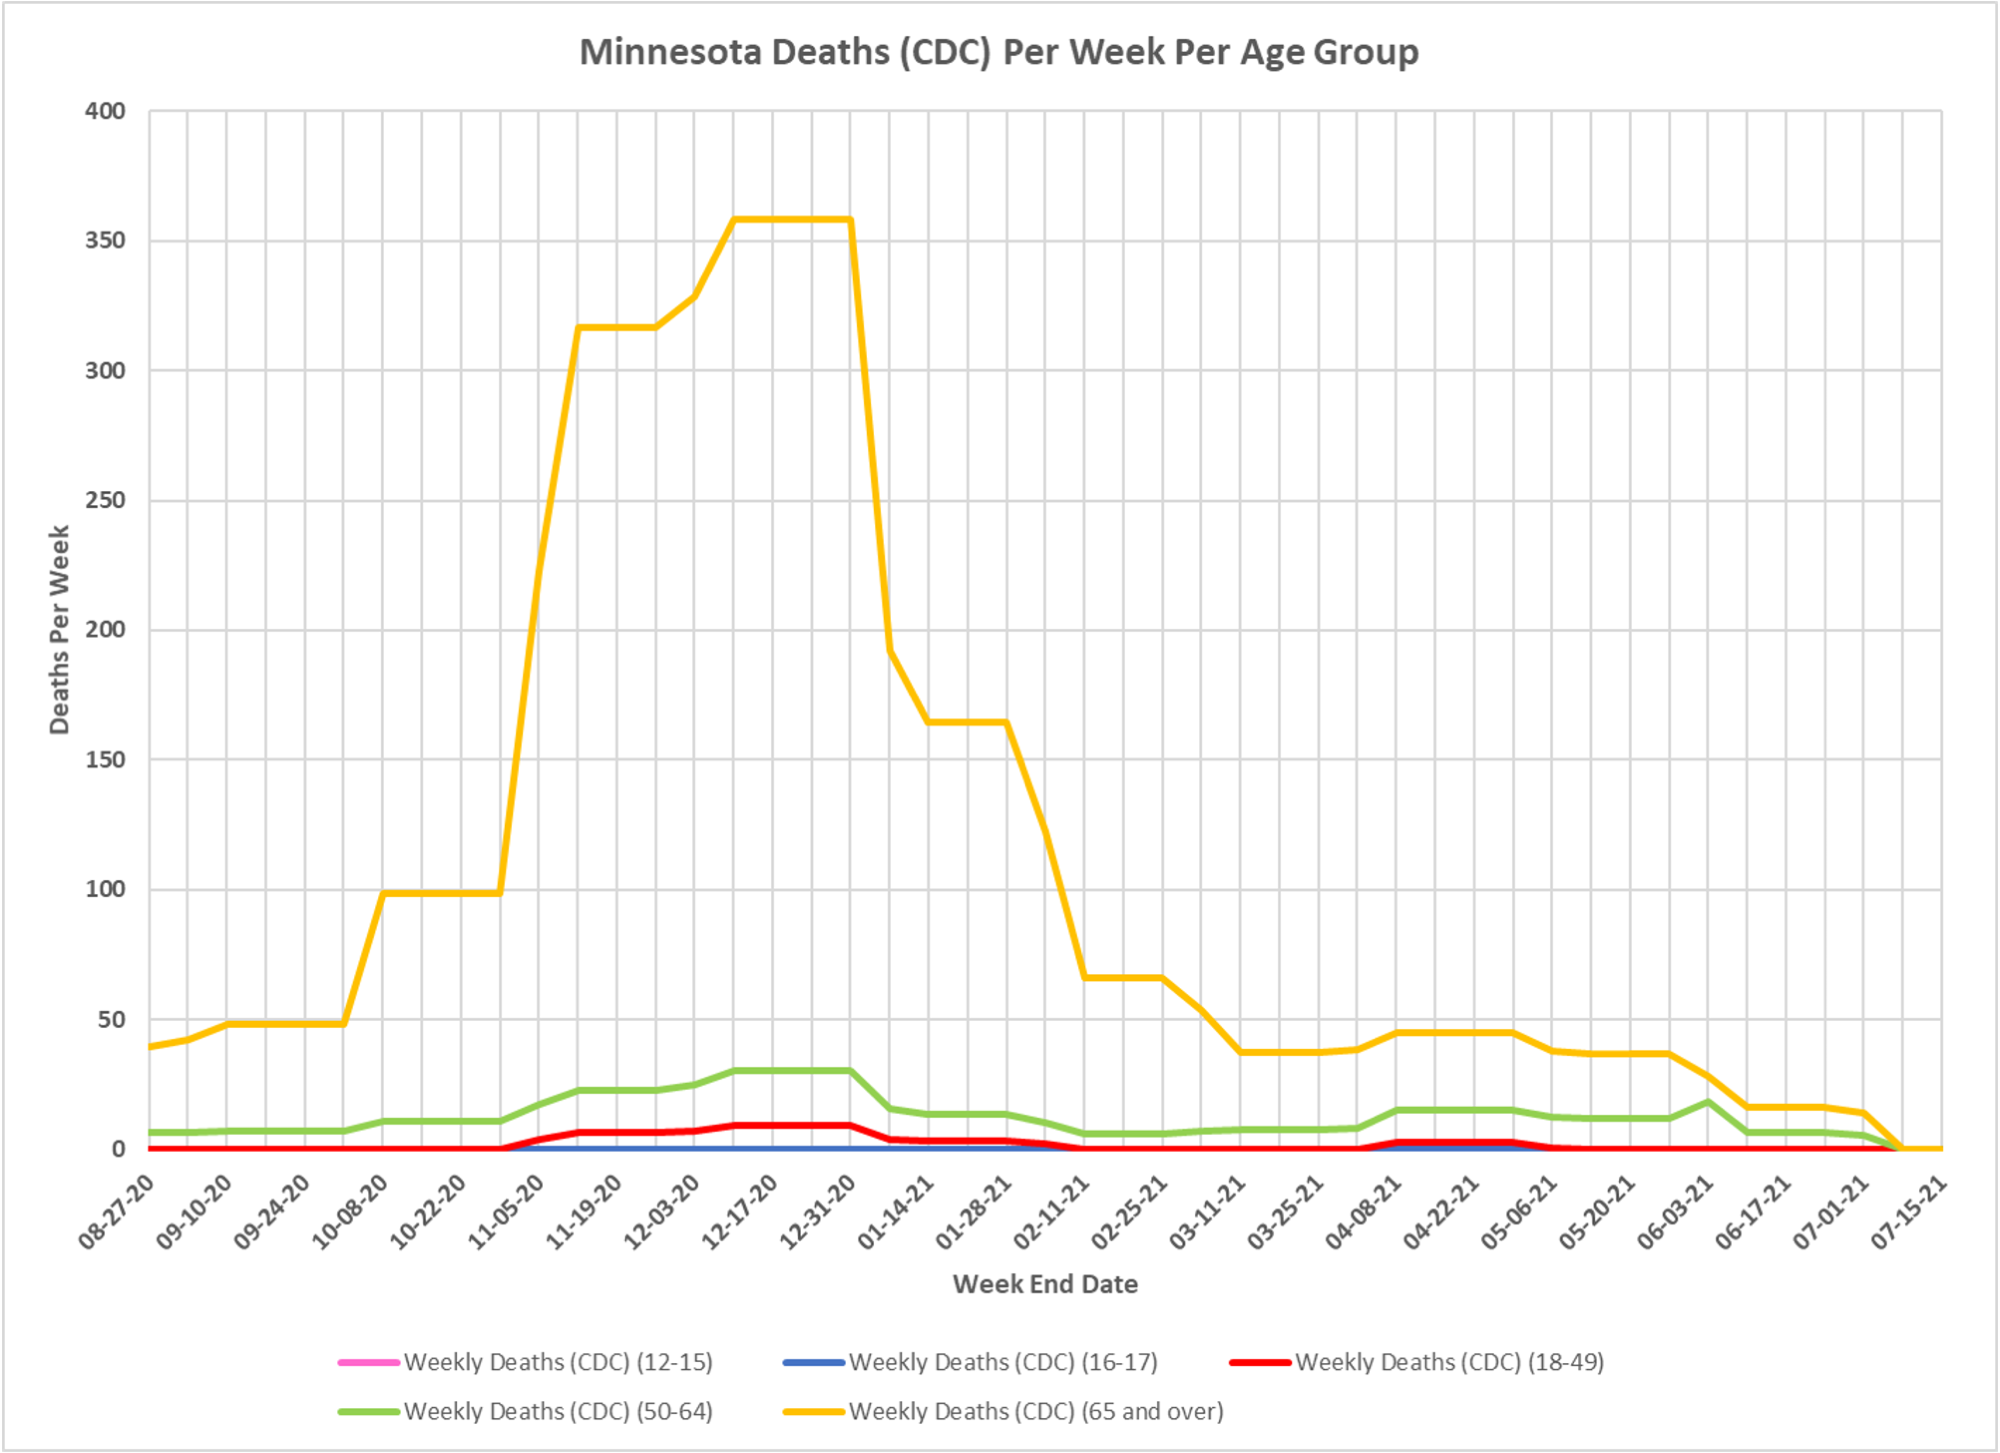
Some of these charts are repeats from other posts, but they give you a more comprehensive sense of what is happening with the hospitalization rate. This uses vaccination age groups, although Minnesota doesn’t make that easy. It does that so you can try to estimate the effect of vaccinations. In the first set of four charts, you can see no real rise in cases, the absolute number of hospitalizations is low, deaths are very low.
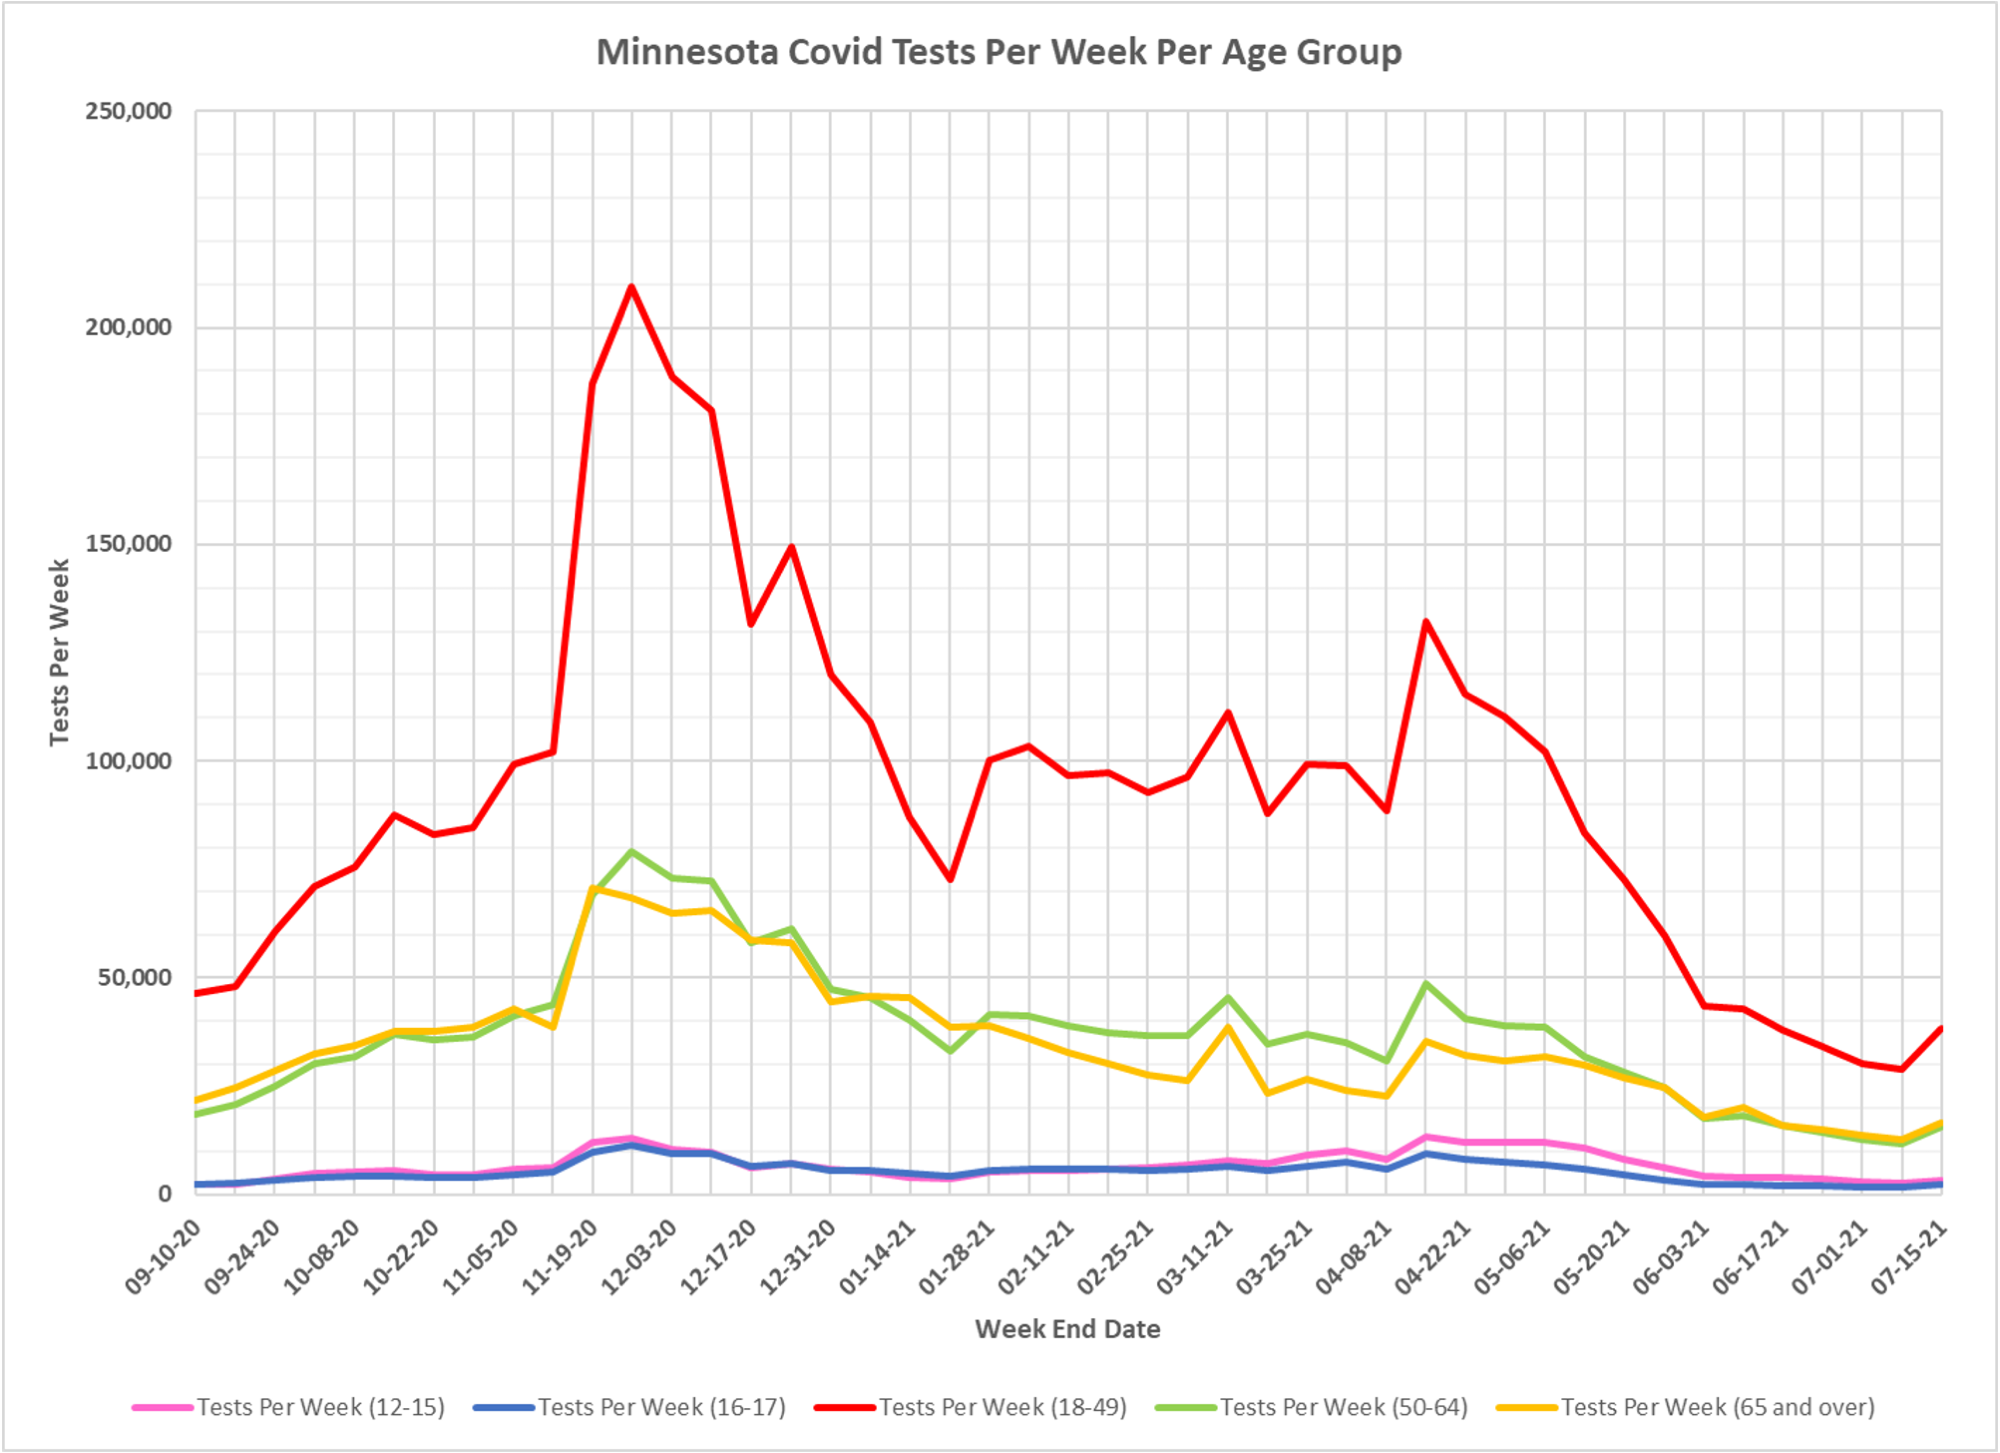
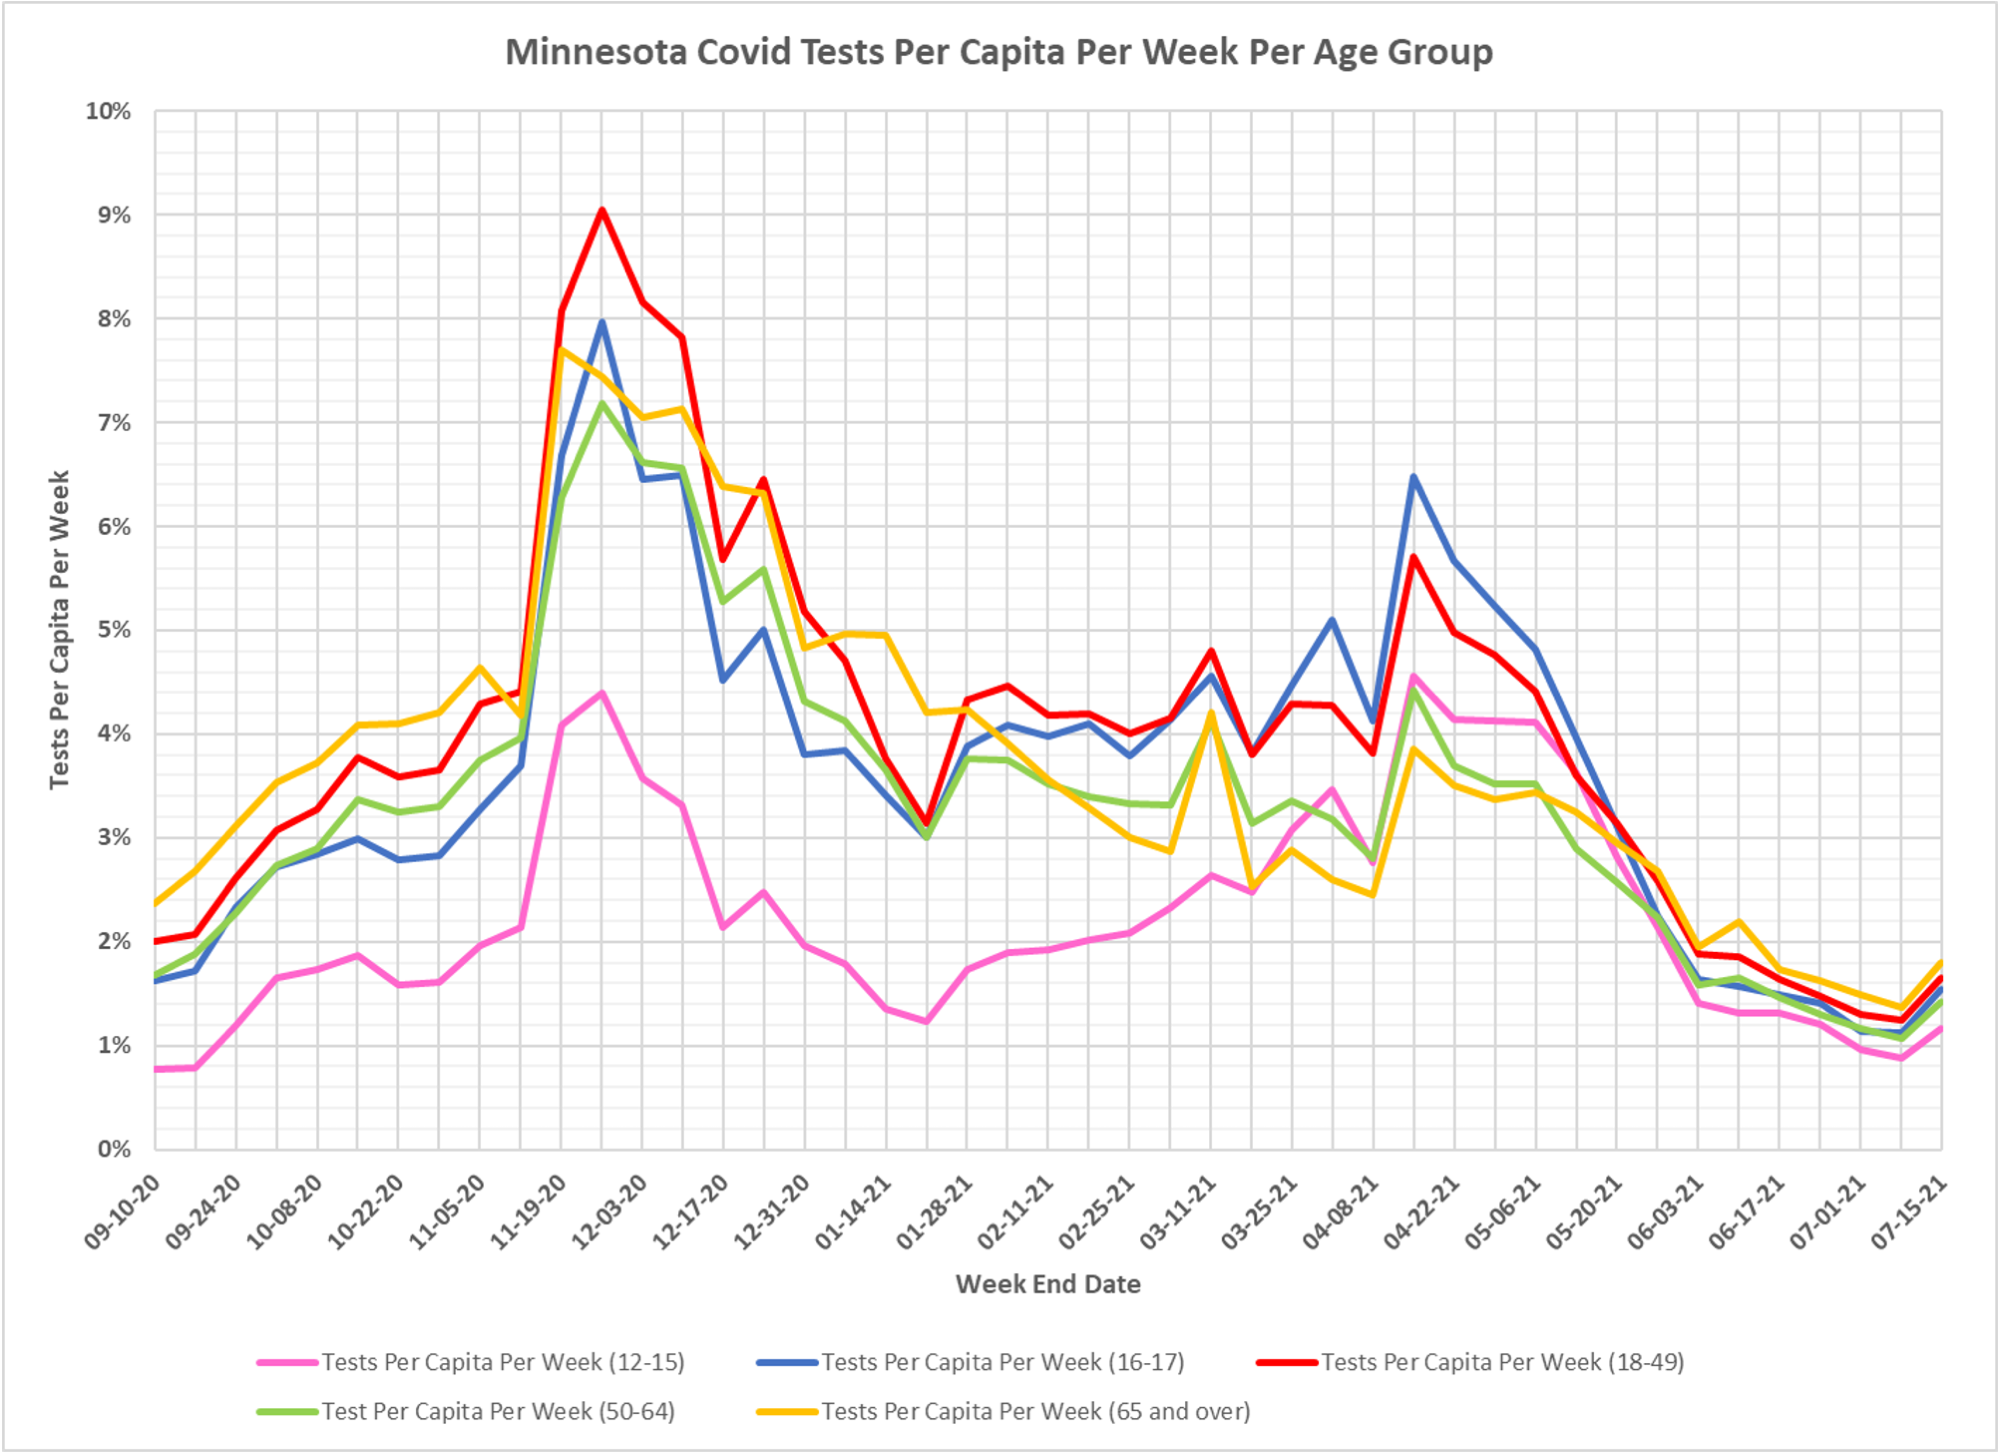
The next two show steep decline in testing with a slight uptick following July 4th.
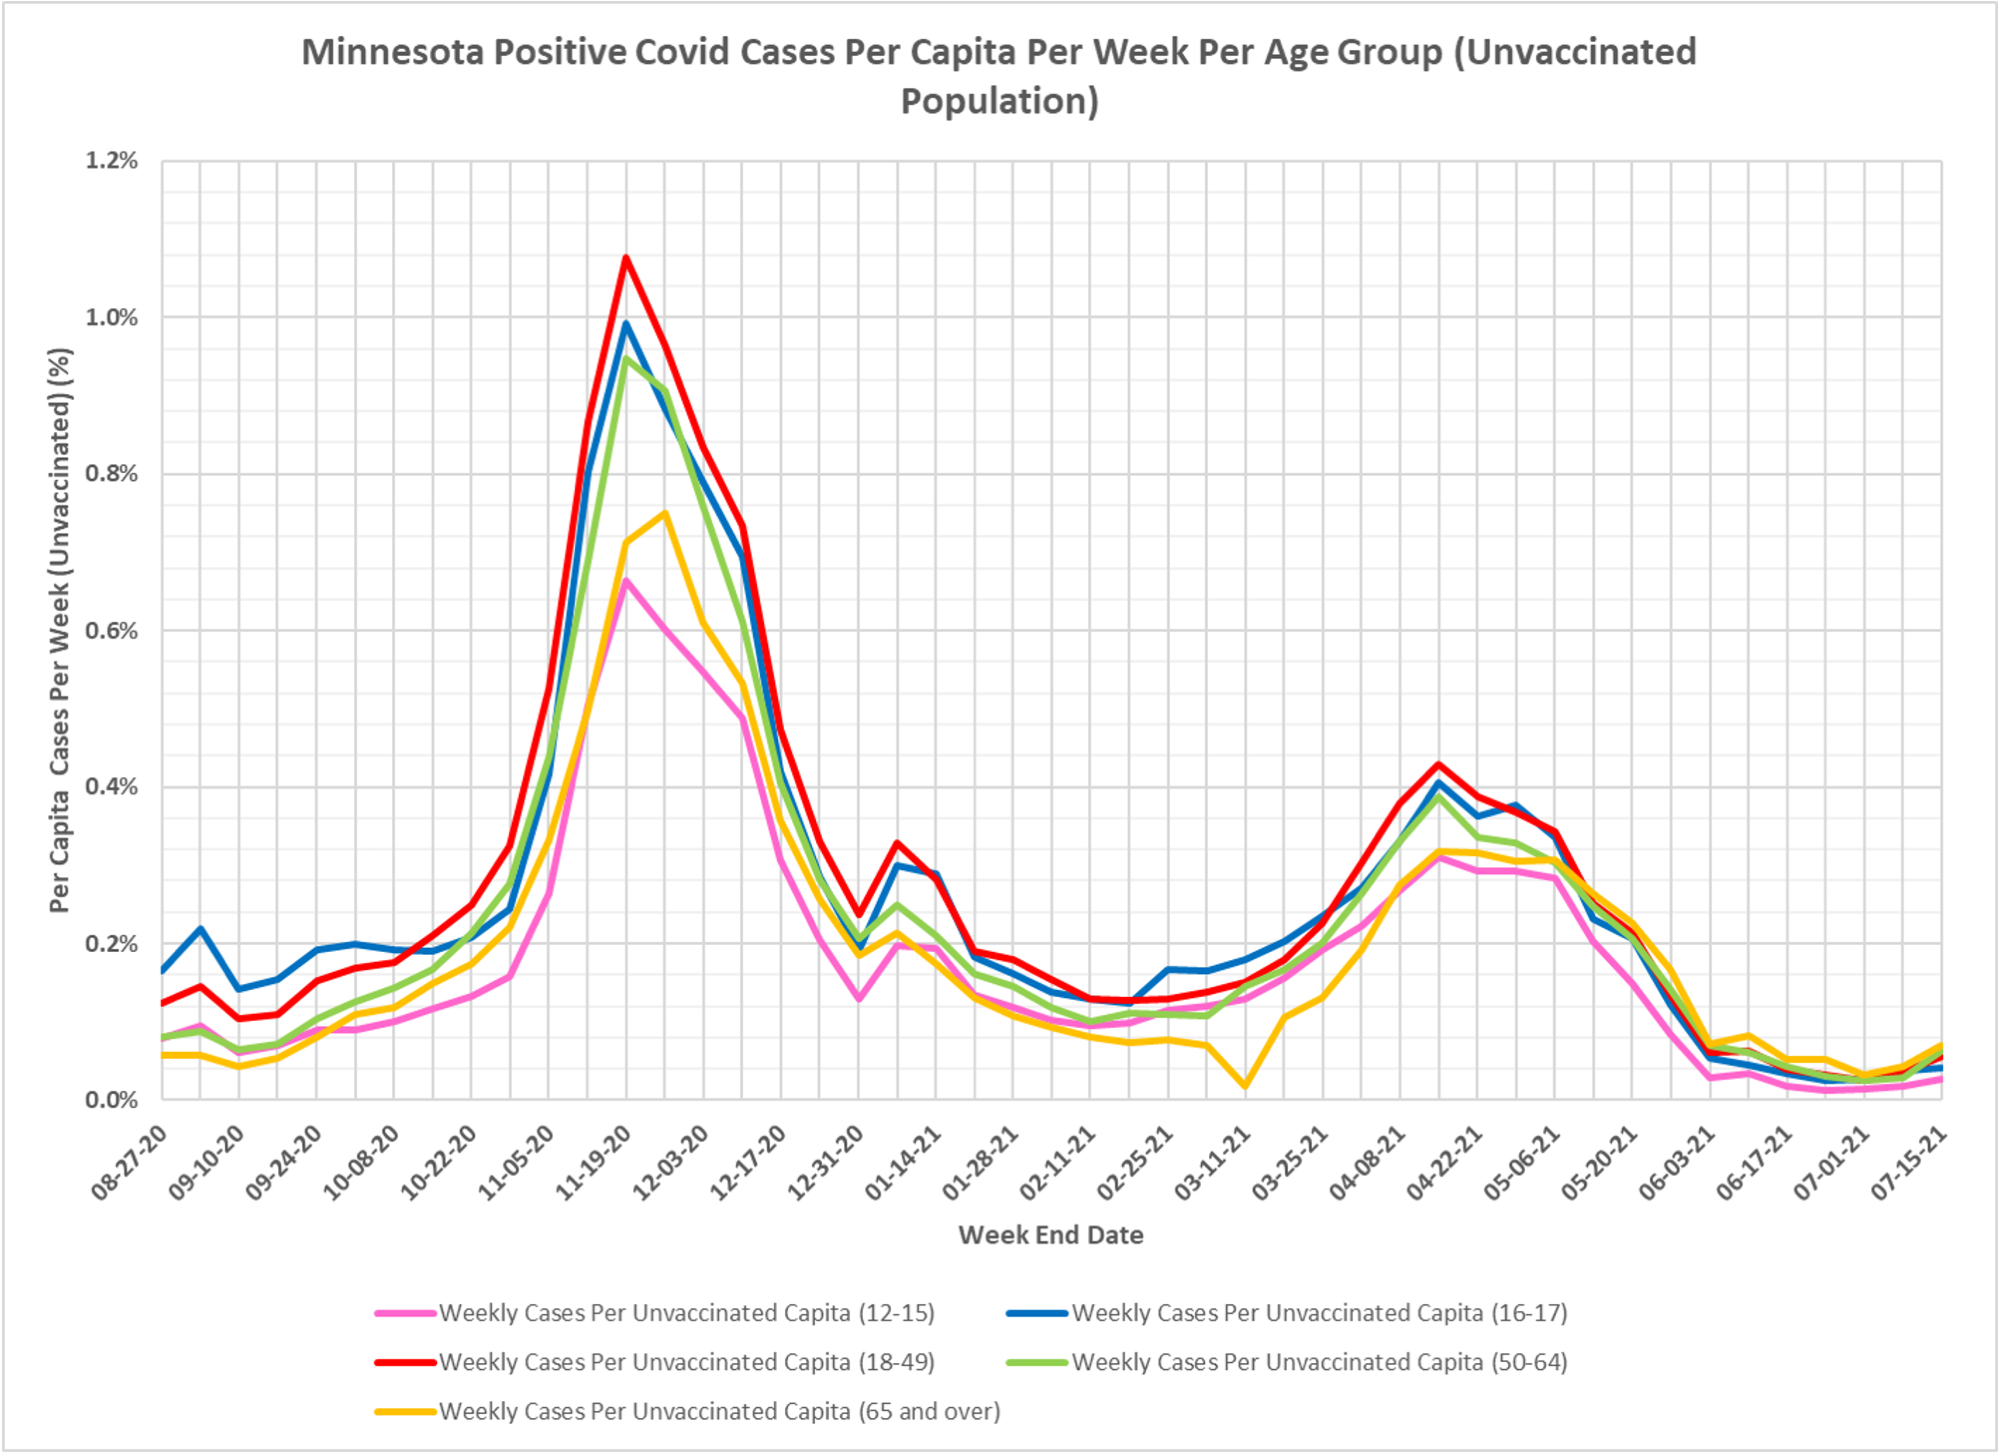
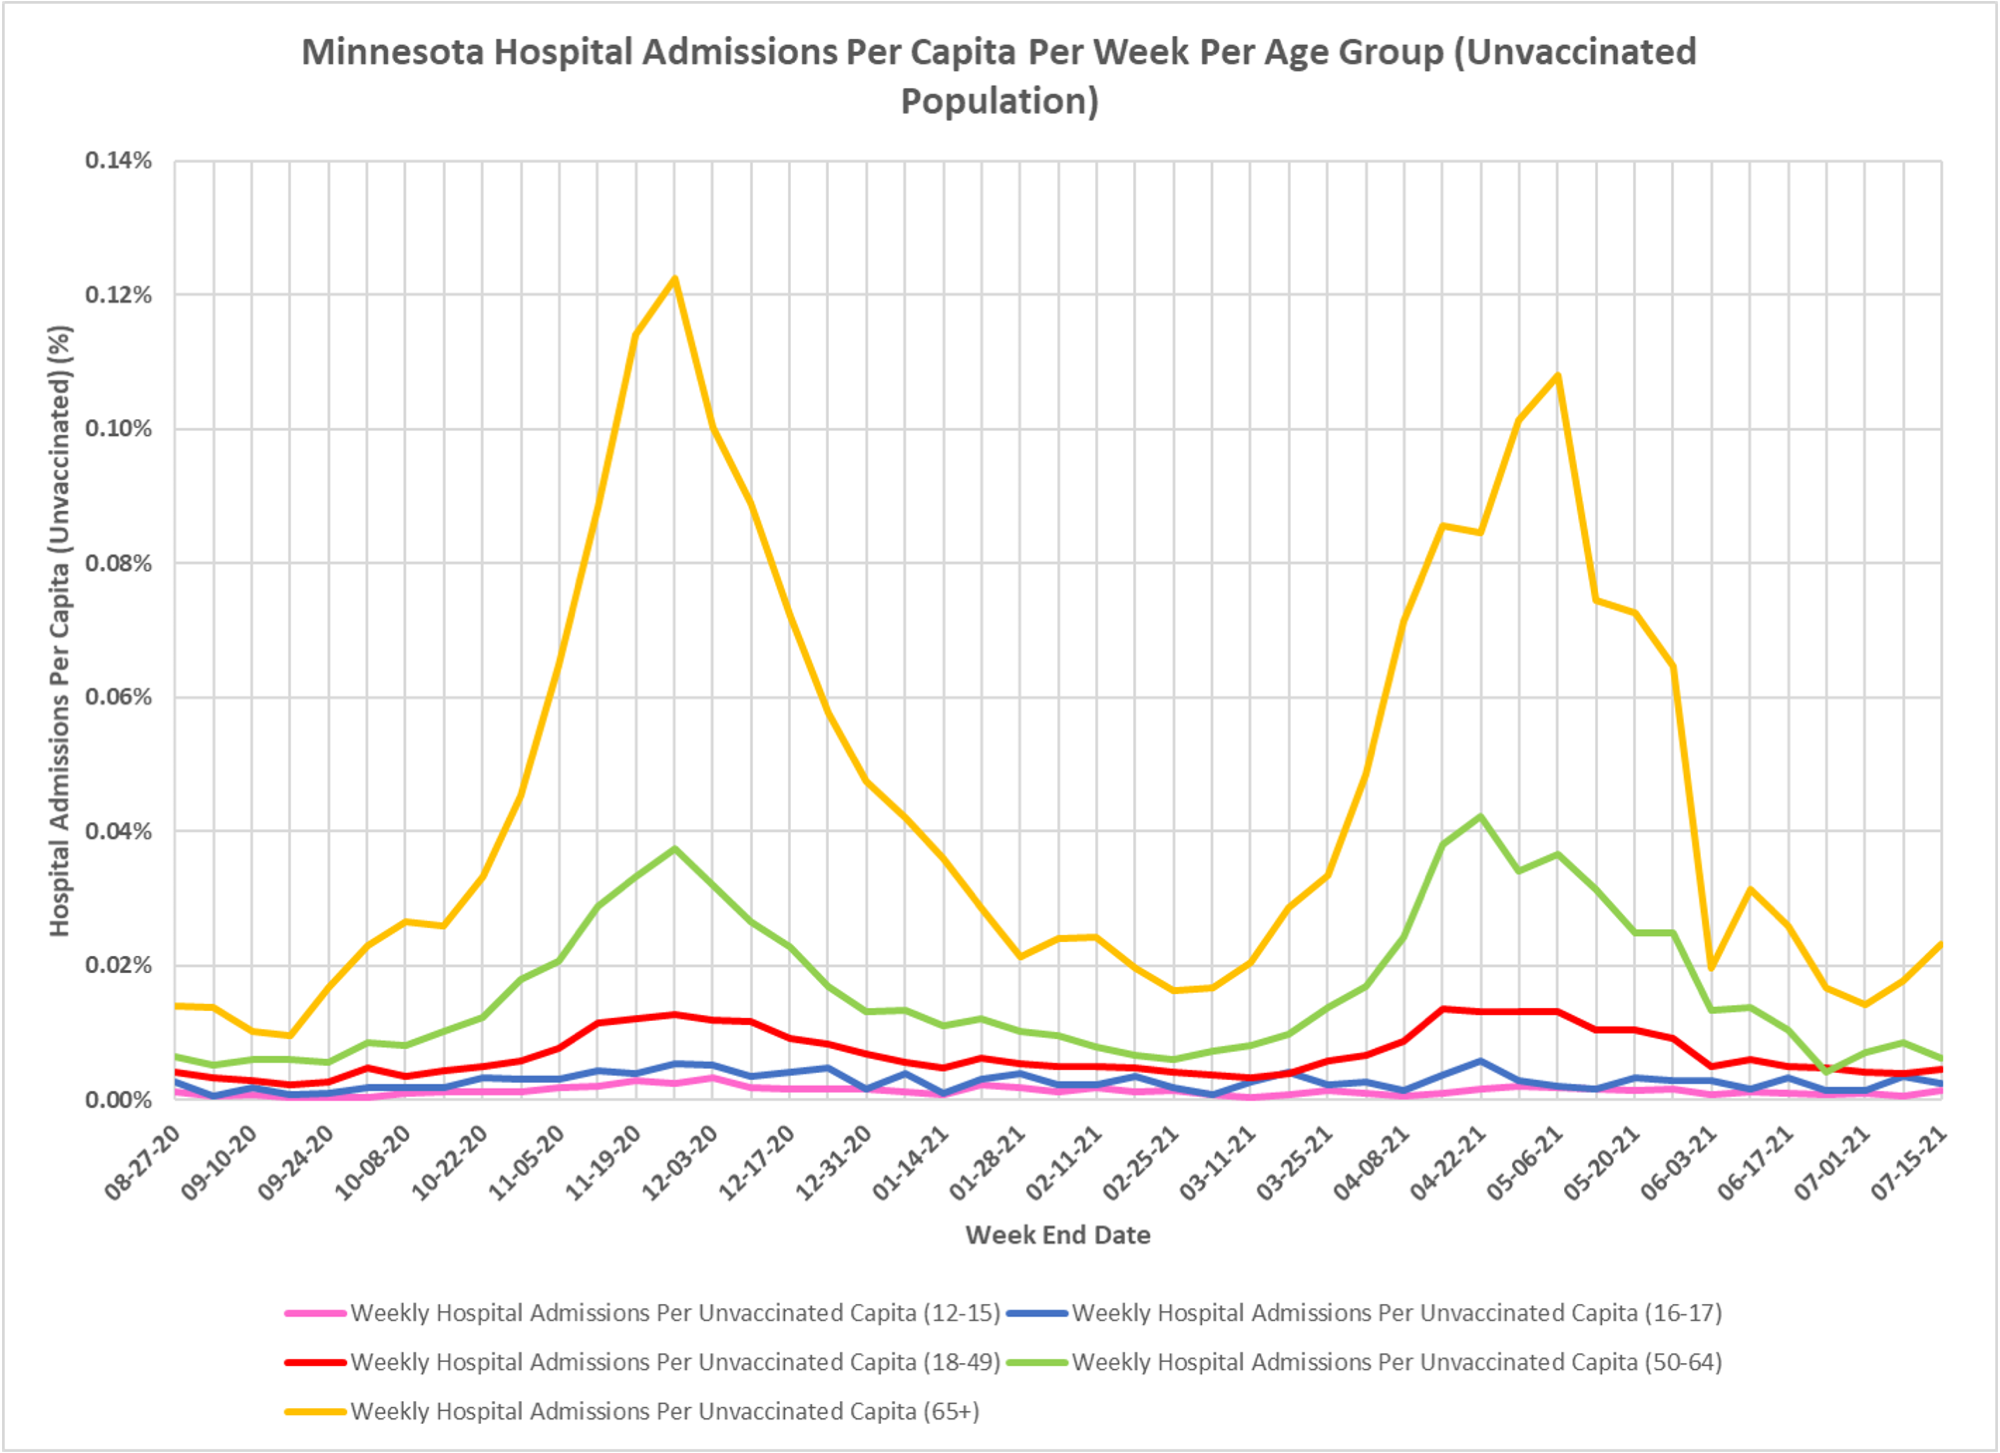
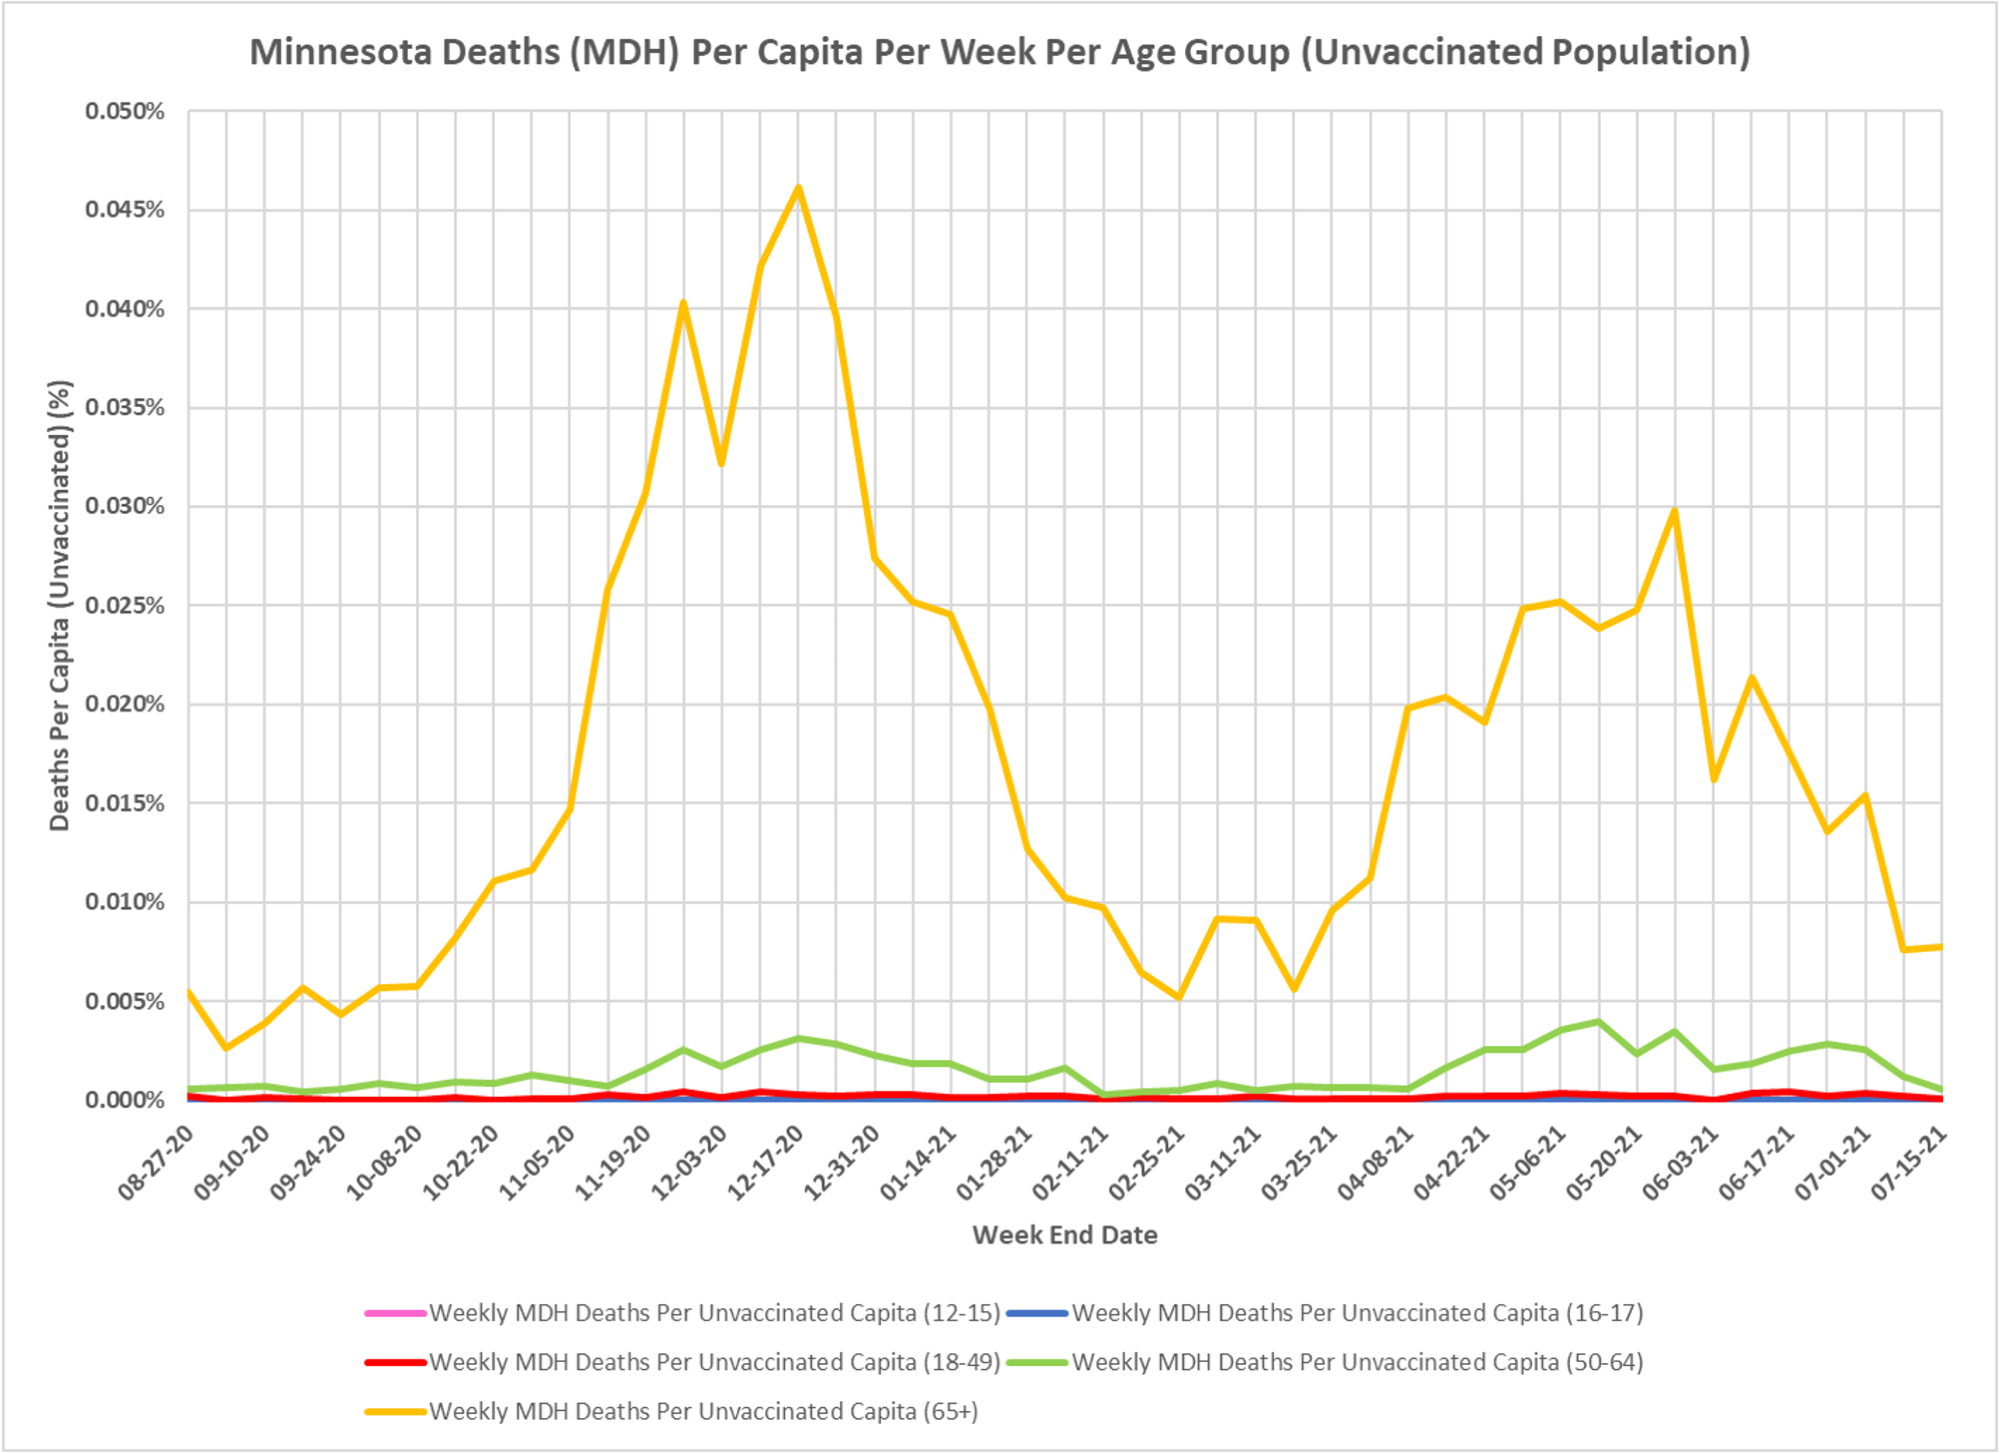
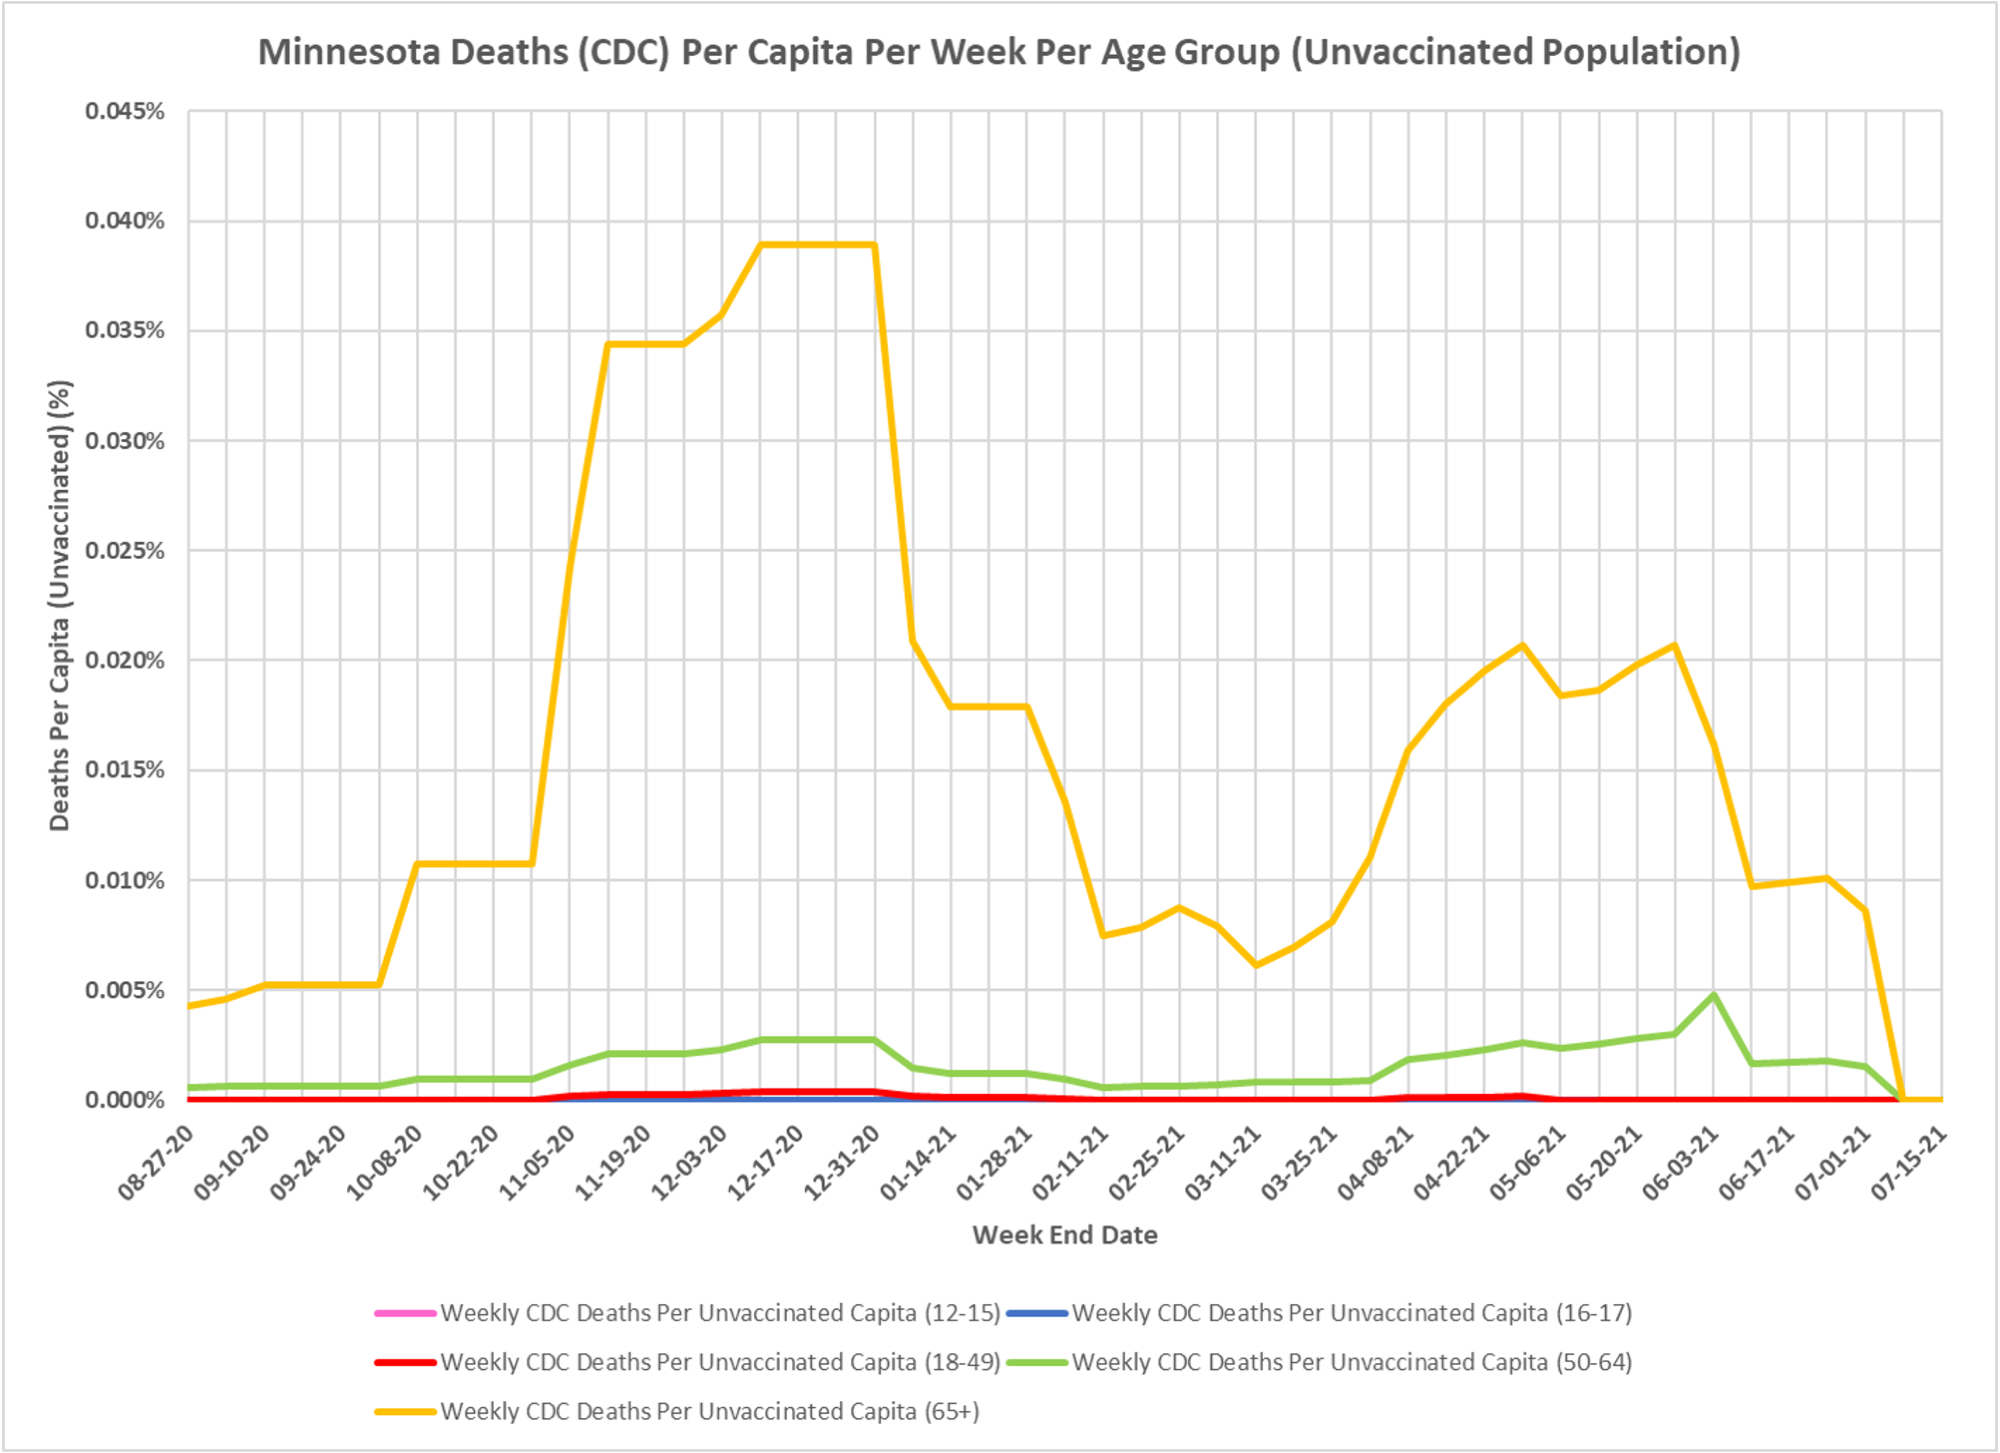
The next four are per capita or population based cases, hospitalizations and deaths in the unvaxed population. You can see the age structure stays pretty consistent and numbers are low.
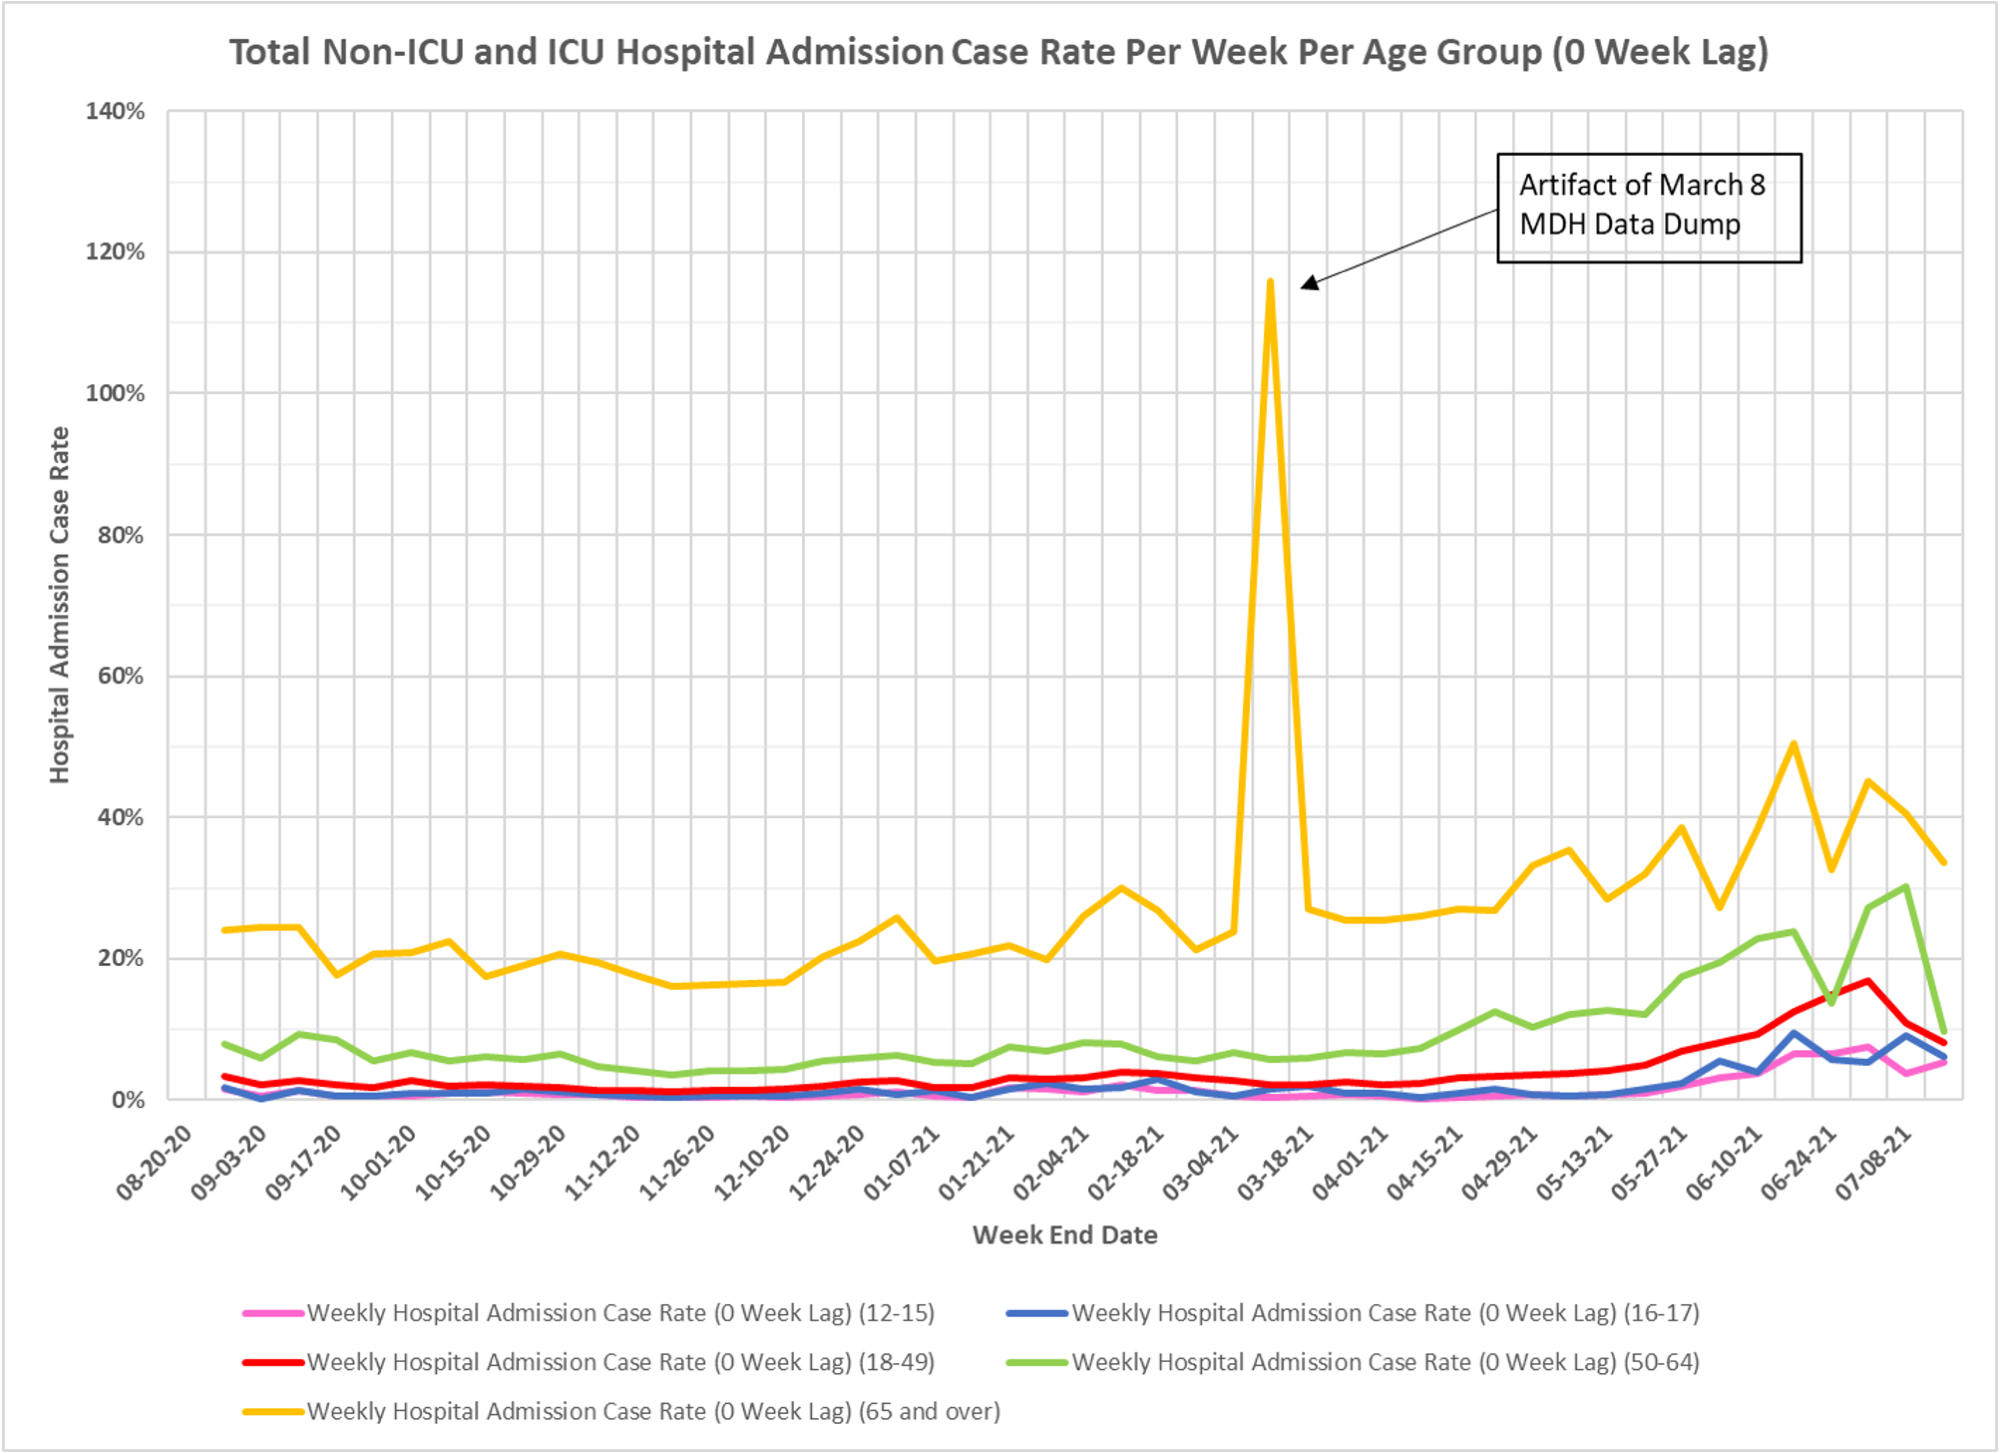
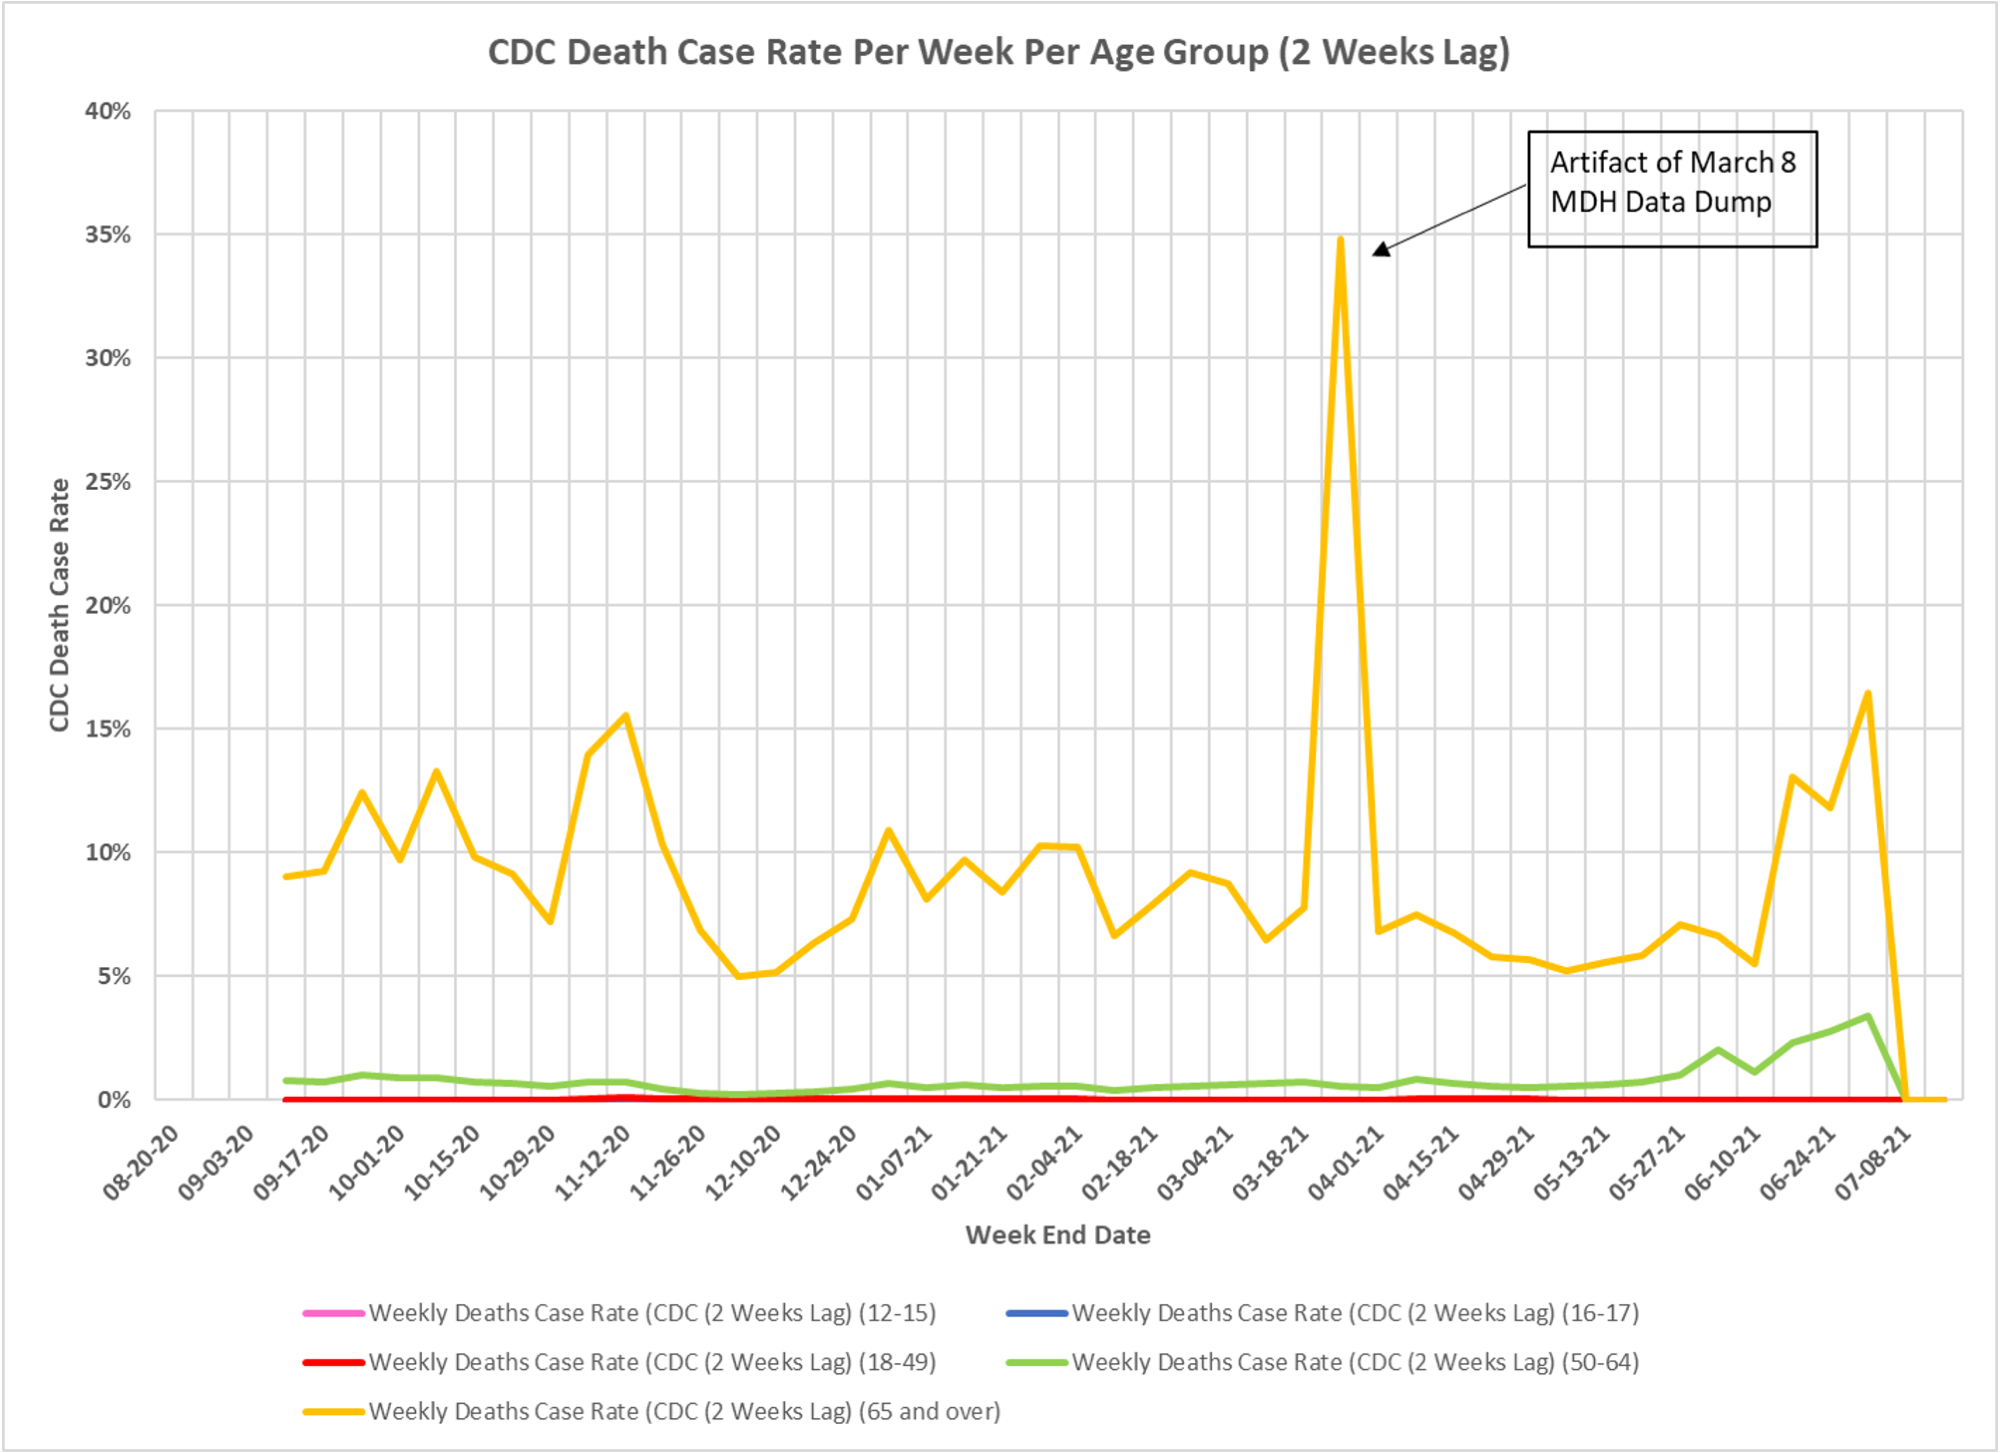
And the last two show the age structure of deaths and hospitalizations on a case rate basis. The relative proportion hasn’t really changed much.
If I put this all together, I come to the conclusion that case rates look higher because testing is down a lot, and that absolute numbers are quite low. I see no real effect of Delta on cases. Thanks again to DD.