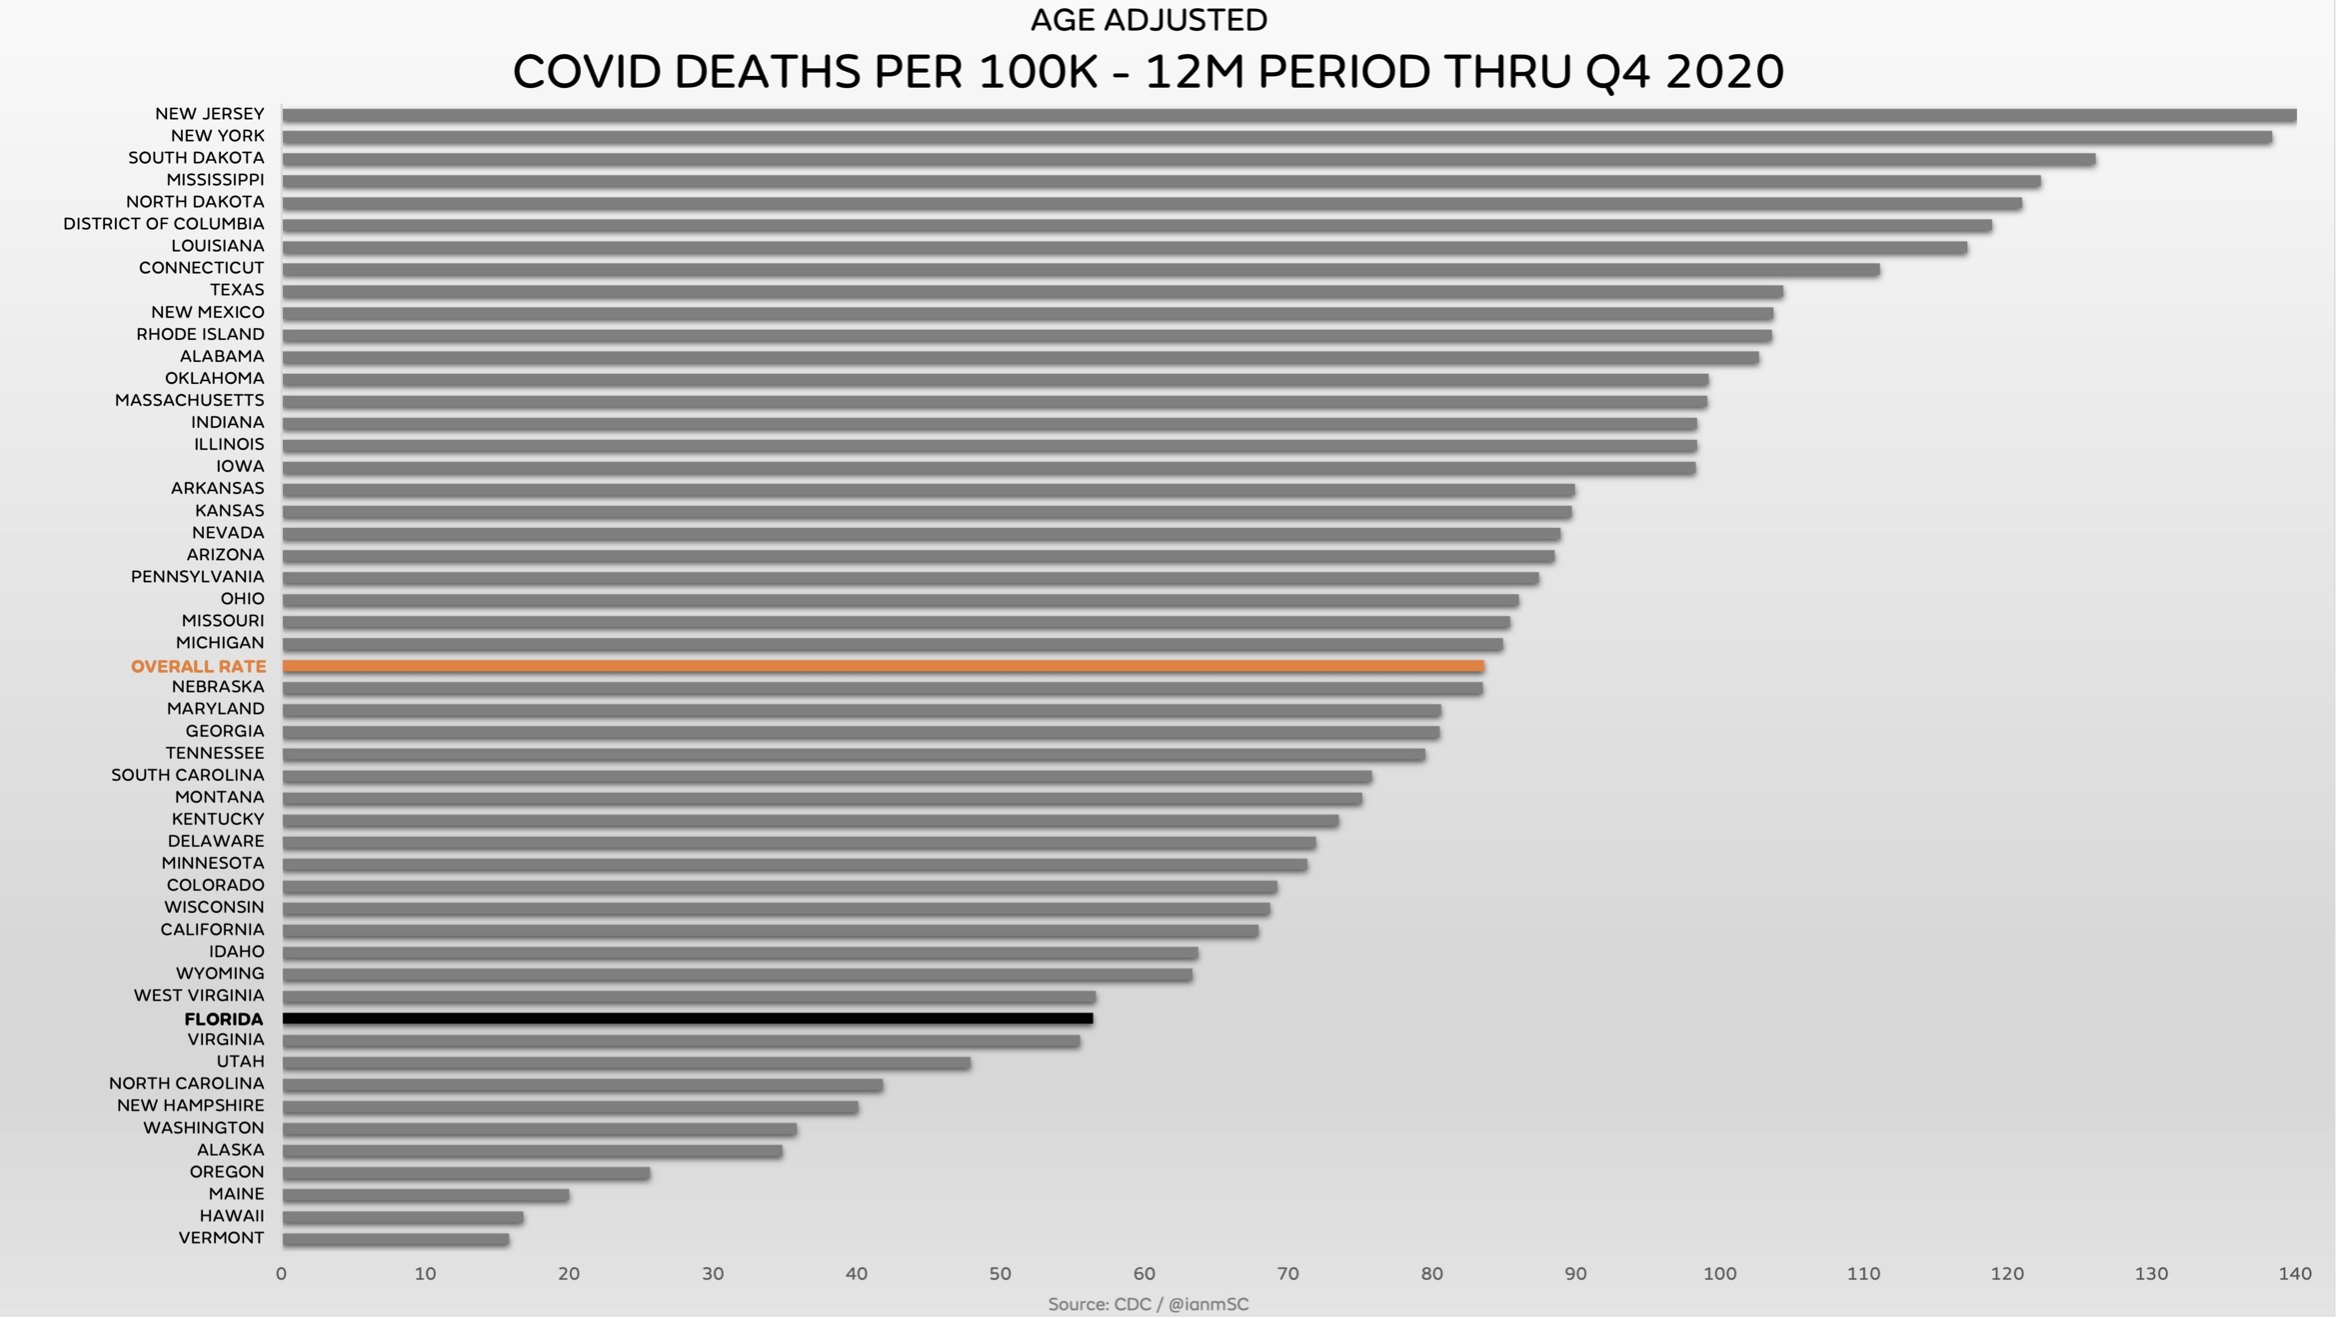
Another updated chart. Minnesota didn’t do that badly by this measure, about the same as Wisconsin with its far fewer restrictions. But look at Florida, even with a heavily minority population, on an age-adjusted basis they did very well. At the other end, for reasons that are interesting to speculate on, South Dakota, also with few restrictions, had a high rate, about the same as North Dakota, with more restrictions. And of course many of the high death rate states, like NY and NJ, had some of the greatest restriction regimes in the country. The scatter suggests that restrictions have little to do with the death rates and other factors have more of a causative relationship. The Dakotas are very dry, although sparsely populated, so the virus may have just persisted and traveled with more ease in those conditions. Still a mystery. Thanks to ianmsc on Twitter.

This is meaningless info without a consistent definition of a ‘Covid Death’ and accurate accounting of the data !! Want to bet Florida’s death certs are completed and accounted for differently than the Dakotas? For a guy who seems to be data driven, this is getting old !! There can be no statements made, inferences to patterns referenced, or conclusions drawn from any of this garbage.
As a lawyer with presumed inside access to the court systems, what legal proceedings are in process to have the state of MN turn over all of the death certs via the FoIA for an independent audit? Is there any effort going on to expose the fraud … or is it just easier to create graphs of crap?
Sorry if I sound frustrate … I solve large scale manufacturing process improvement challenges from data. I’d be laughed out of the room if I presented something like this.