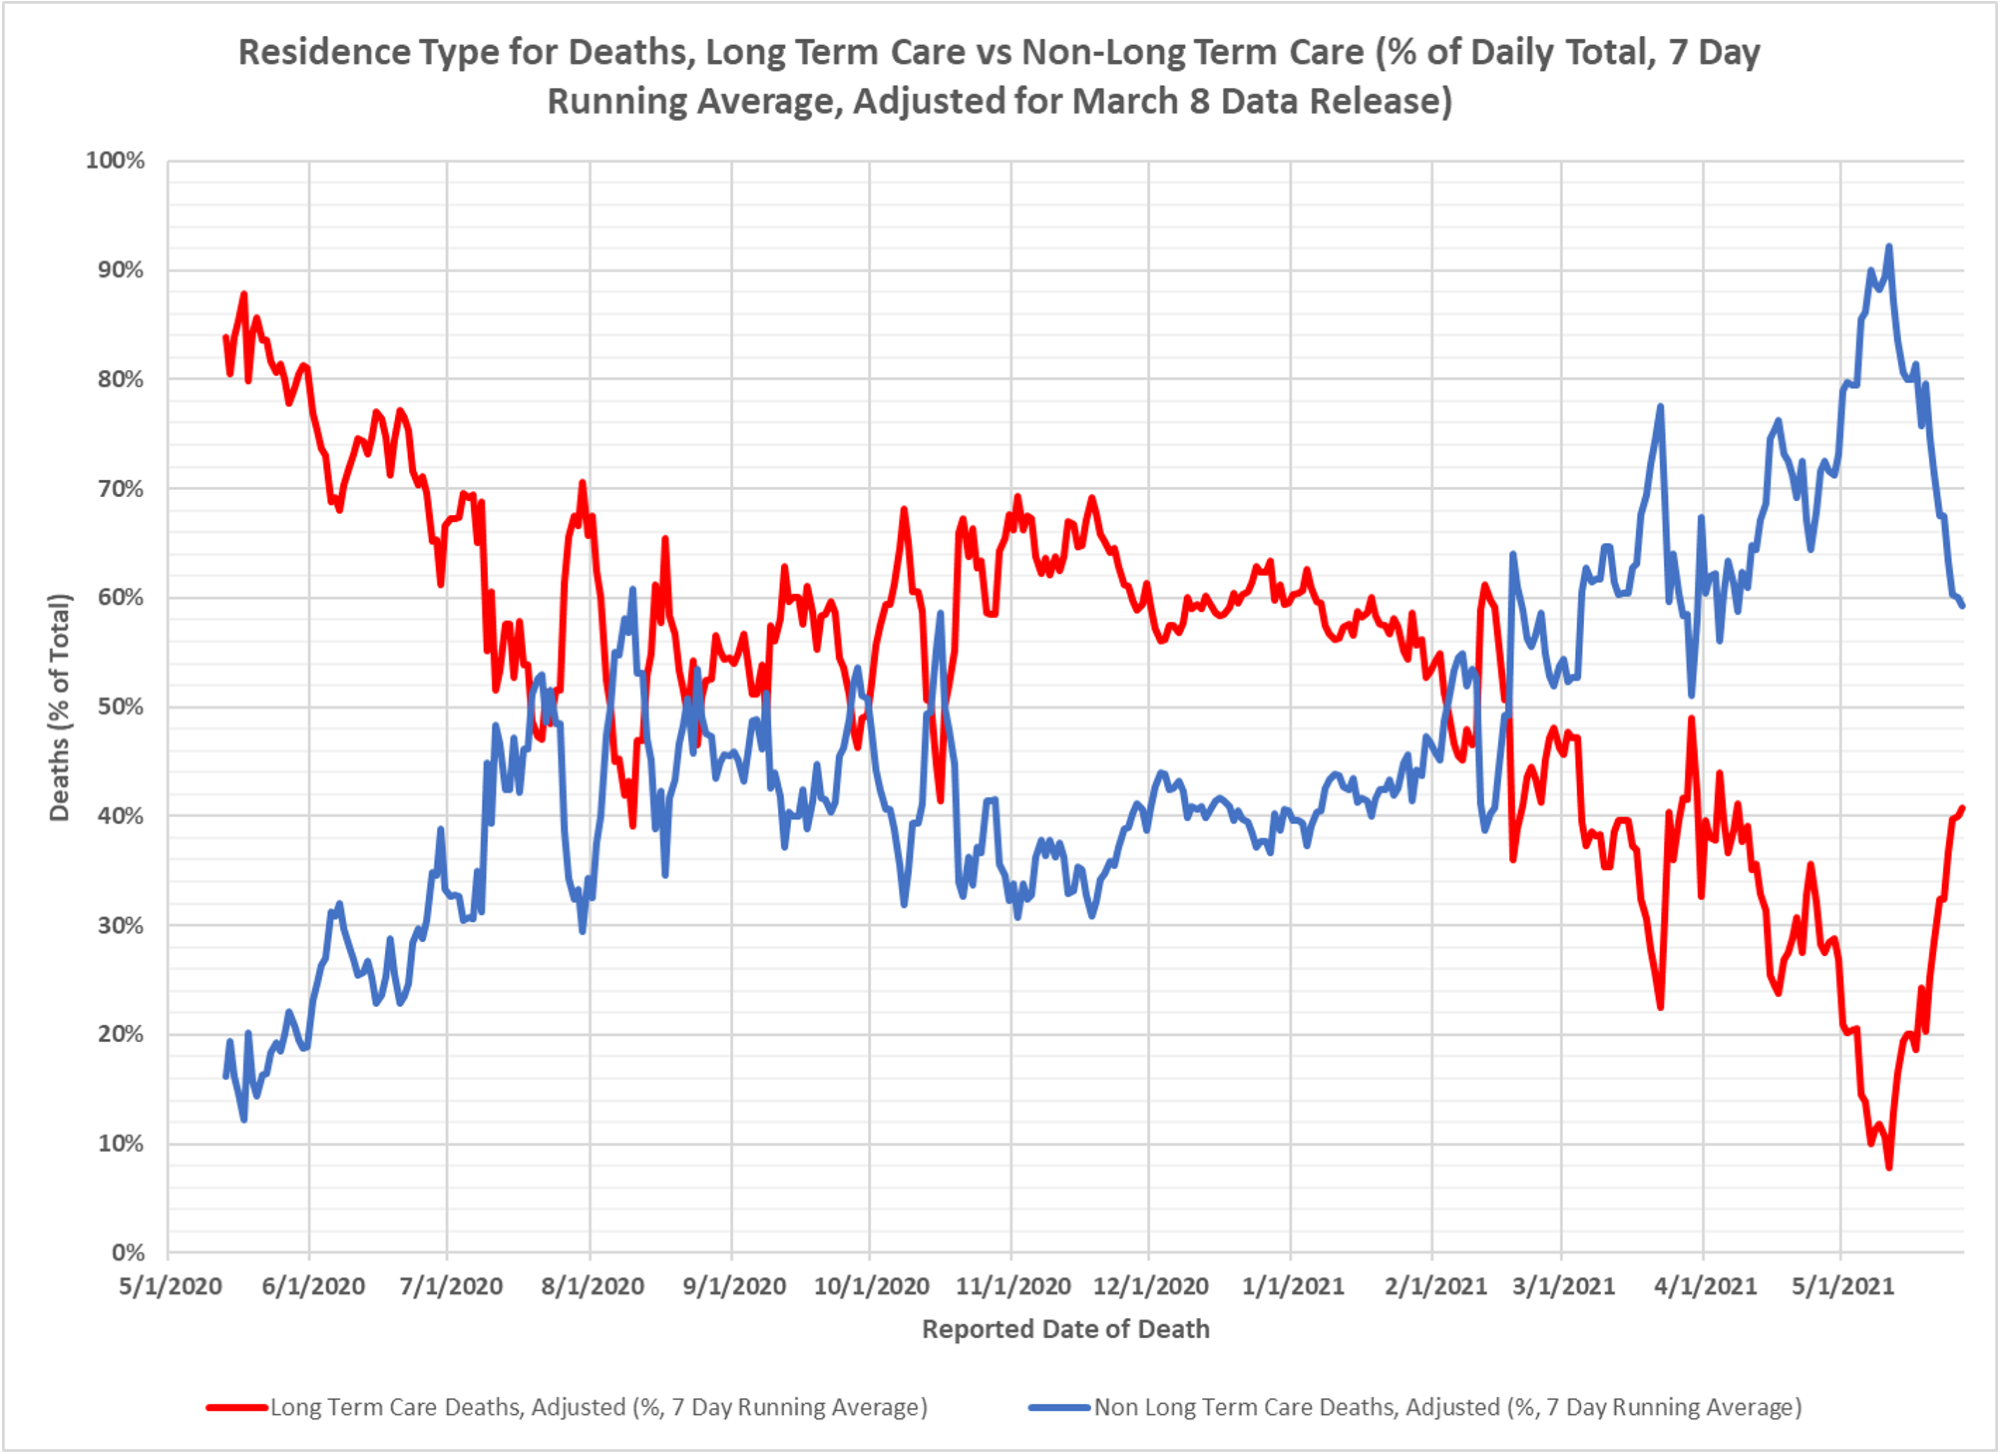
Now it is going to get a little interesting. As more and more of the population gets vaccinated and catches up to the percent of LTC residents vaccinated, we are going to see this ratio return to something like its former state. If all groups are equally vaccinated, the LTC population is always going to be more frail and susceptible, and the vaccines are going to work less well in that population. So they will become infected and have serious illness disproportionately. This most recent version of the chart suggests we may be starting to see that effect, as younger, community dwelling vaccination rates rise toward the older group. Nothing to be concerned about, totally to be expected. And as usual, this is confounded by the state’ poor death reporting. Absolute numbers of deaths remain low. Thanks to DD for the charts.