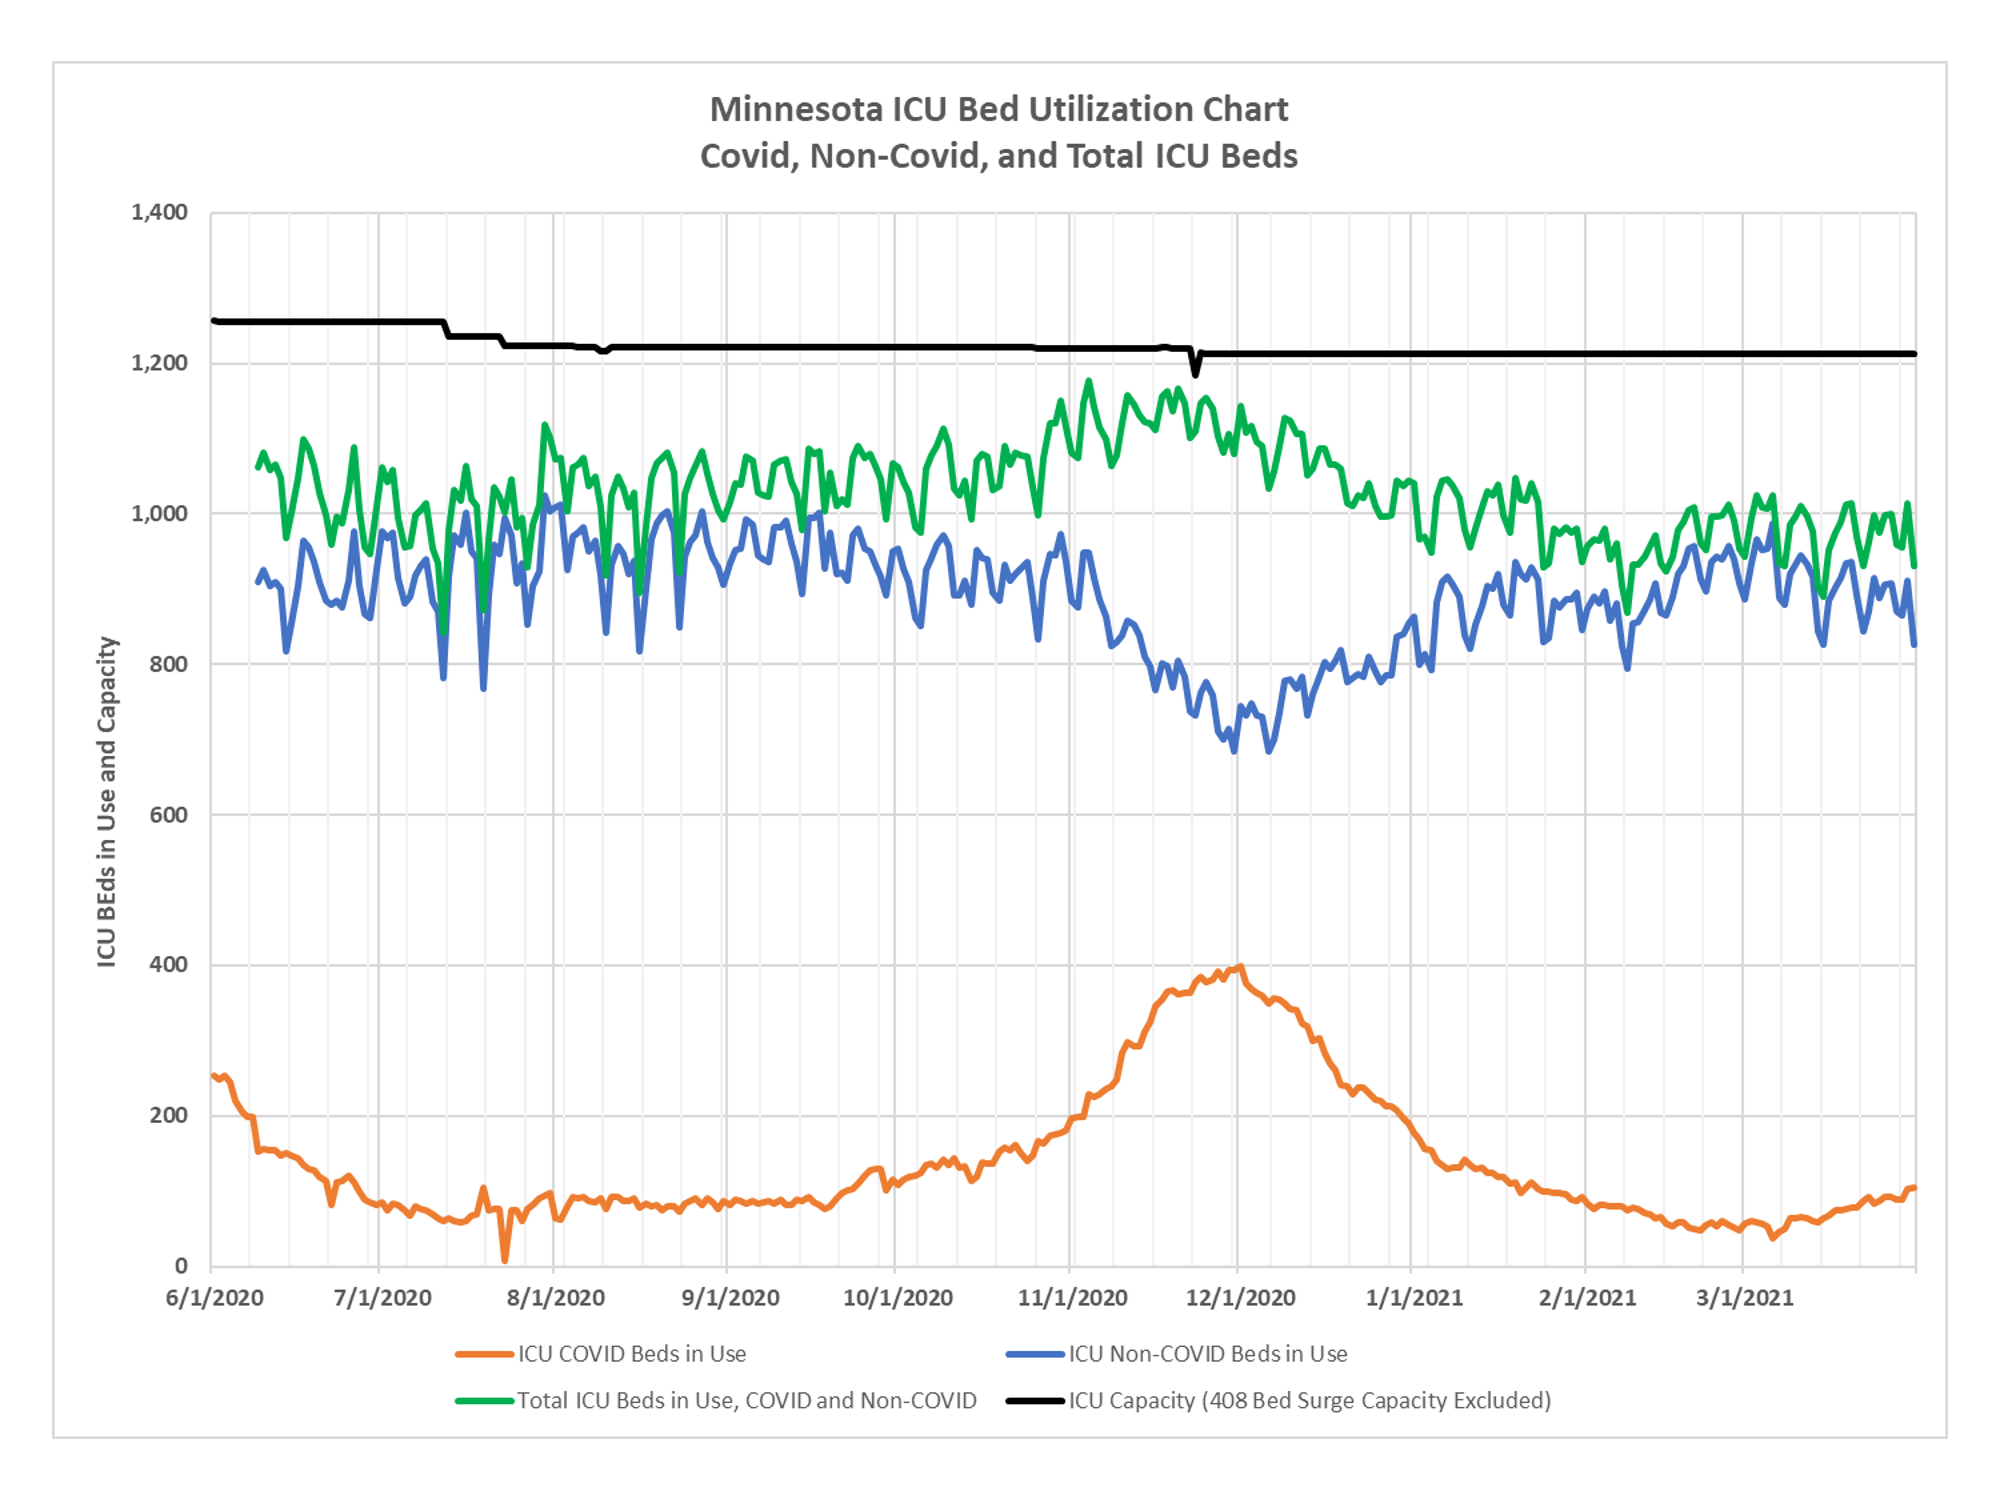
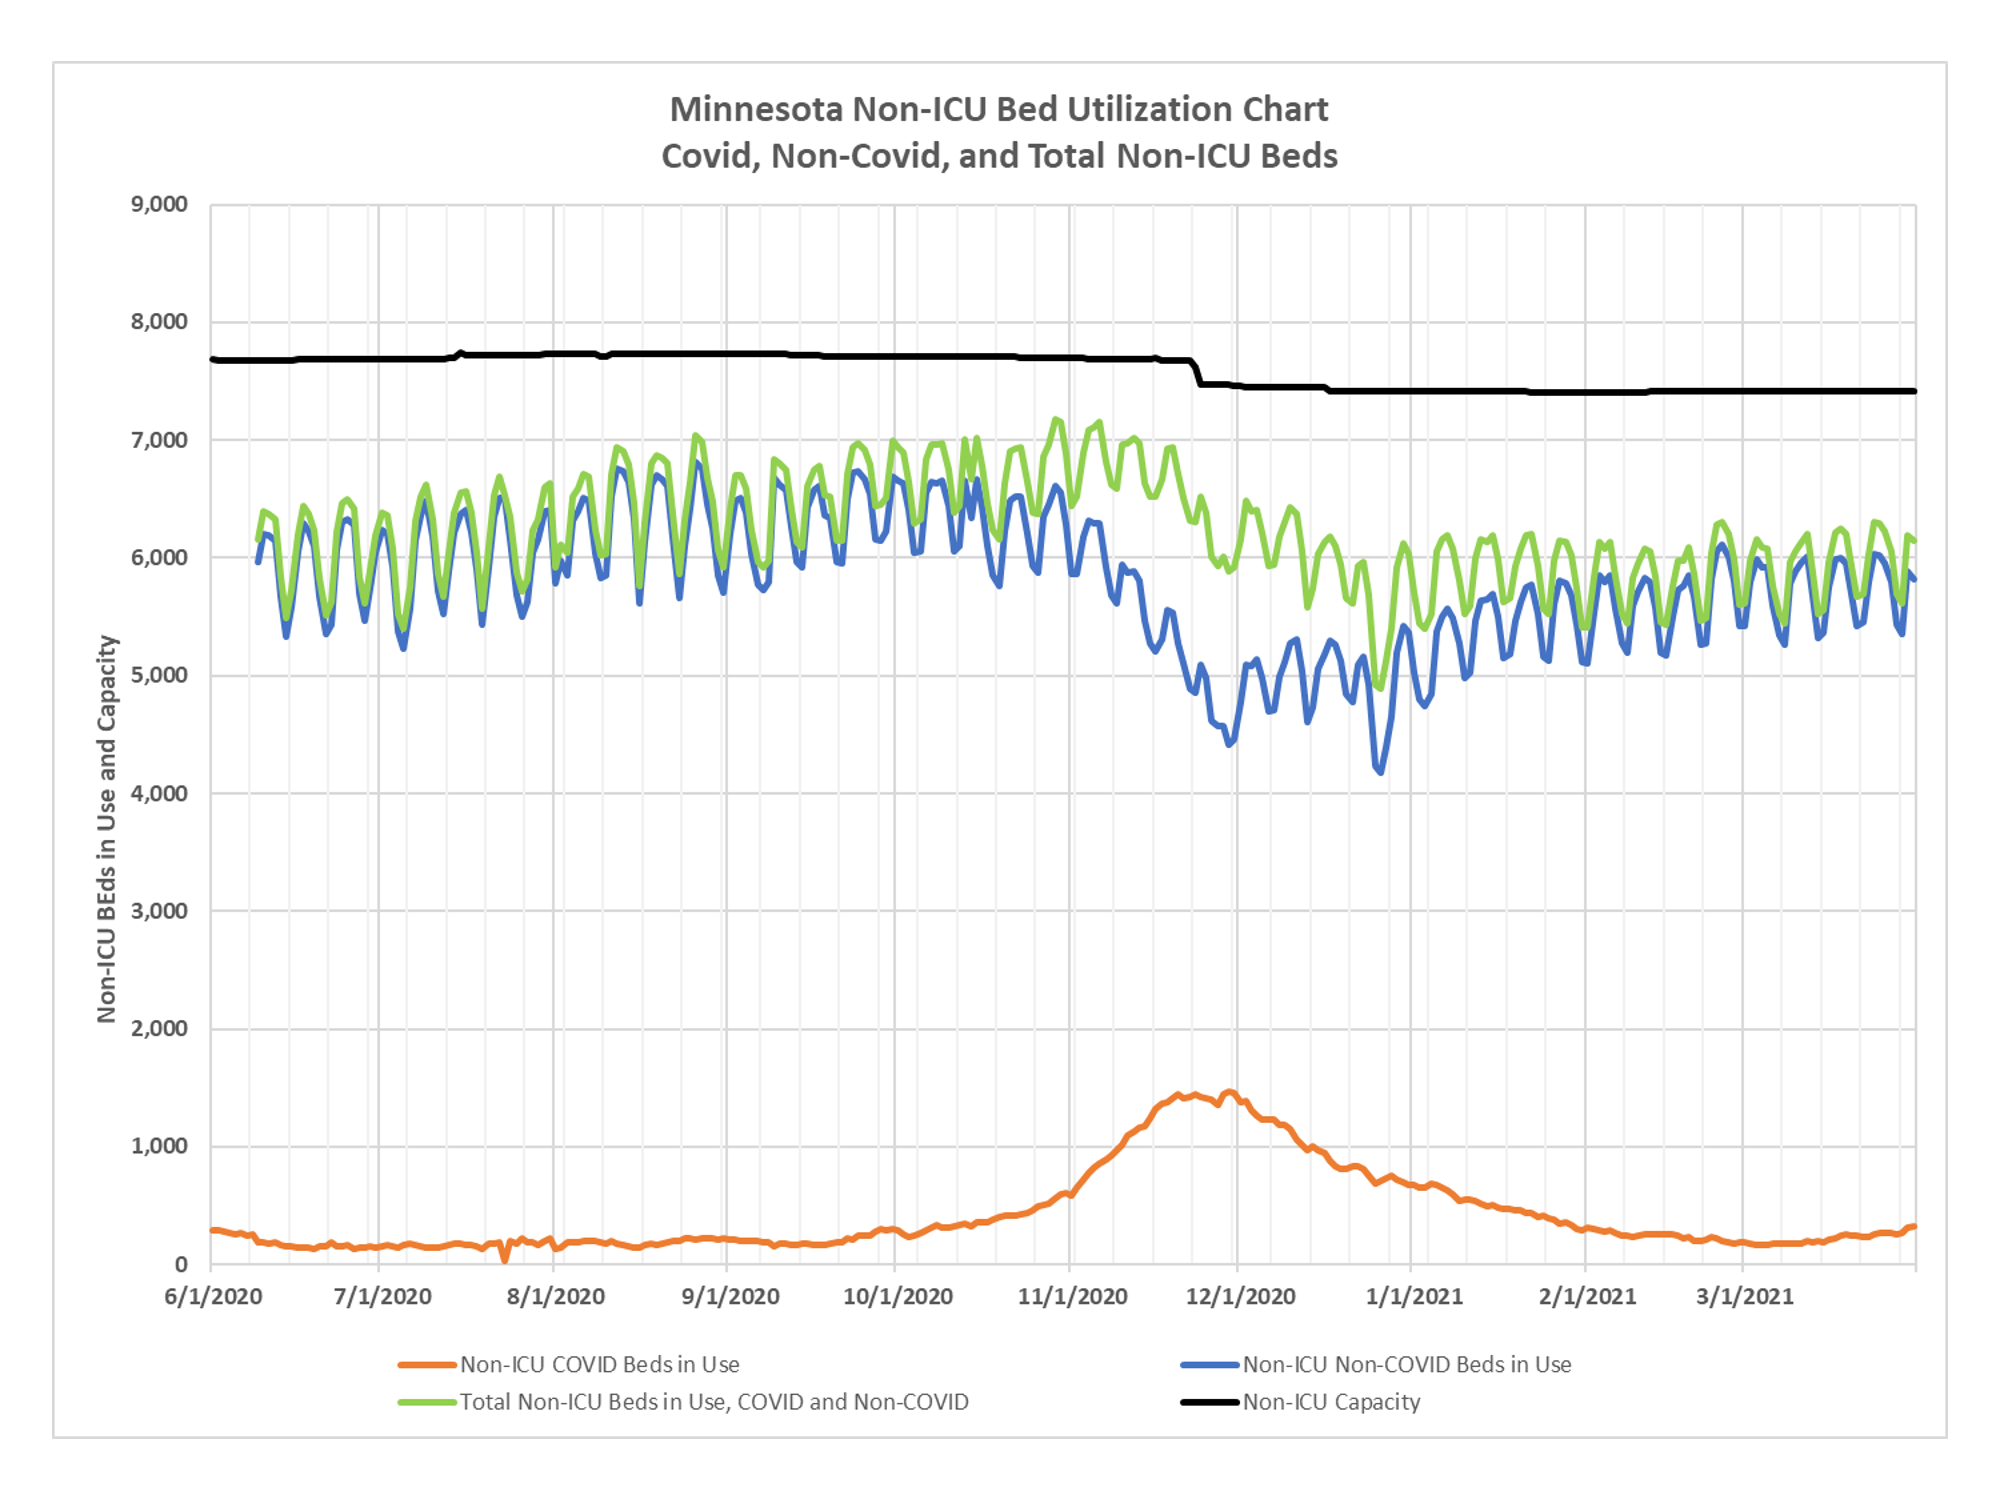
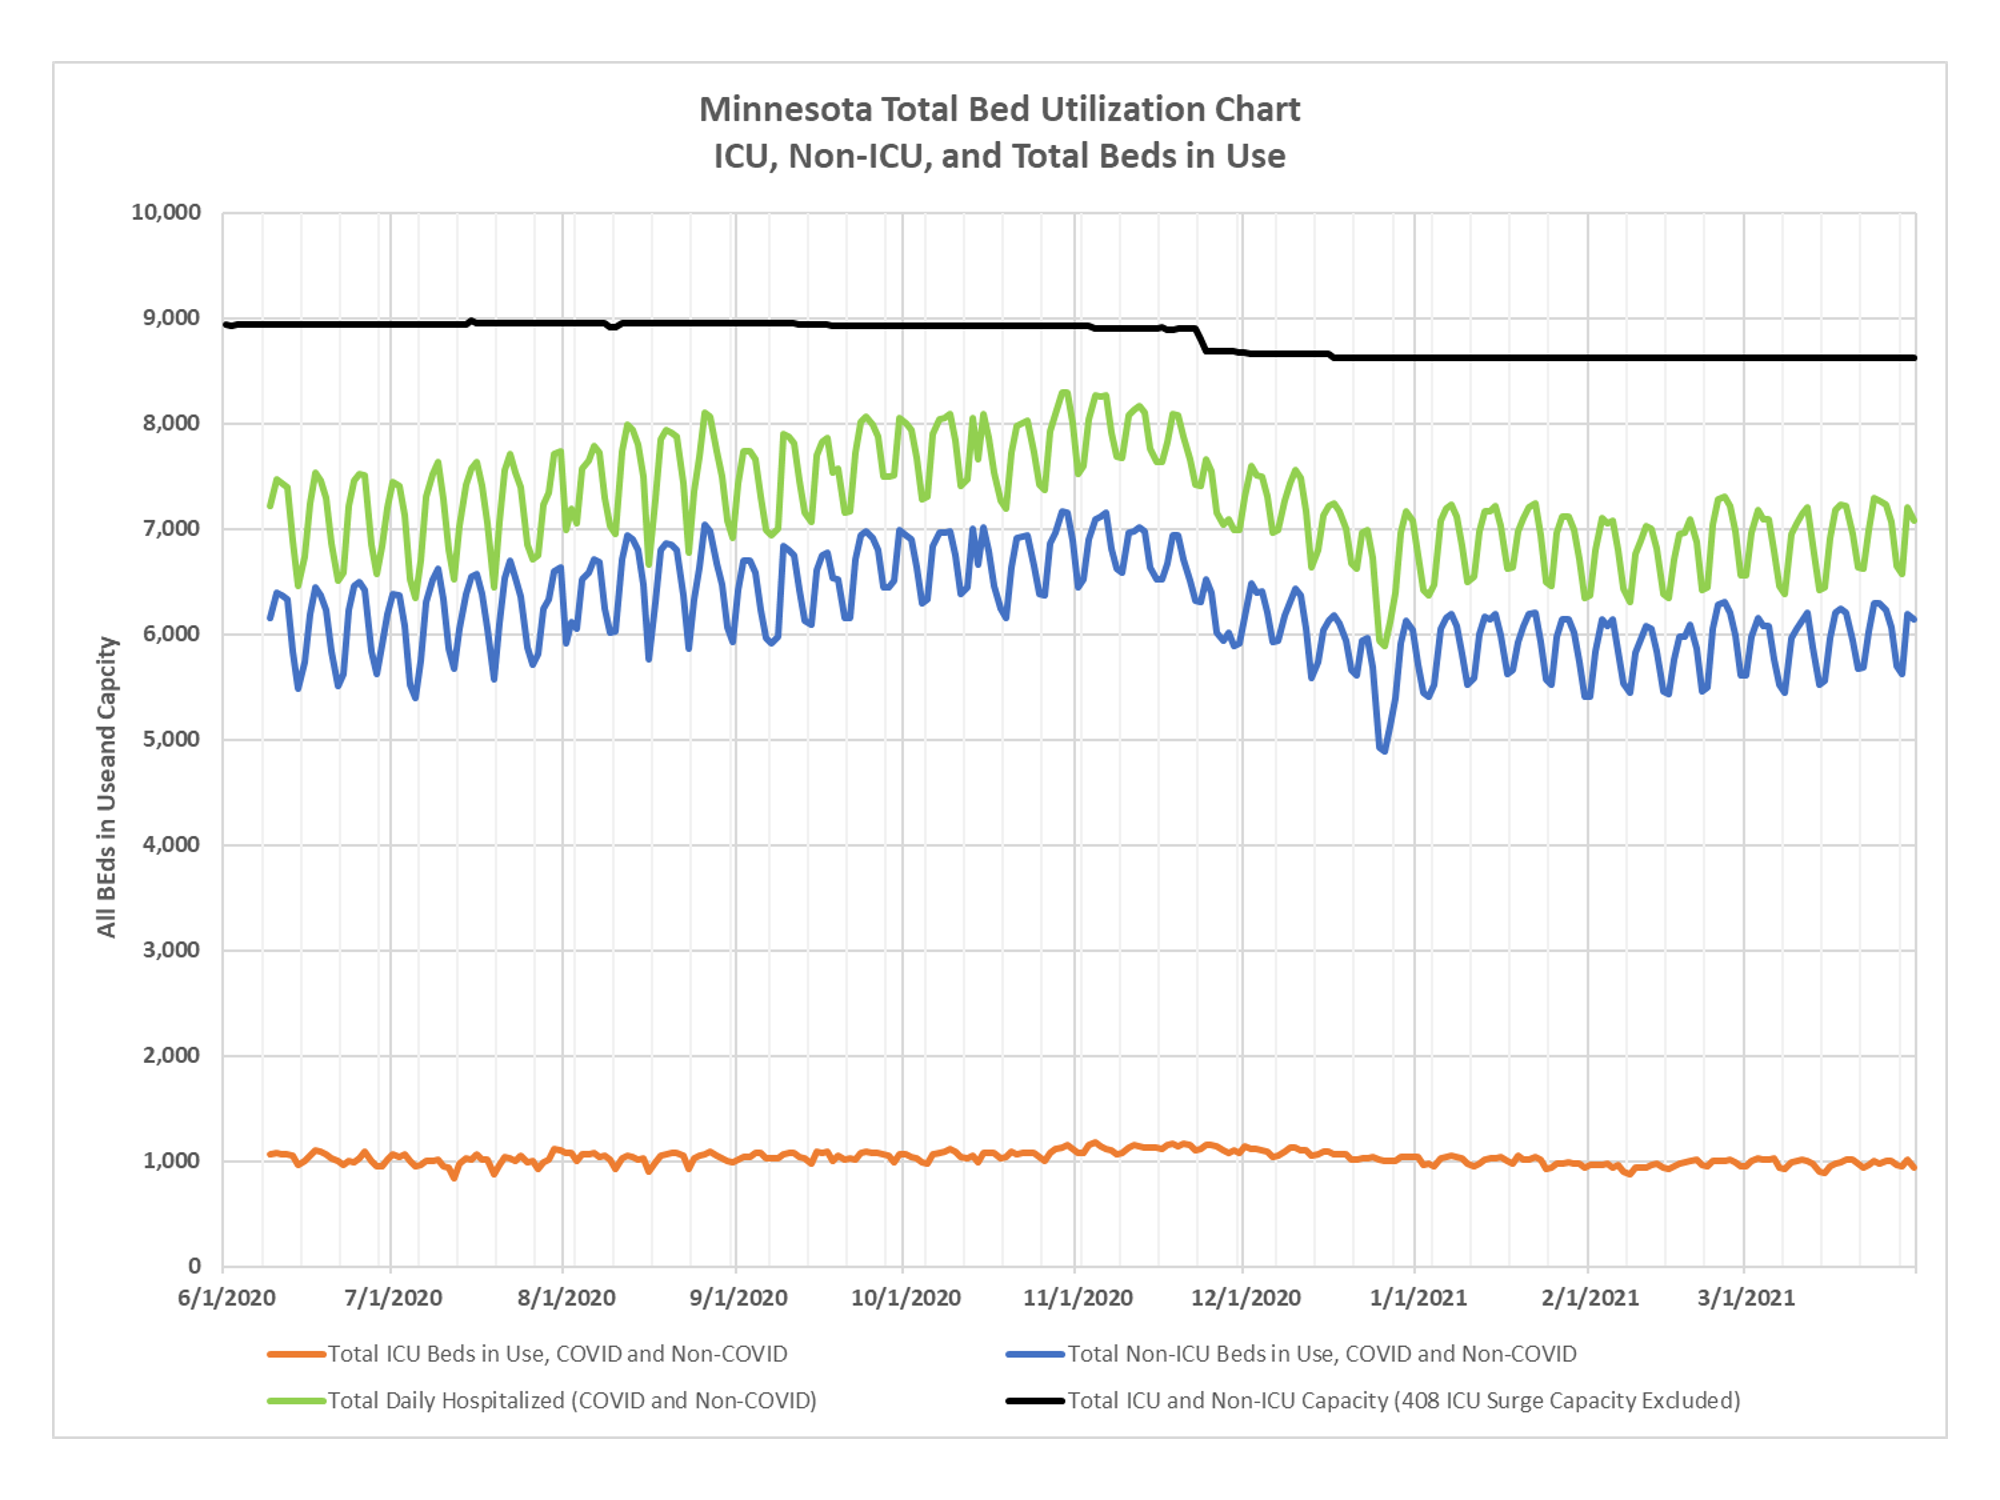
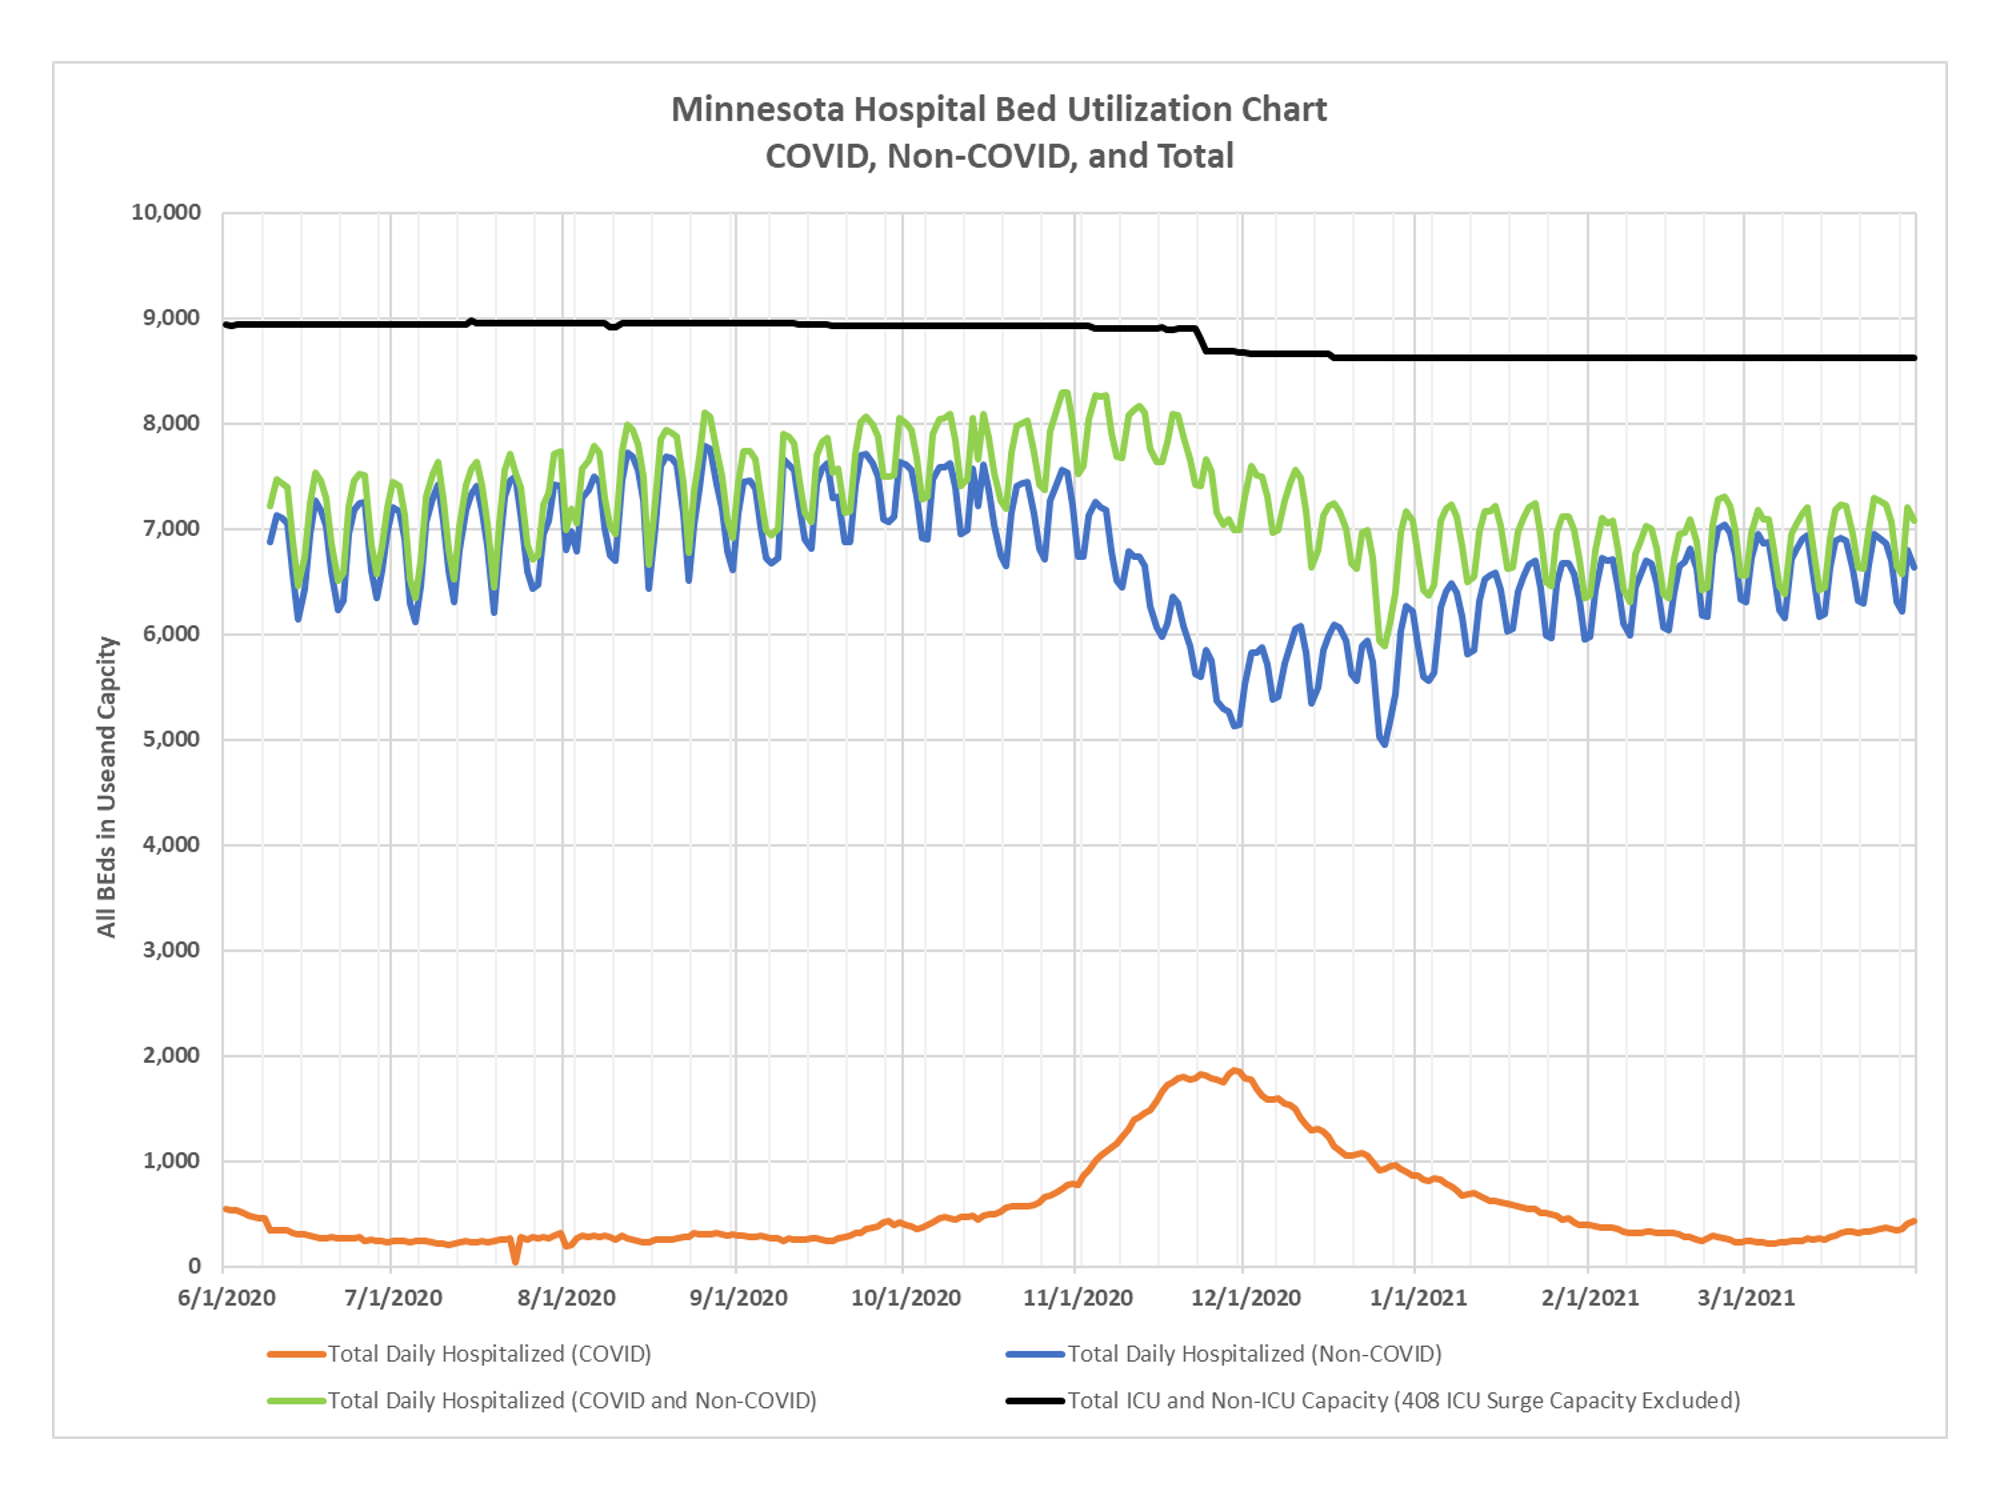
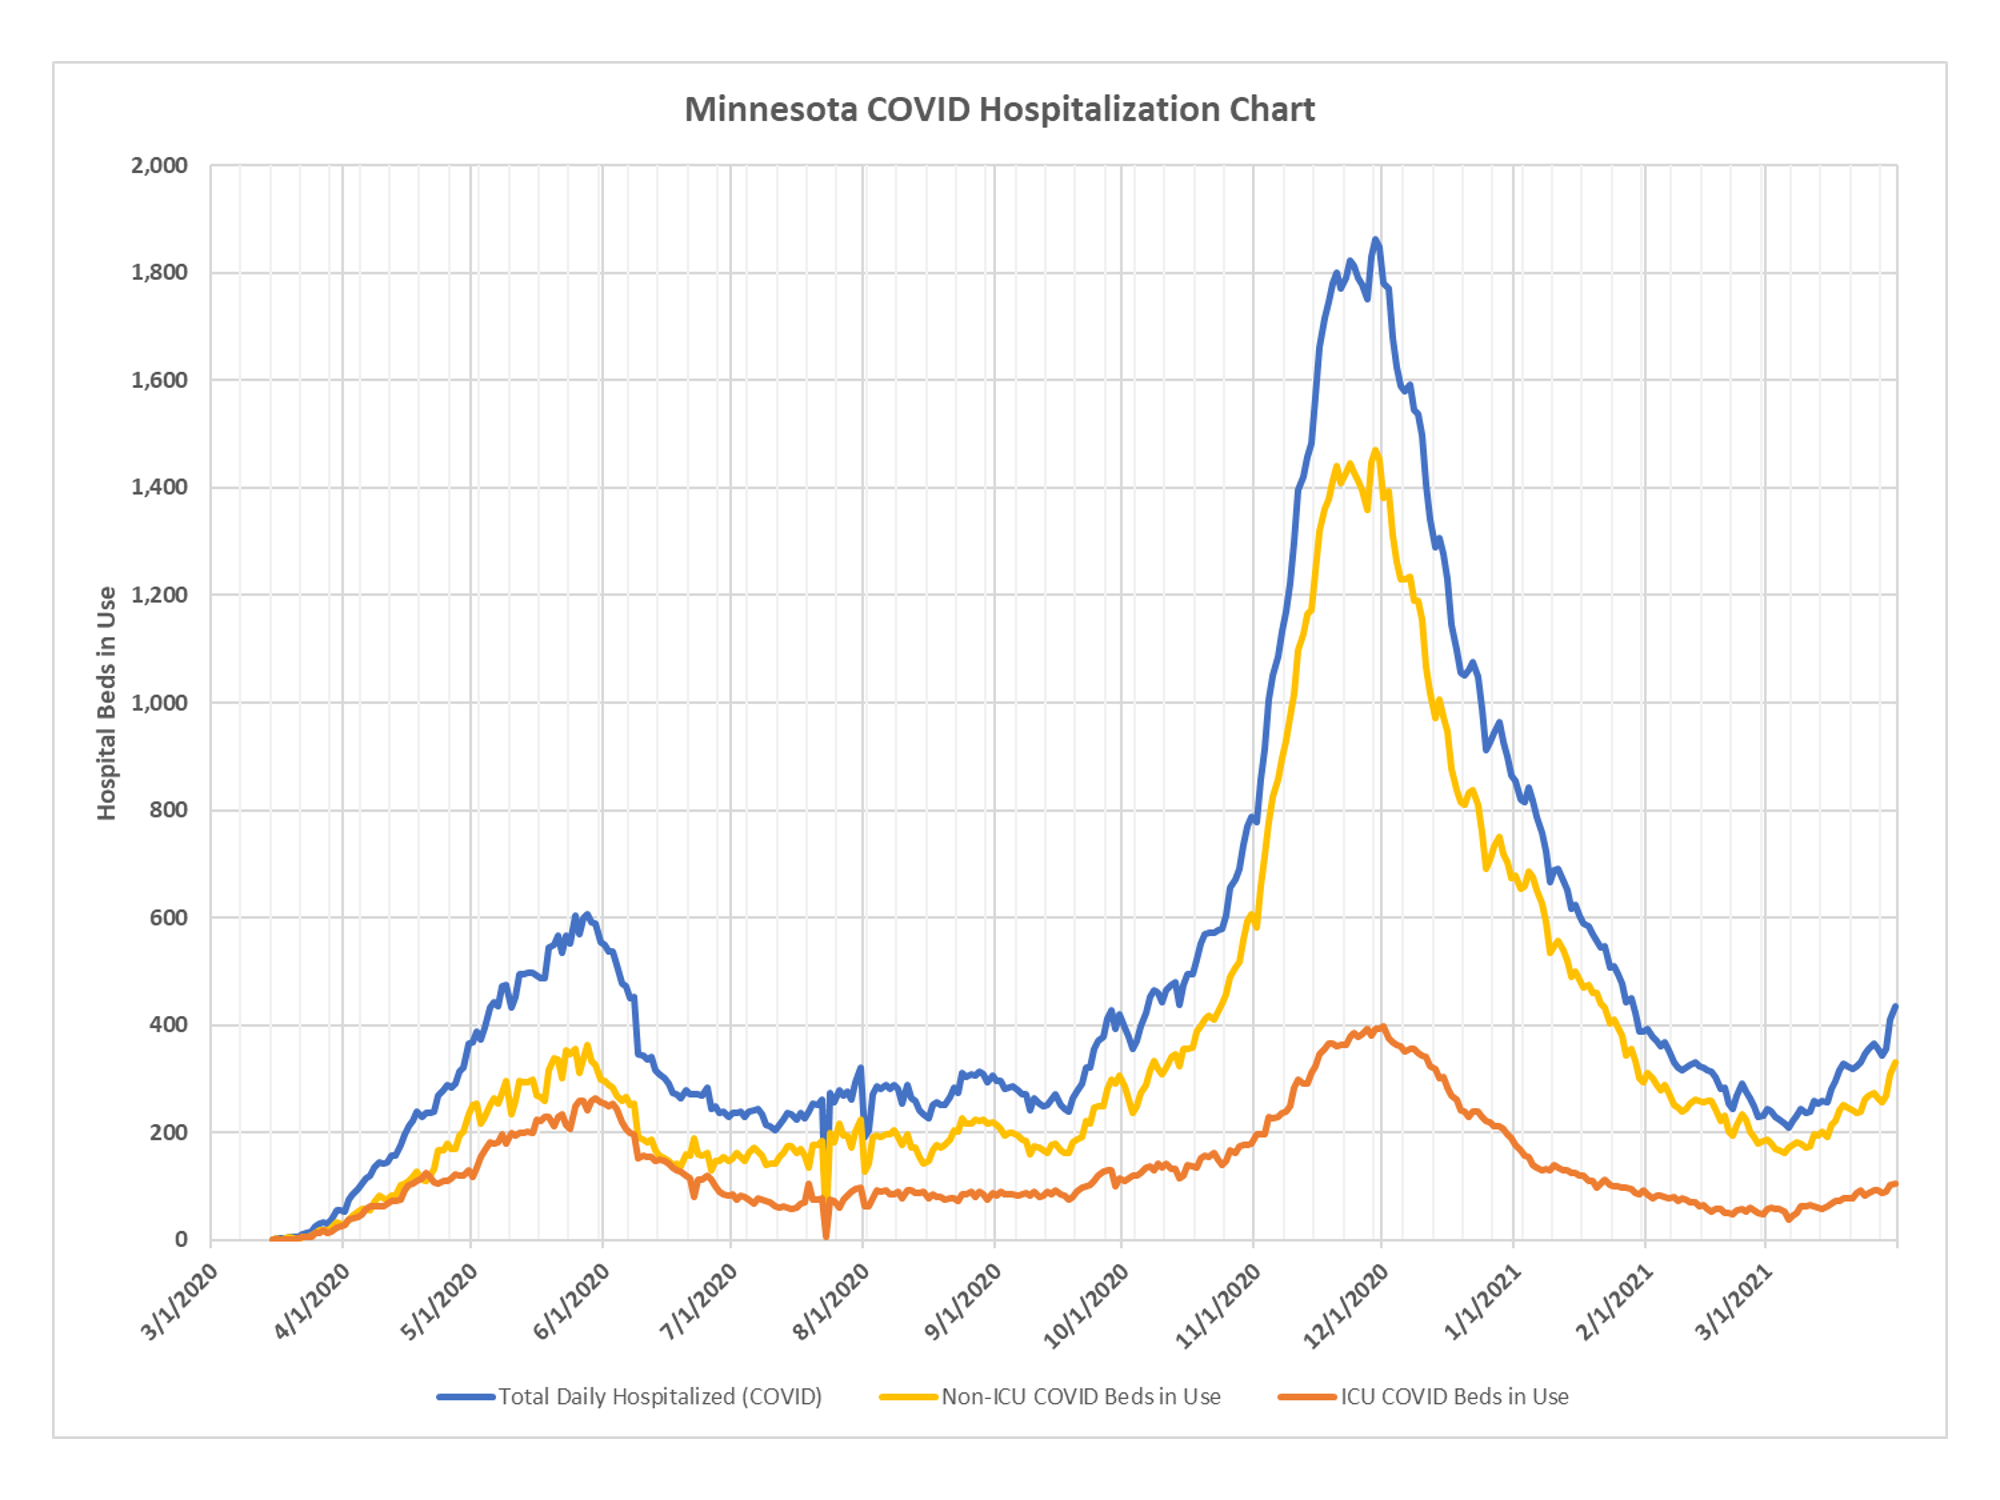
The set of charts below, thanks again to DD, reflects both CV-19 and non-CV-19 hospitalizations. That sawtooth pattern you see reflects the fact that elective hospitalizations don’t generally occur on the weekend. If you look at the chart of CV-19 hospitalizations, the last chart, you can see that it looks exactly like the chart of cases, with a slight offset to account for the lag in time to hospitalization. You can also see that at no time was hospital capacity actually threatened by CV-19 needs, some of which reflect remdesivir use, or CV-19 that was identified or contracted in the hospital.
Hospitalizations in Minnesota, Update April 2, 2021
No Comments
✅ Subscribe via Email
About this Blog
Healthy Skeptic Podcast
Research
MedPAC 2019 Report to Congress
June 18, 2019
Headlines
Tags
Access
ACO
Care Management
Chronic Disease
Comparative Effectiveness
Consumer Directed Health
Consumers
Devices
Disease Management
Drugs
EHRs
Elder Care
End-of-Life Care
FDA
Financings
Genomics
Government
Health Care Costs
Health Care Quality
Health Care Reform
Health Insurance
Health Insurance Exchange
HIT
HomeCare
Hospital
Hospital Readmissions
Legislation
M&A
Malpractice
Meaningful Use
Medicaid
Medical Care
Medicare
Medicare Advantage
Mobile
Pay For Performance
Pharmaceutical
Physicians
Providers
Regulation
Repealing Reform
Telehealth
Telemedicine
Wellness and Prevention
Workplace