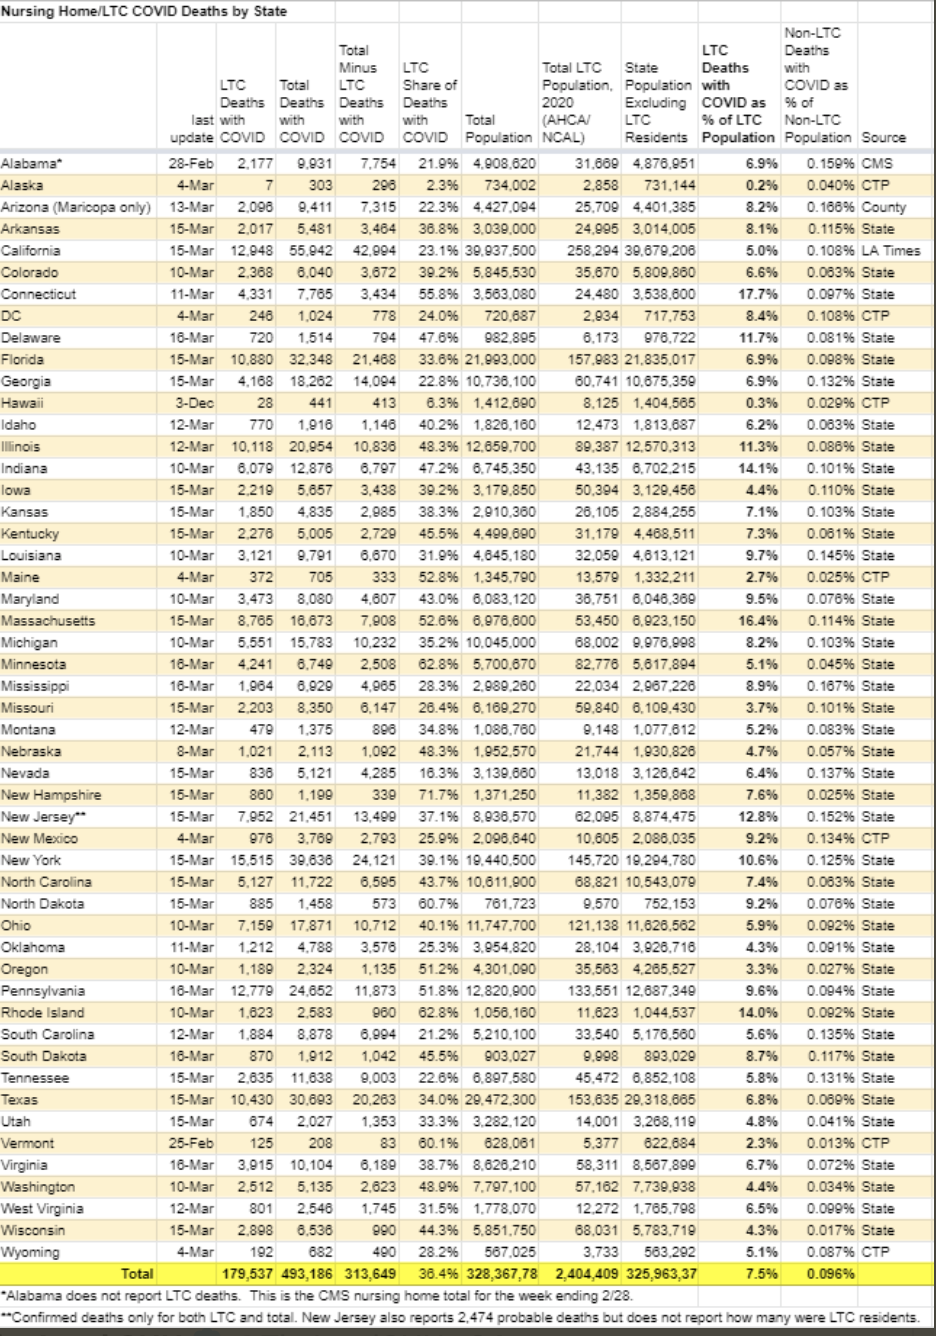
Another chart, from Phil Kerpen on Twitter, of long-term care deaths by state. Very interesting information. Some of the variability is due to categorization and reporting differences. Interesting too how the percent of the population in LTC facilities varies so much by state. Look especially at the columns on % of the LTC population whose death is attributed to CV-19 and the percent of the non-LTC population. Again, extremely bifurcated epidemic.

I’m from Michigan where the governor is getting scrutinized for nursing home policy–she’s one of the 5 baddies who shoved Covid patients back in nursing homes. Many states are doing more poorly than MI on the %LTCdead amongst LTC residents. Why is Indiana so bad, for example? MA and CT are awful.
Question regarding meaning of long term care. The Covenant Church retirement centers [e.g. Covenant Living of Golden Valley] typically have Independent Living, Assisted Living, and Skilled Nursing. Am I right to assume that the numbers in the chart for long term care would only include Skilled Nursing?
For Minnesota it would include assisted living and behavioral health group homes. One issue on comparability is that definitions vary across states. Minnesota’s is fairly broad.
This says 36% of covid deaths are in LTC but for some reason I thought it was much higher than that, like 65%?