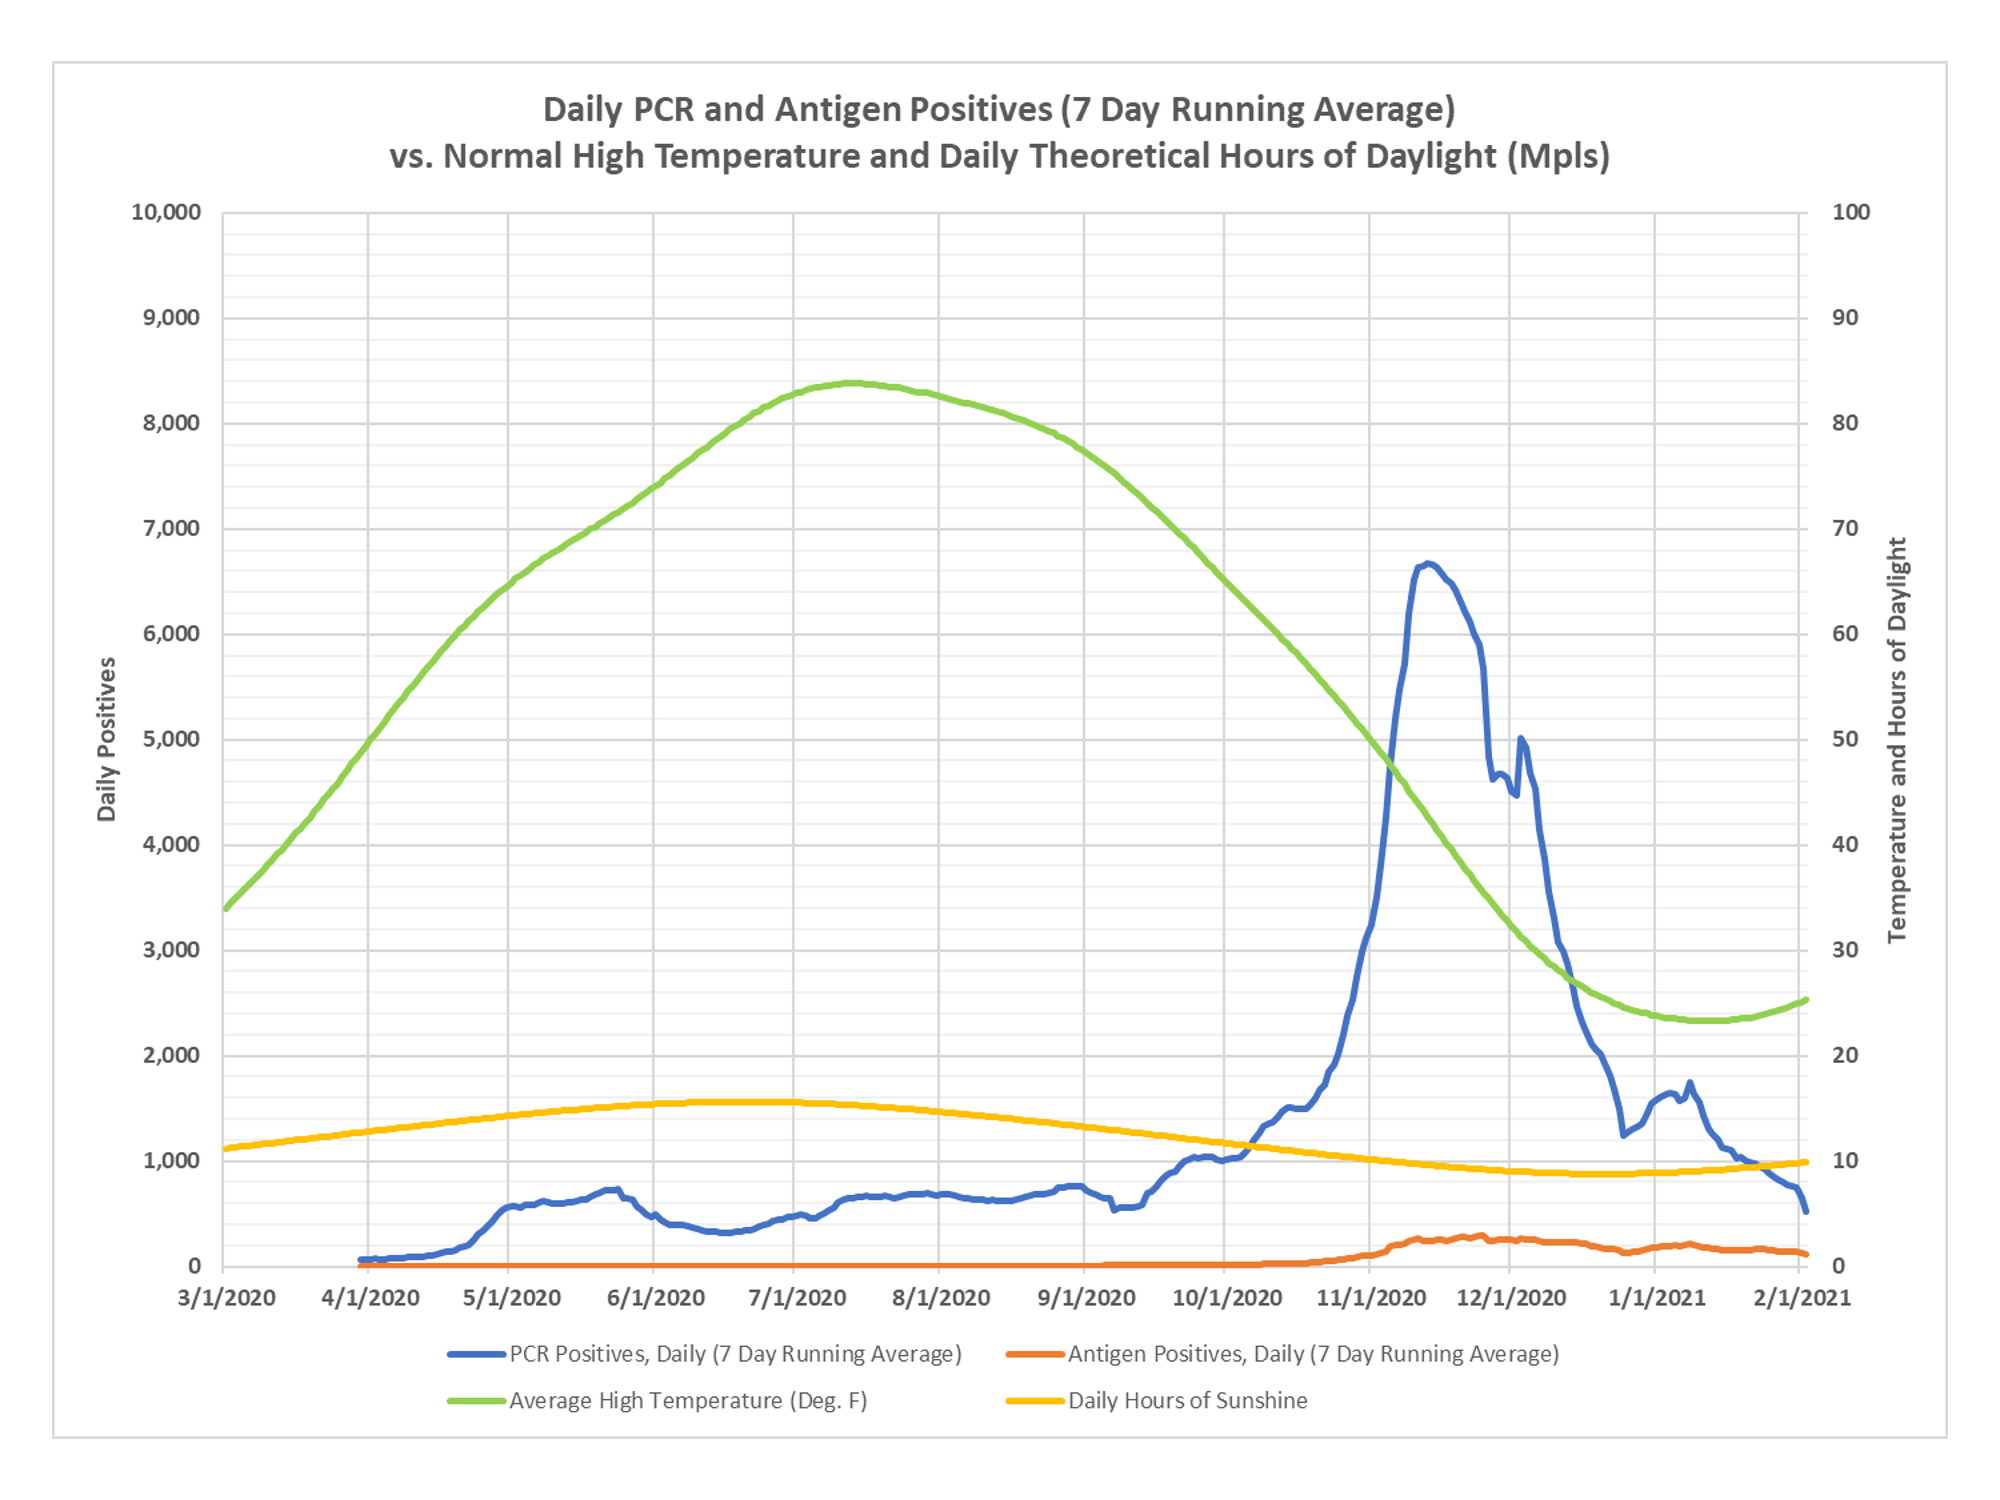
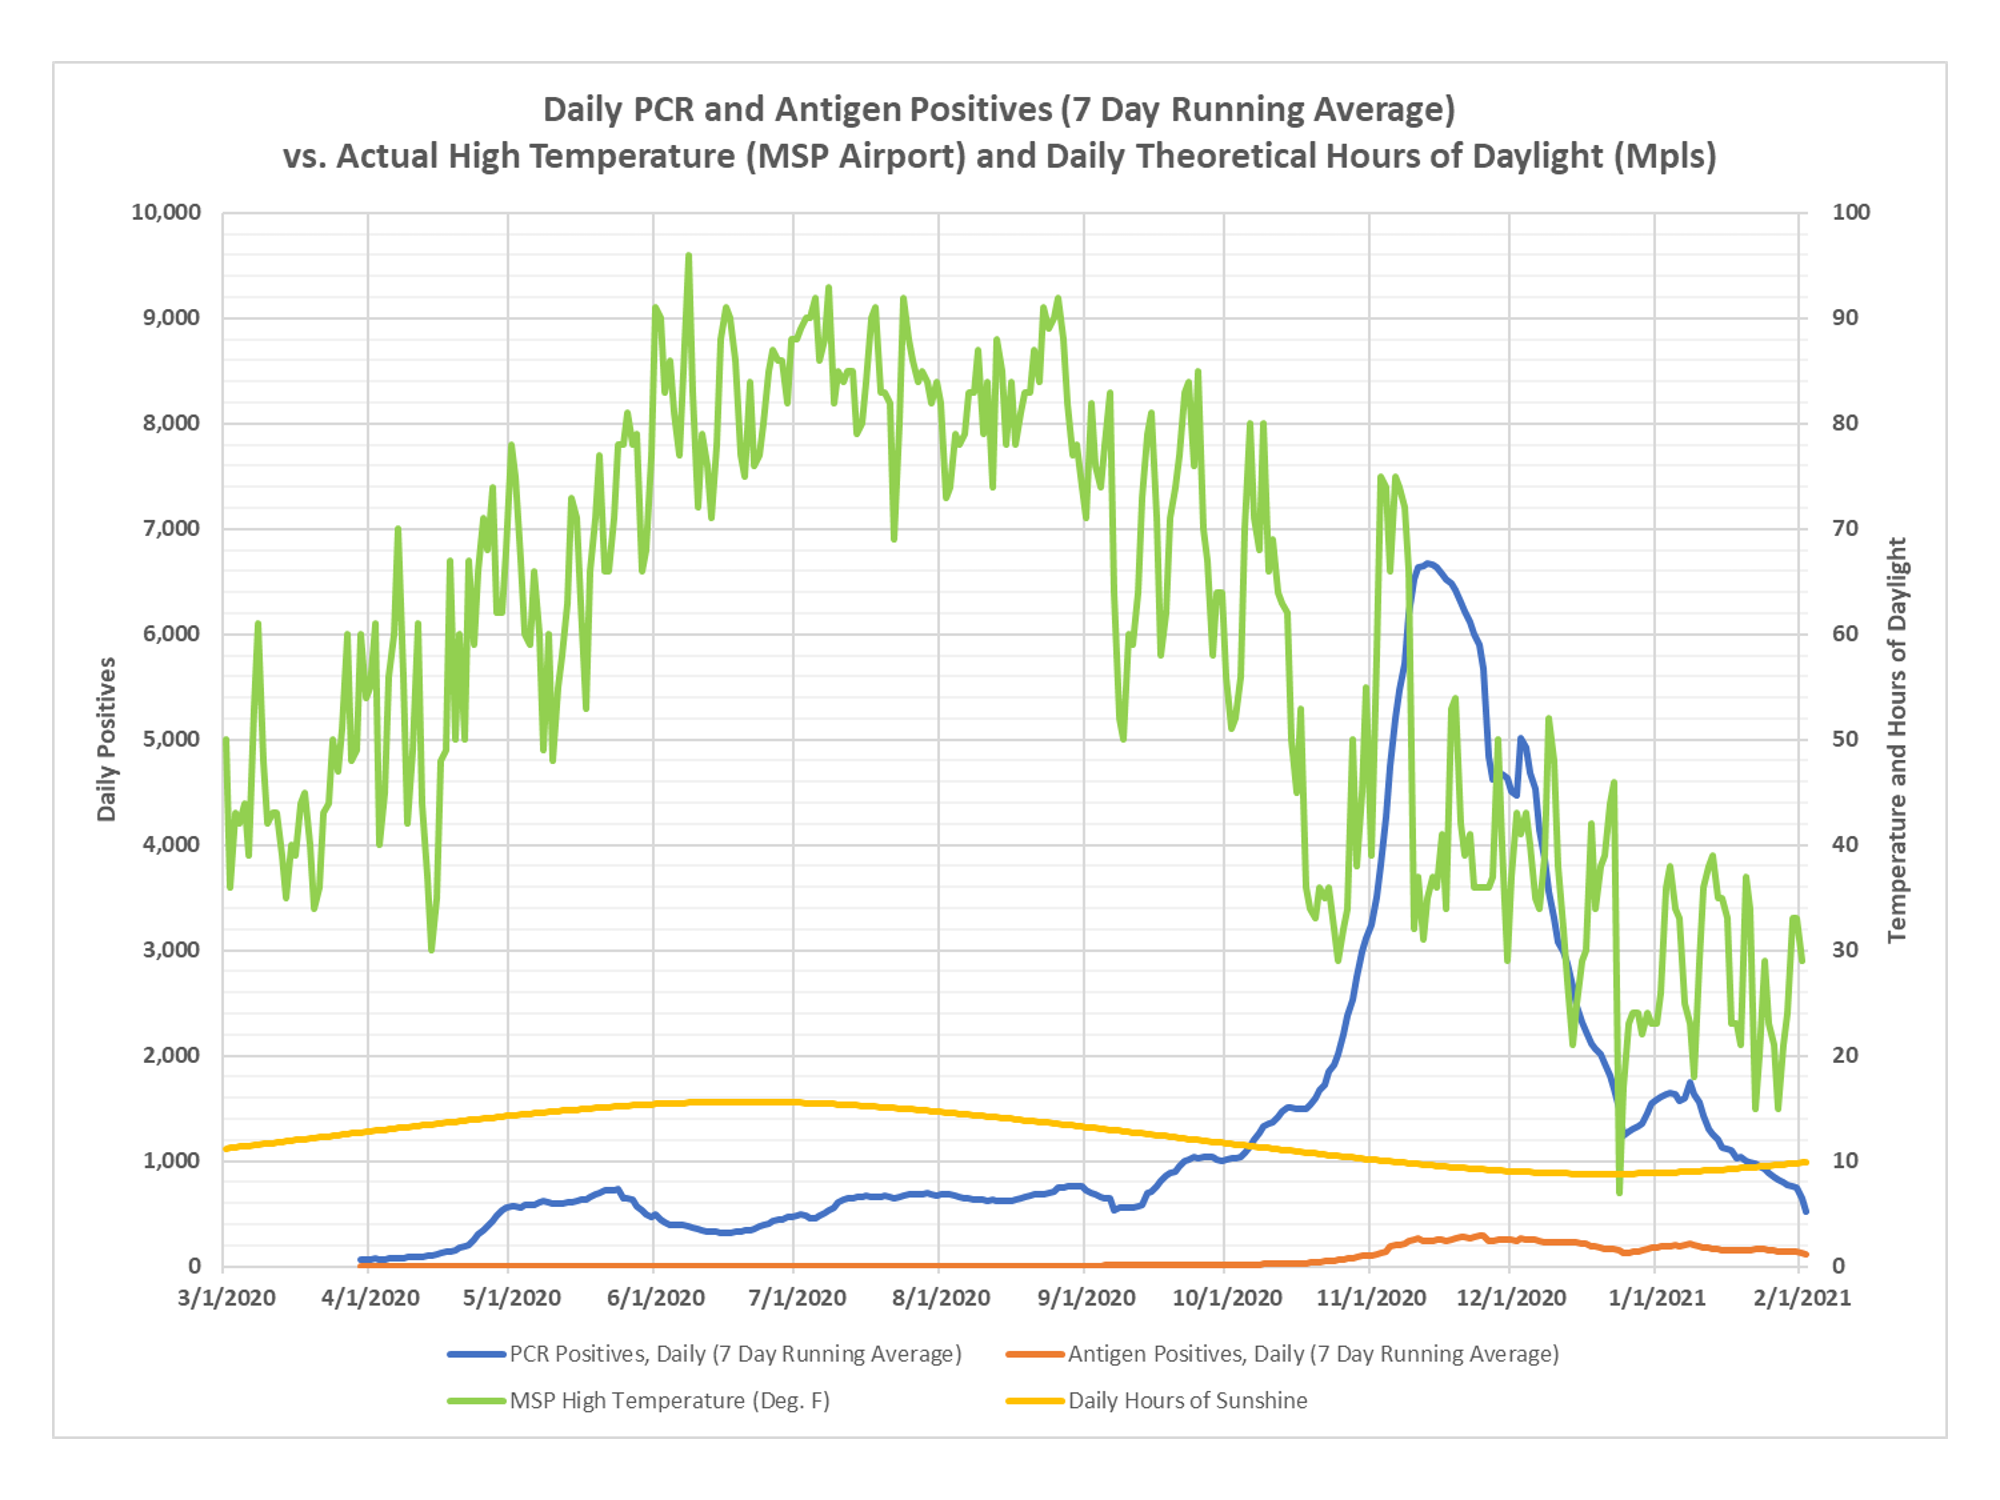
A couple of example charts from DD on seasonal/geographic patterns. It appears latitude is definitely a factor, probably as a proxy for meteorological variables. First, here are a couple of charts of cases versus temperature in Minnesota. The pattern is not overwhelmingly clear, but it does look like a sharp downturn in temperature was associated with the start of a case surge and perhaps intensified it.
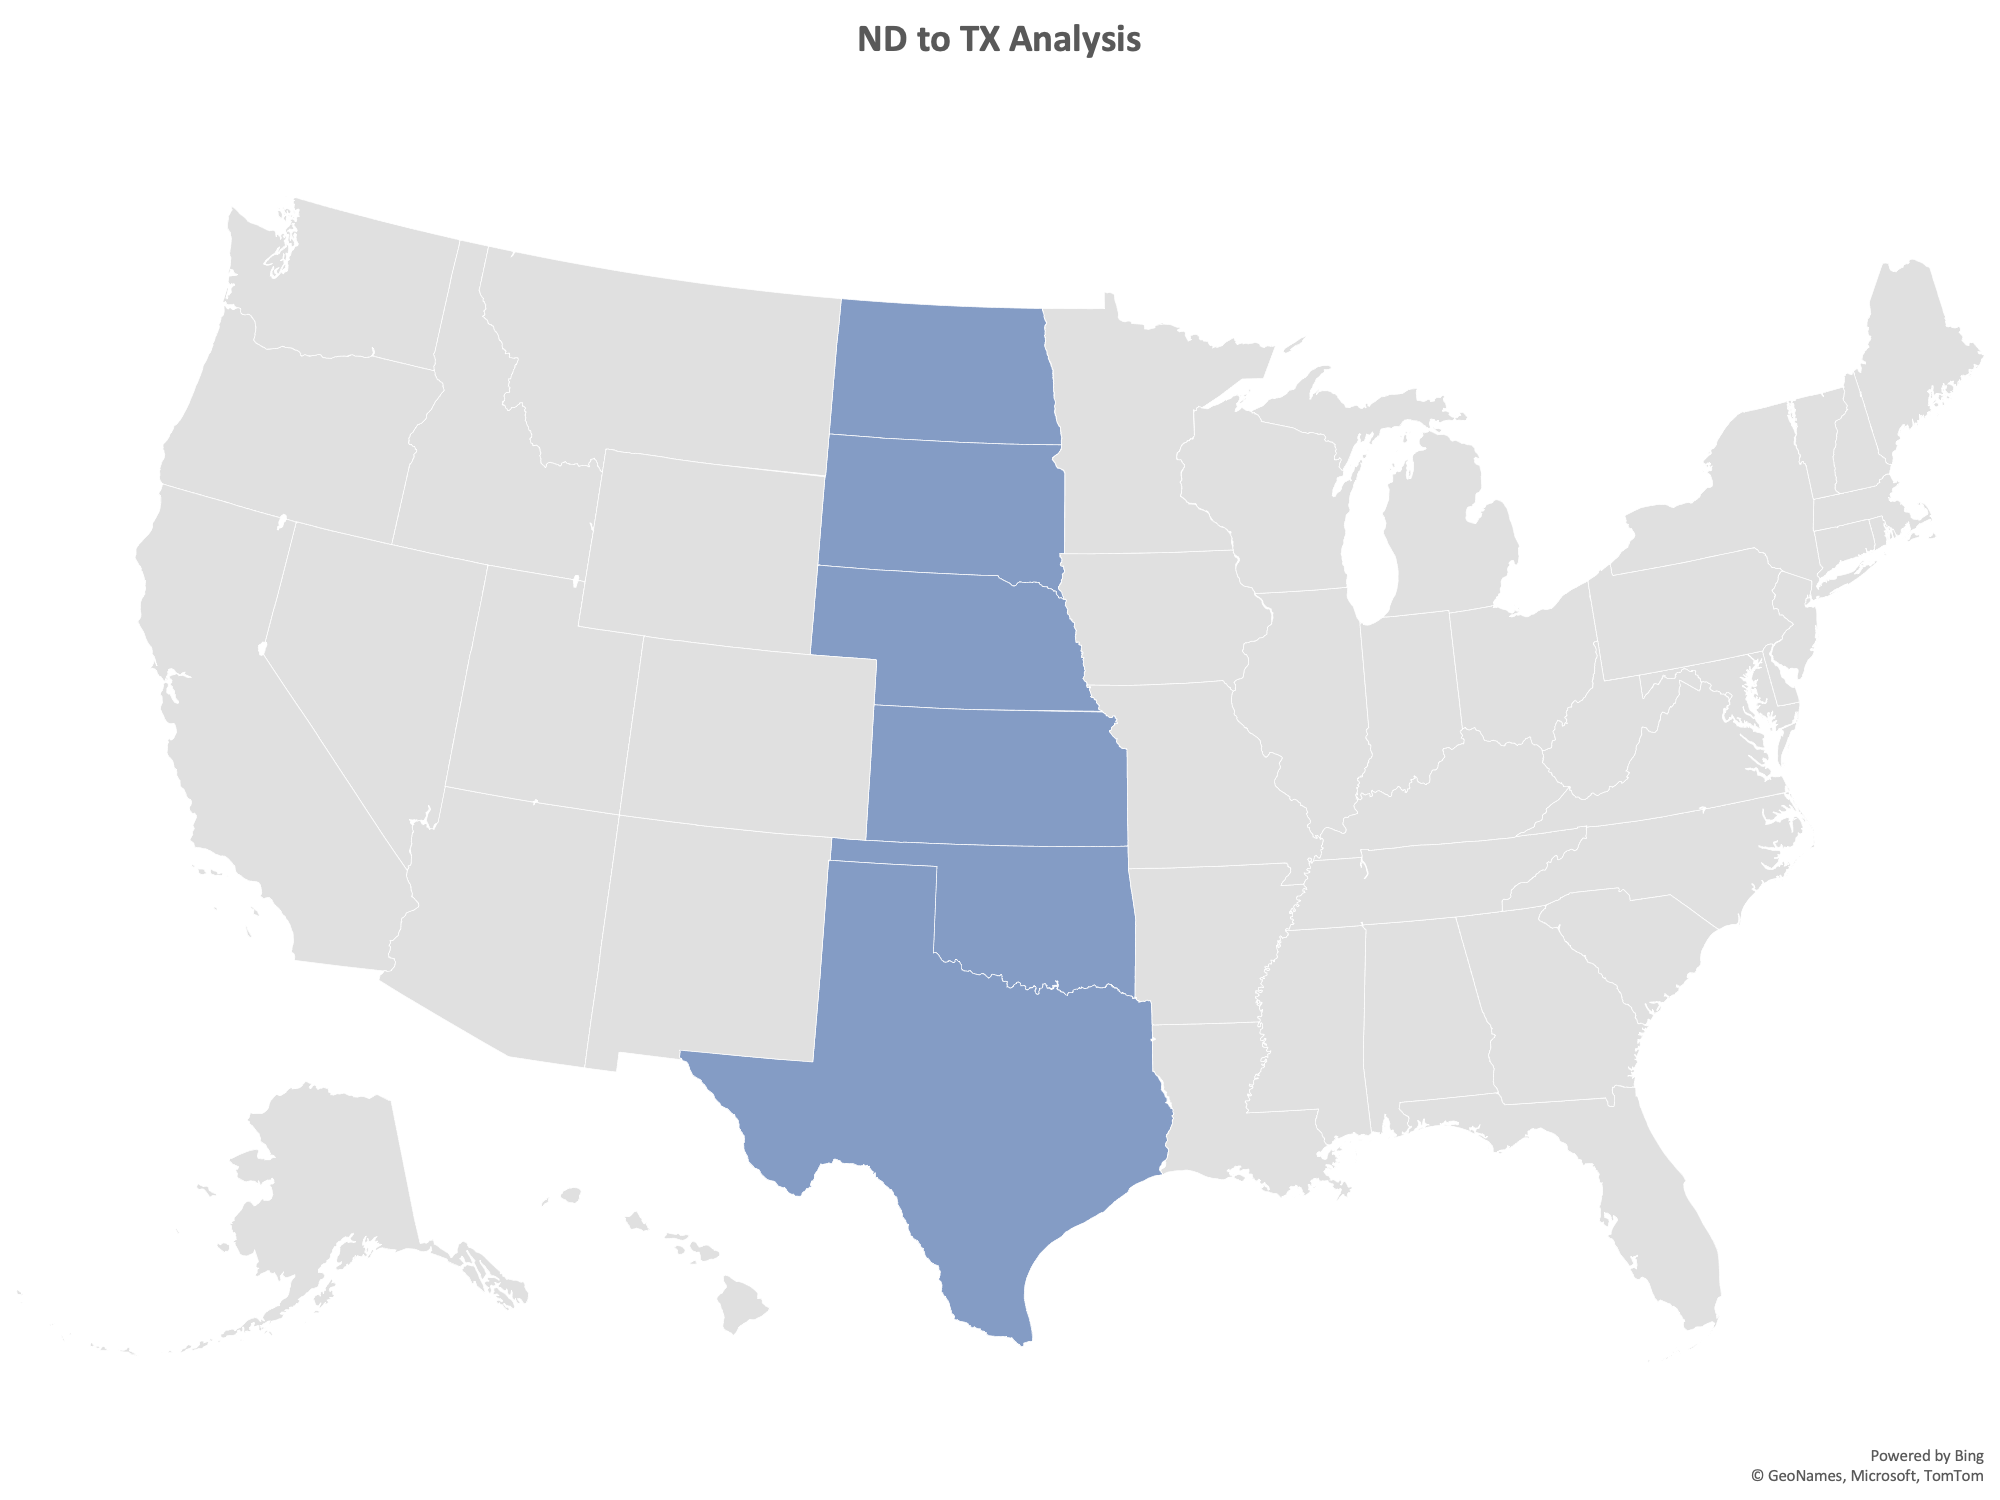
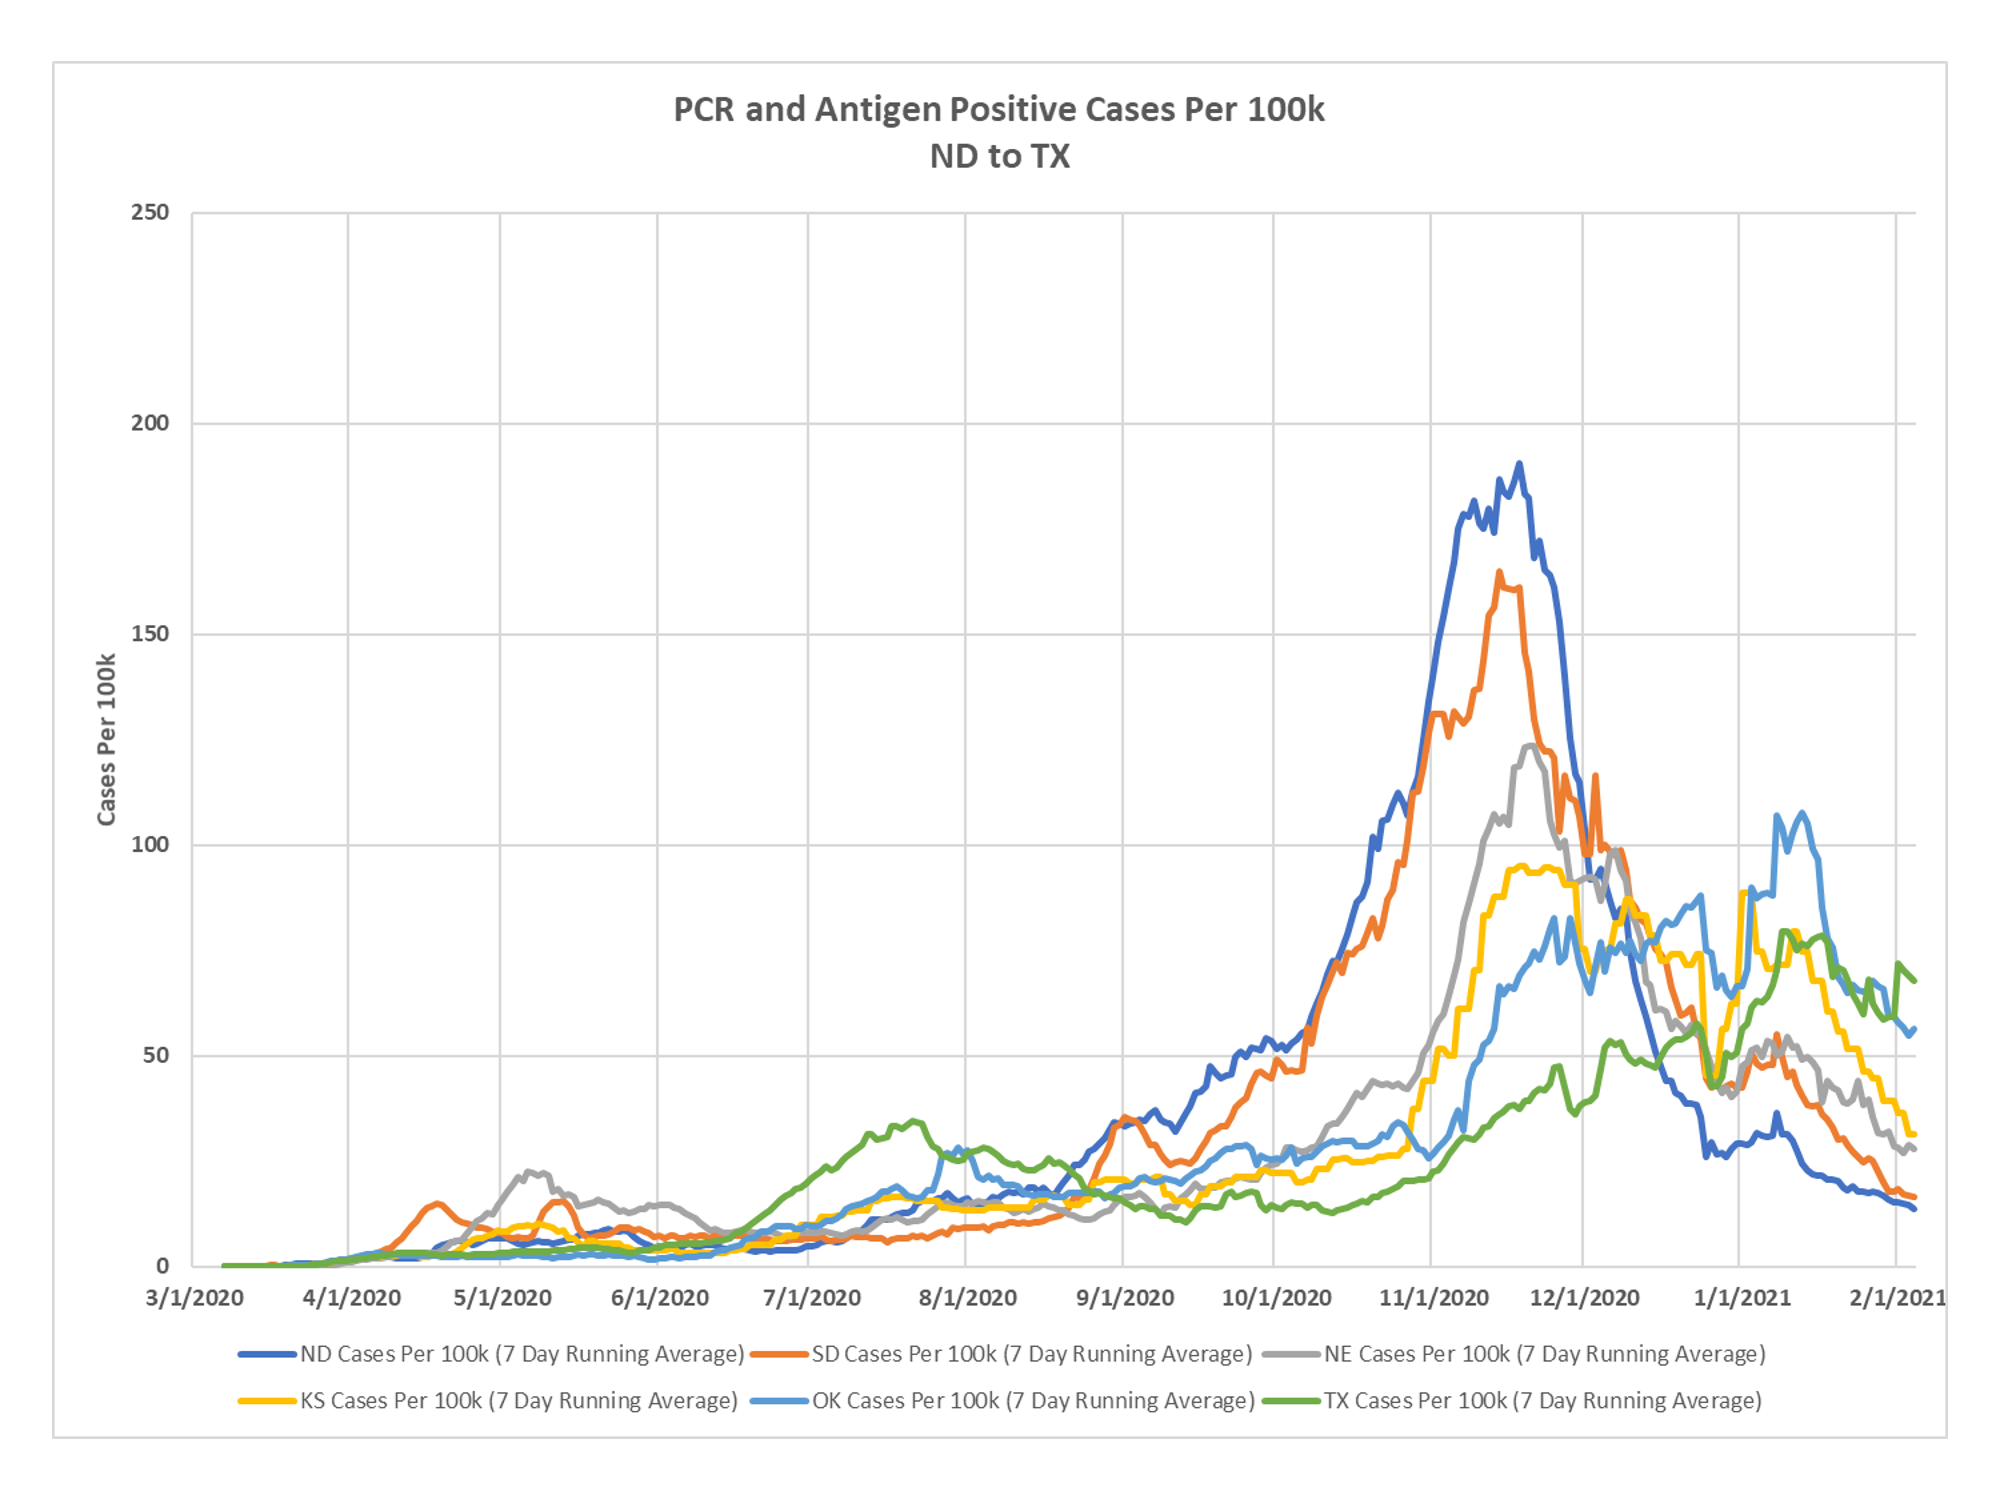
Next, an example strip of states by latitude, this one from North Dakota to South Dakota to Nebraska to Kansas to Oklahoma to Texas, pretty much states stacked right on top of each other. Generally not overly restrictive states in terms of mitigation efforts. Very noticeable how the farther northern states have a sharper peaked pattern but as you get down to Kansas it looks more like rising to a plateau and staying there longer and Oklahoma and Texas have a smaller peak and a later one, but a more sustained wave. Just interesting to look at.

seems to align with the work of Edgar Hope-Simpson
Agree with Lee. The point to remember about that strip of states is that the daily change in the minutes of sunlight is much more pronounced in the northern latitudes than in the southern latitudes.