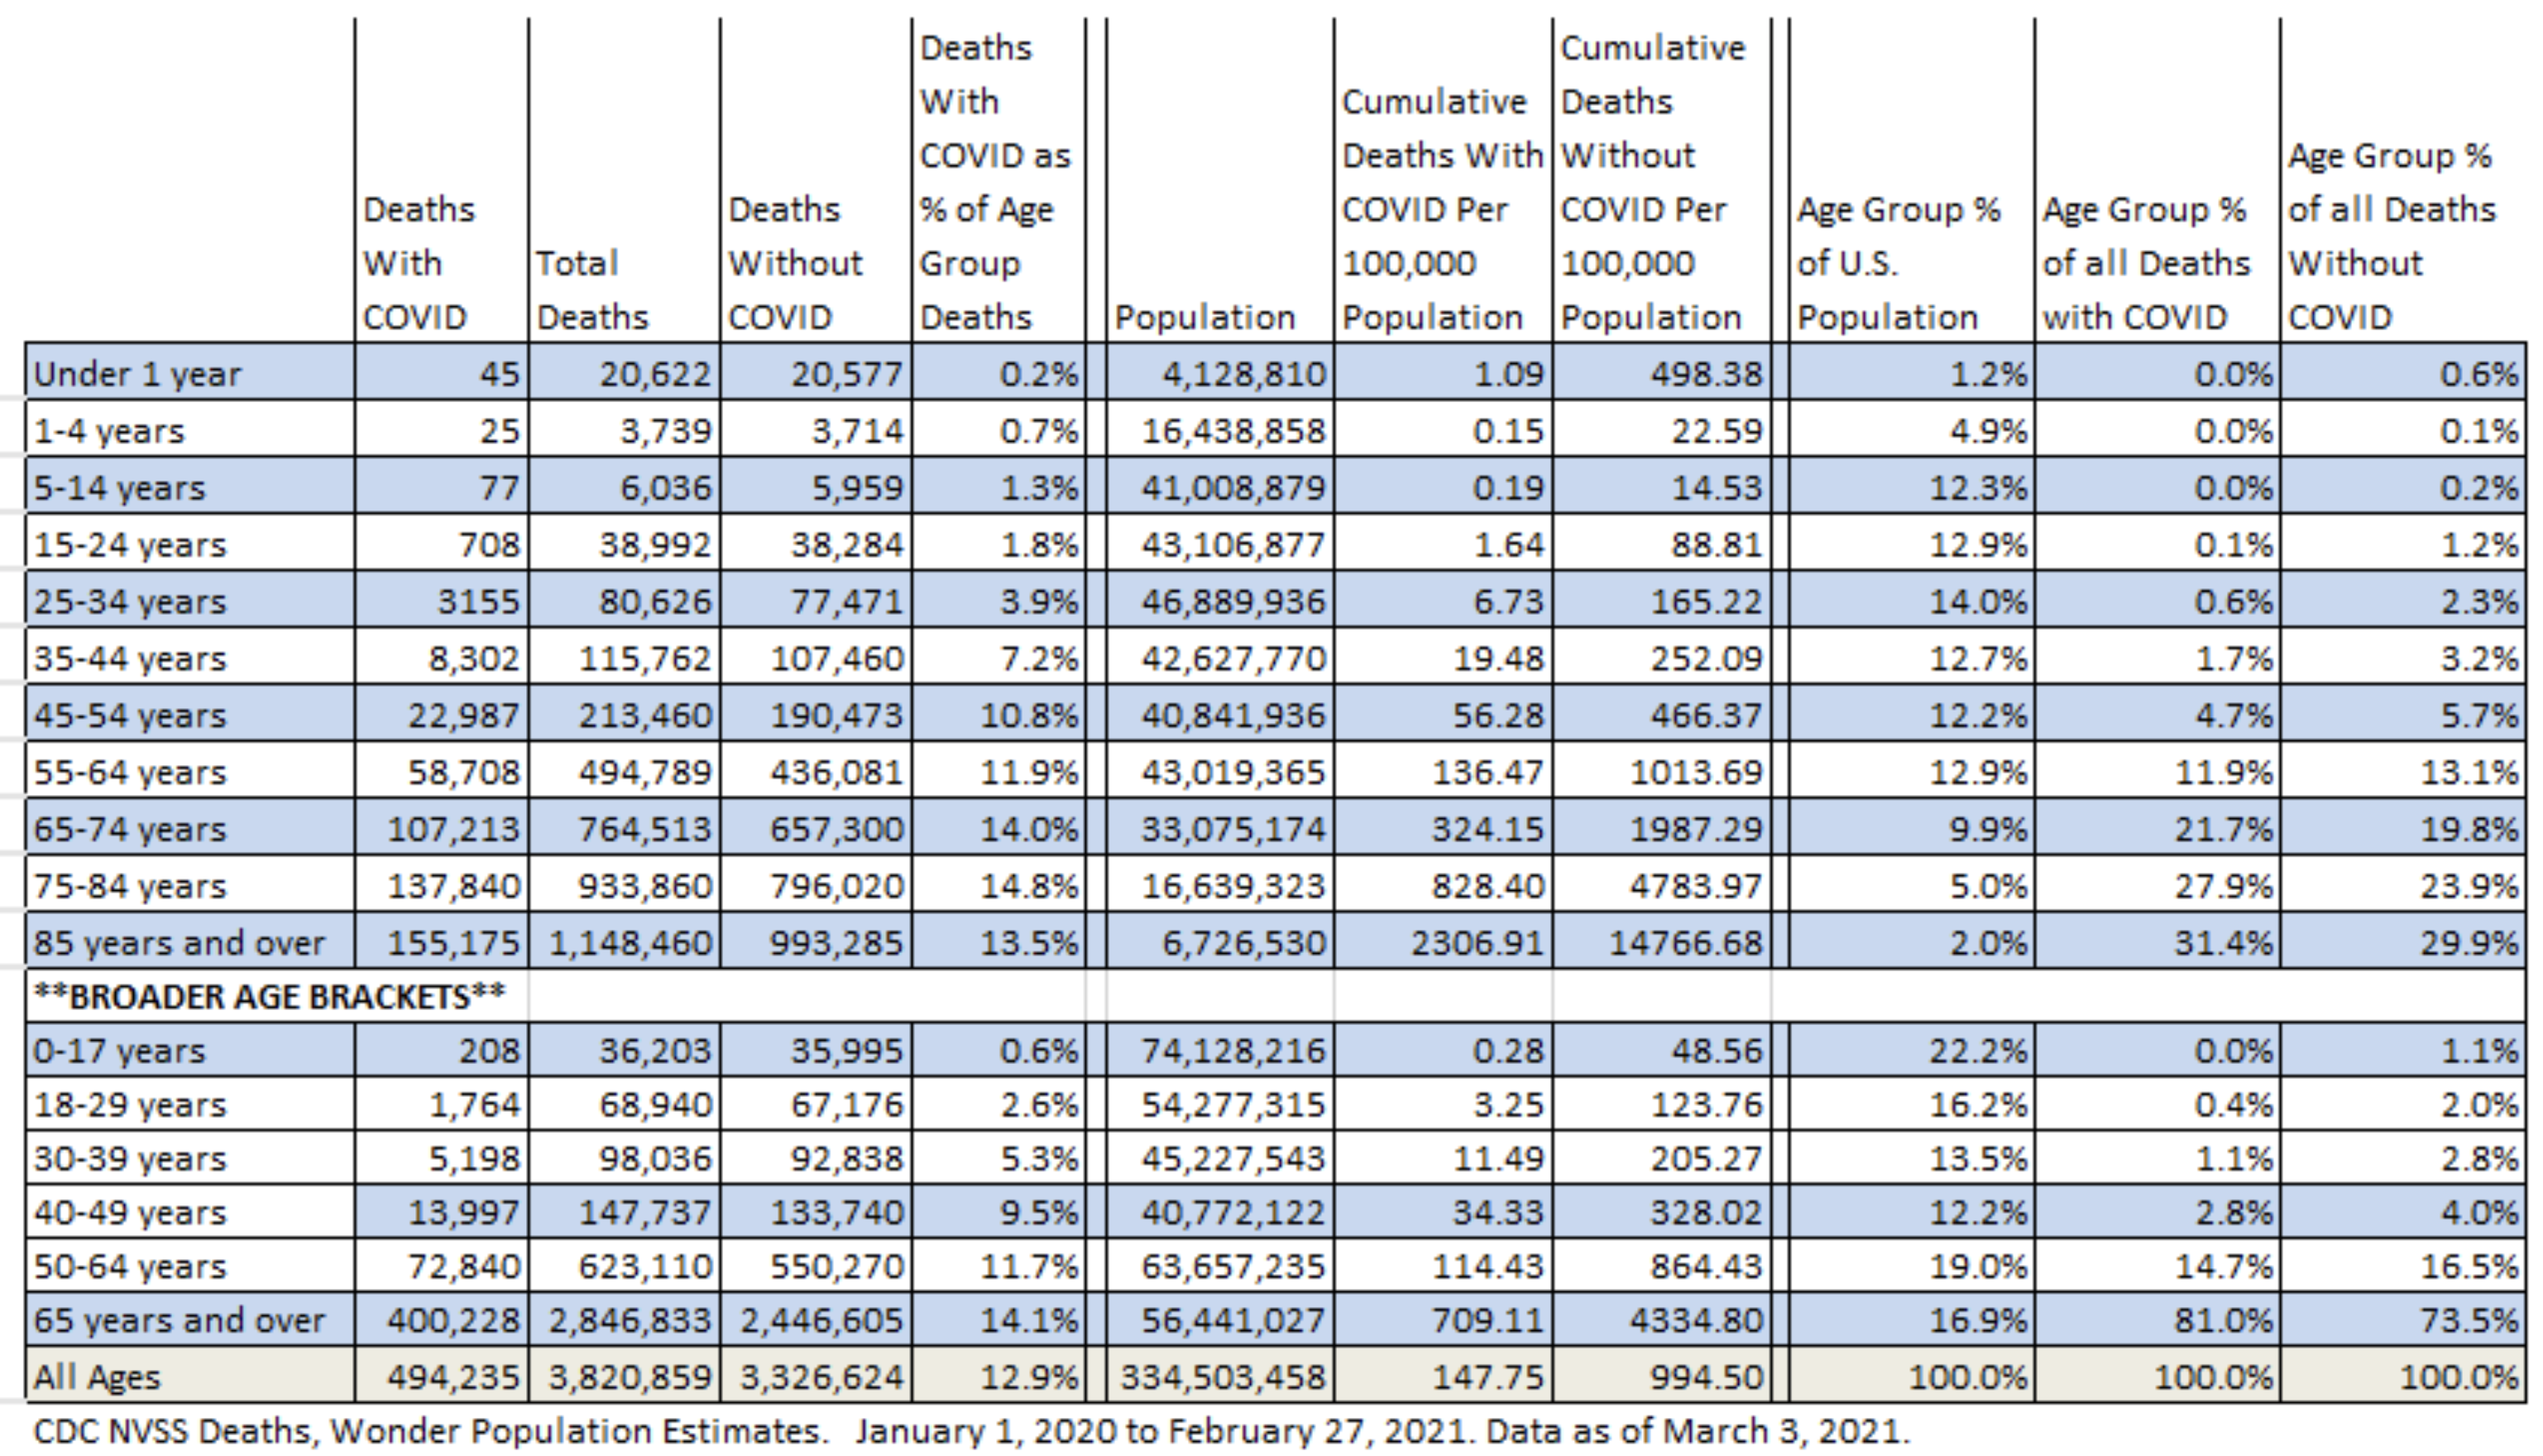
Thanks to Phil Kerpen on Twitter for the chart. Can you say bifurcation of outcomes? There are any number of lessons you could take from the chart, but the main one is that this really has only been an epidemic among the elderly, especially when you consider the unprecedented method of attribution of death and the substitutive effect for flu deaths. It never, never, never was justified to close schools and shut workplaces.

Do any states provide data on both age and facility status? For instance, Are a large percent of the <75 deaths also potentially residing in facilities due to multiple chronic illnesses (aka overall poor health)? My state, Virginia, has the data separated, but it would be interesting to note again how one's functional status plays a part in the number of deaths of those <75yo.
Minnesota breaks out deaths in long-term care facilities, and I think most states do as well. In addition the CDC breaks out place of death by state. The CDC and most states also have some information on health status of decedents. As you would expect, the more chronic conditions, especially those related to obesity, like diabetes, heart disease and hypertension, the more likely you are to have serious illness and die.