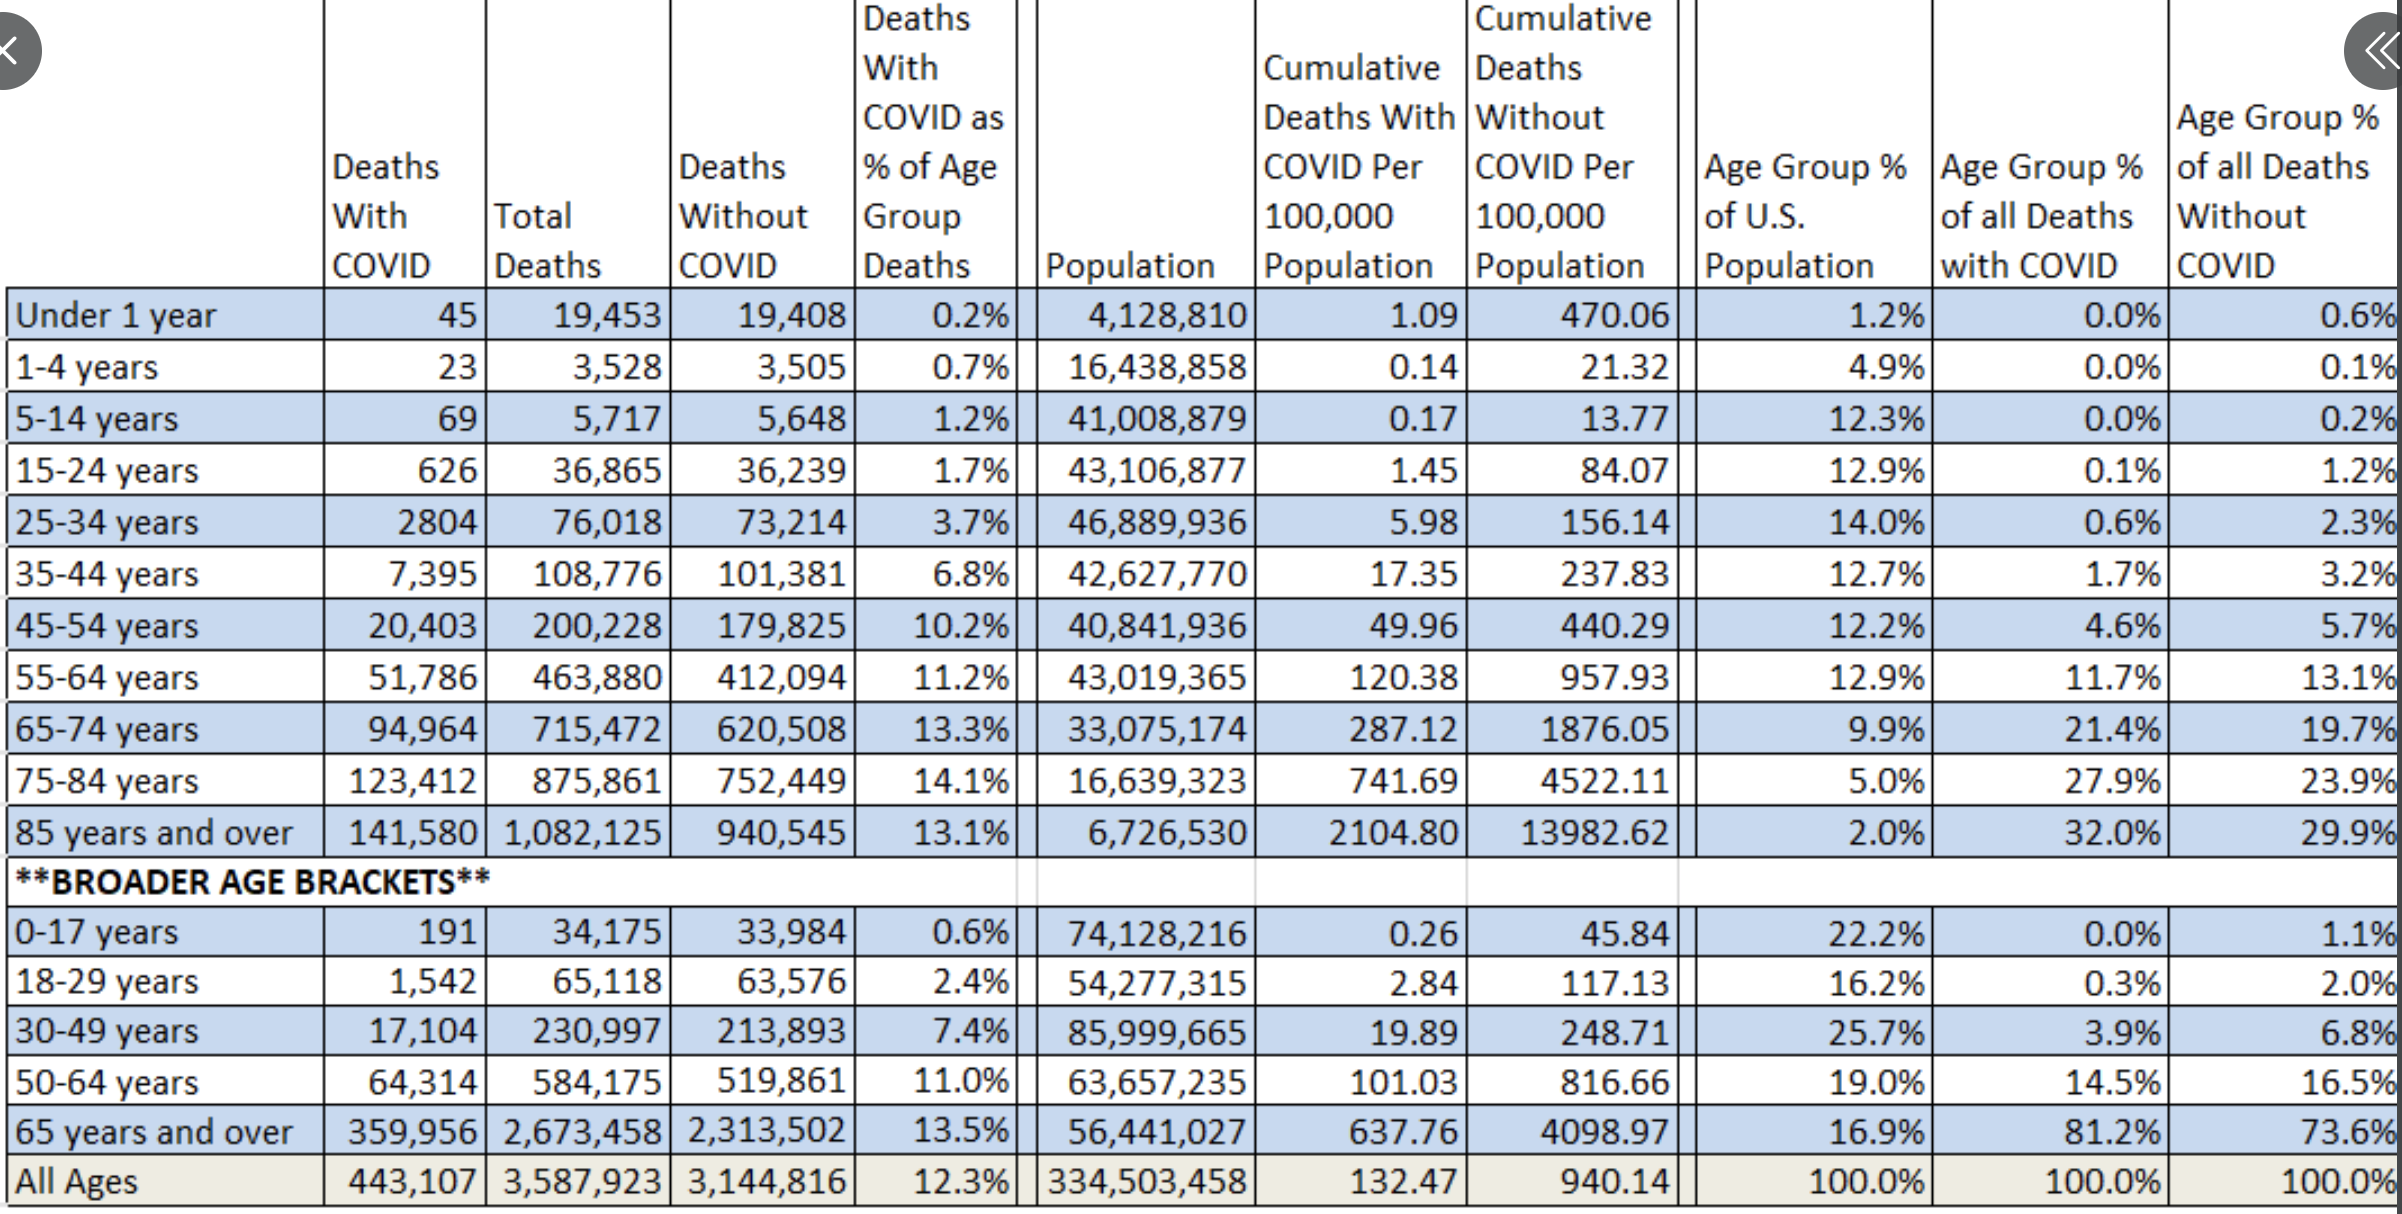
This one comes courtesy of the CDC and Phil Kerpen on Twitter. I would encourage you to study each column carefully. You can see the almost non-existent effect on younger age groups. Not until over age 65 does CV-19 (again remembering that death attribution to CV-19 is incredibly liberal and unprecedented) become a greater percent of deaths in an age group than the age group’s percentage of the population. And then look at the over 85 group. That is where the deaths are really concentrated. Again, the message I take away from this is that we have shut down an entire country based on a disease that affects the small percent of the population over age 75.