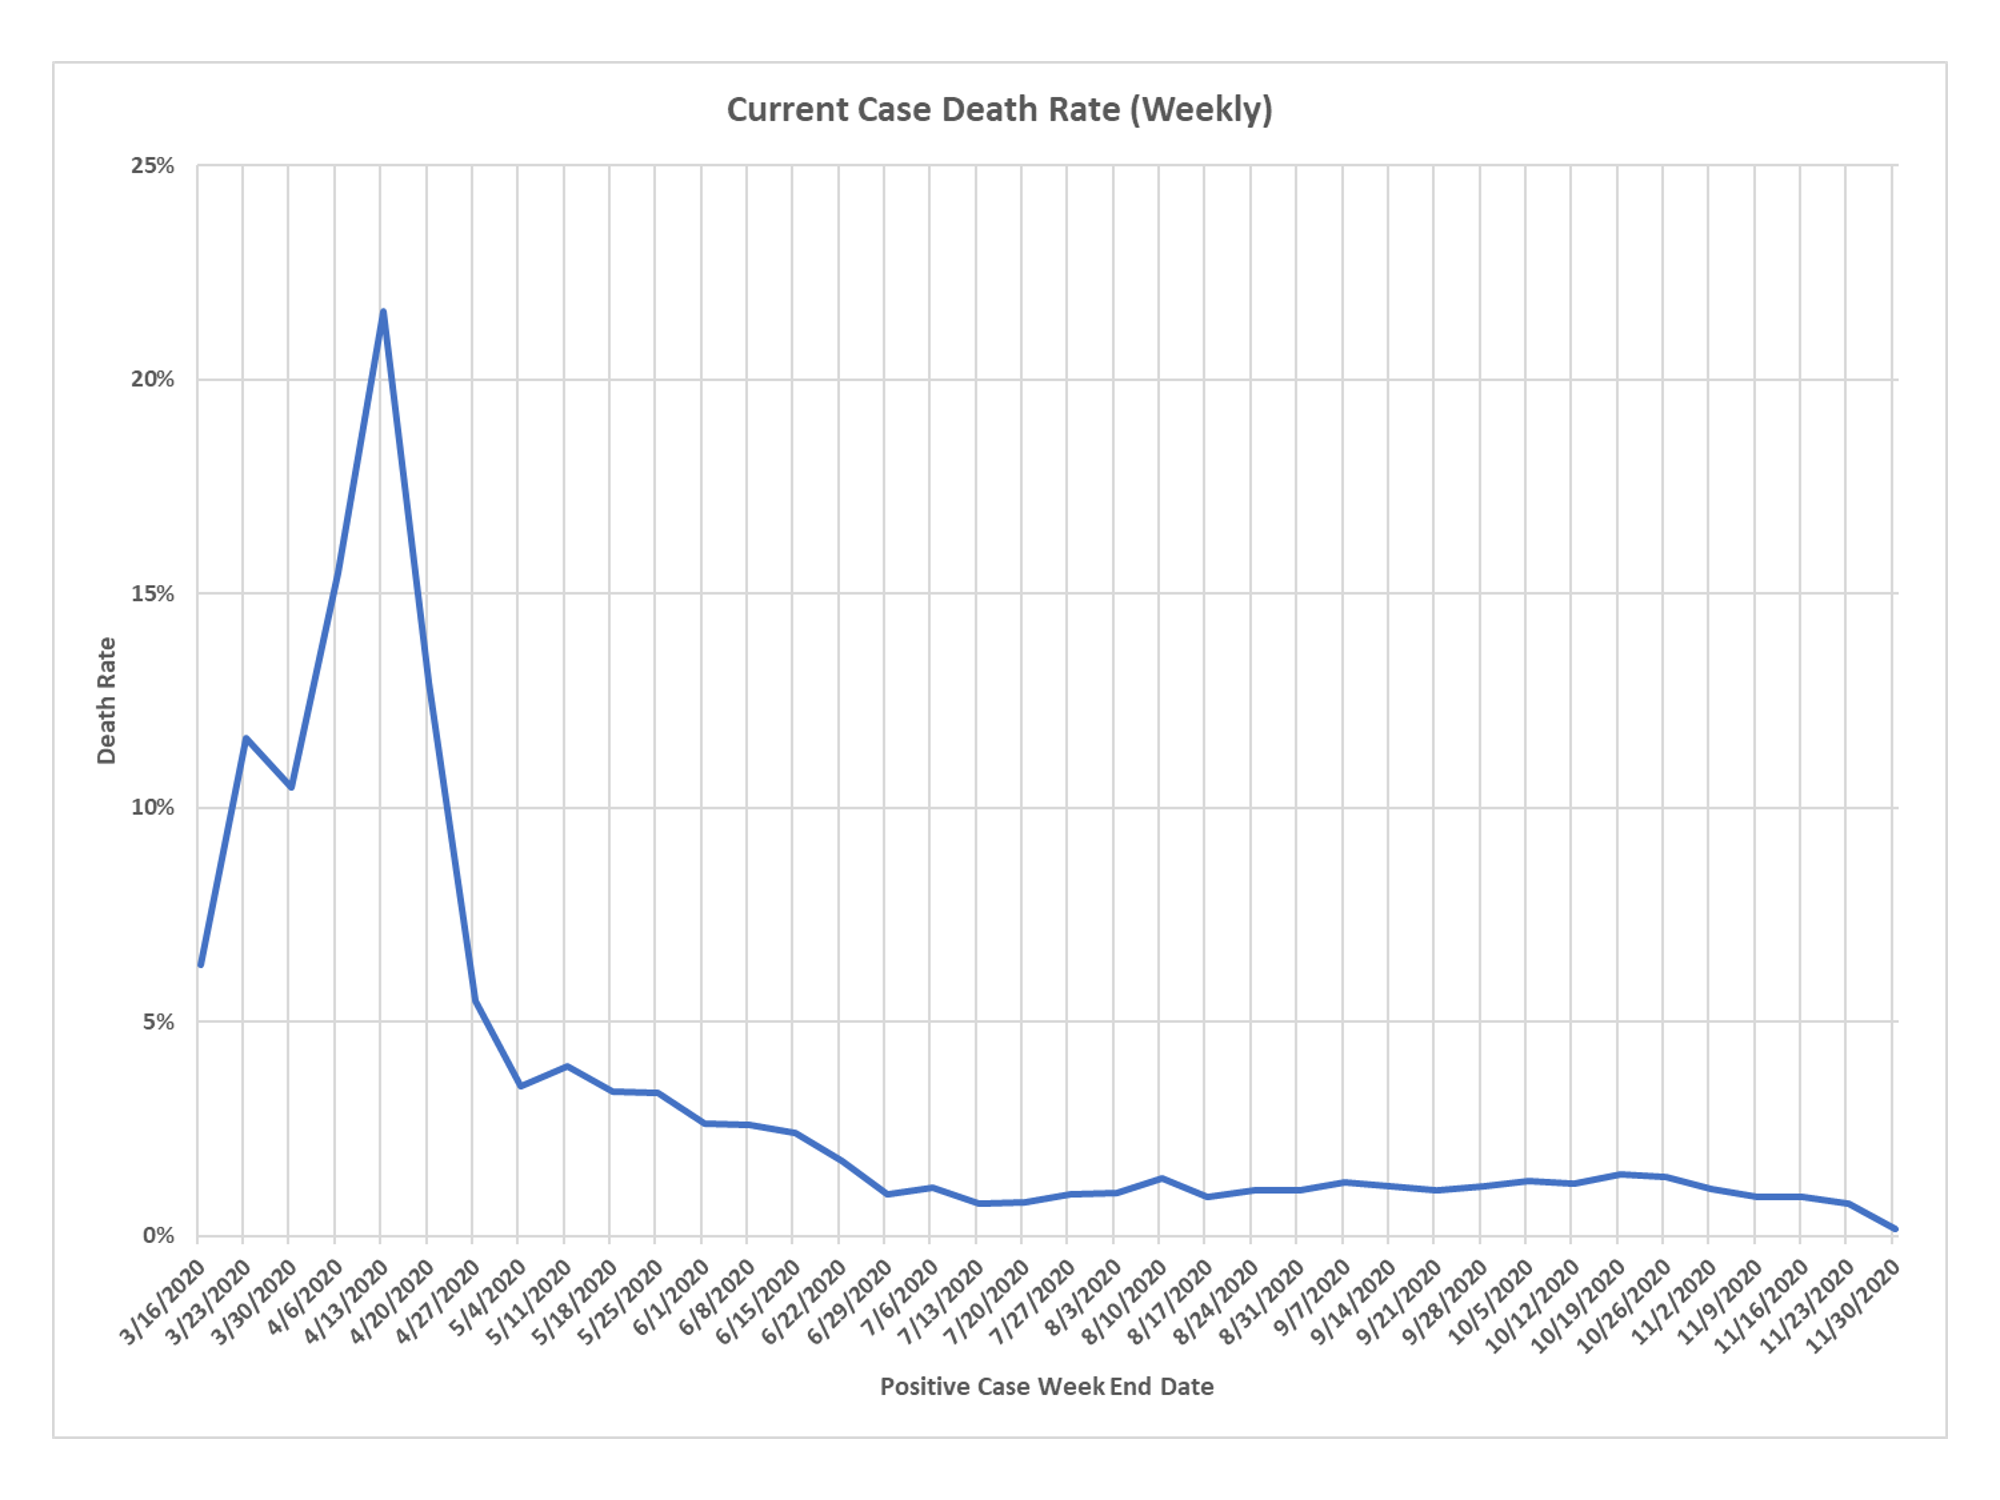
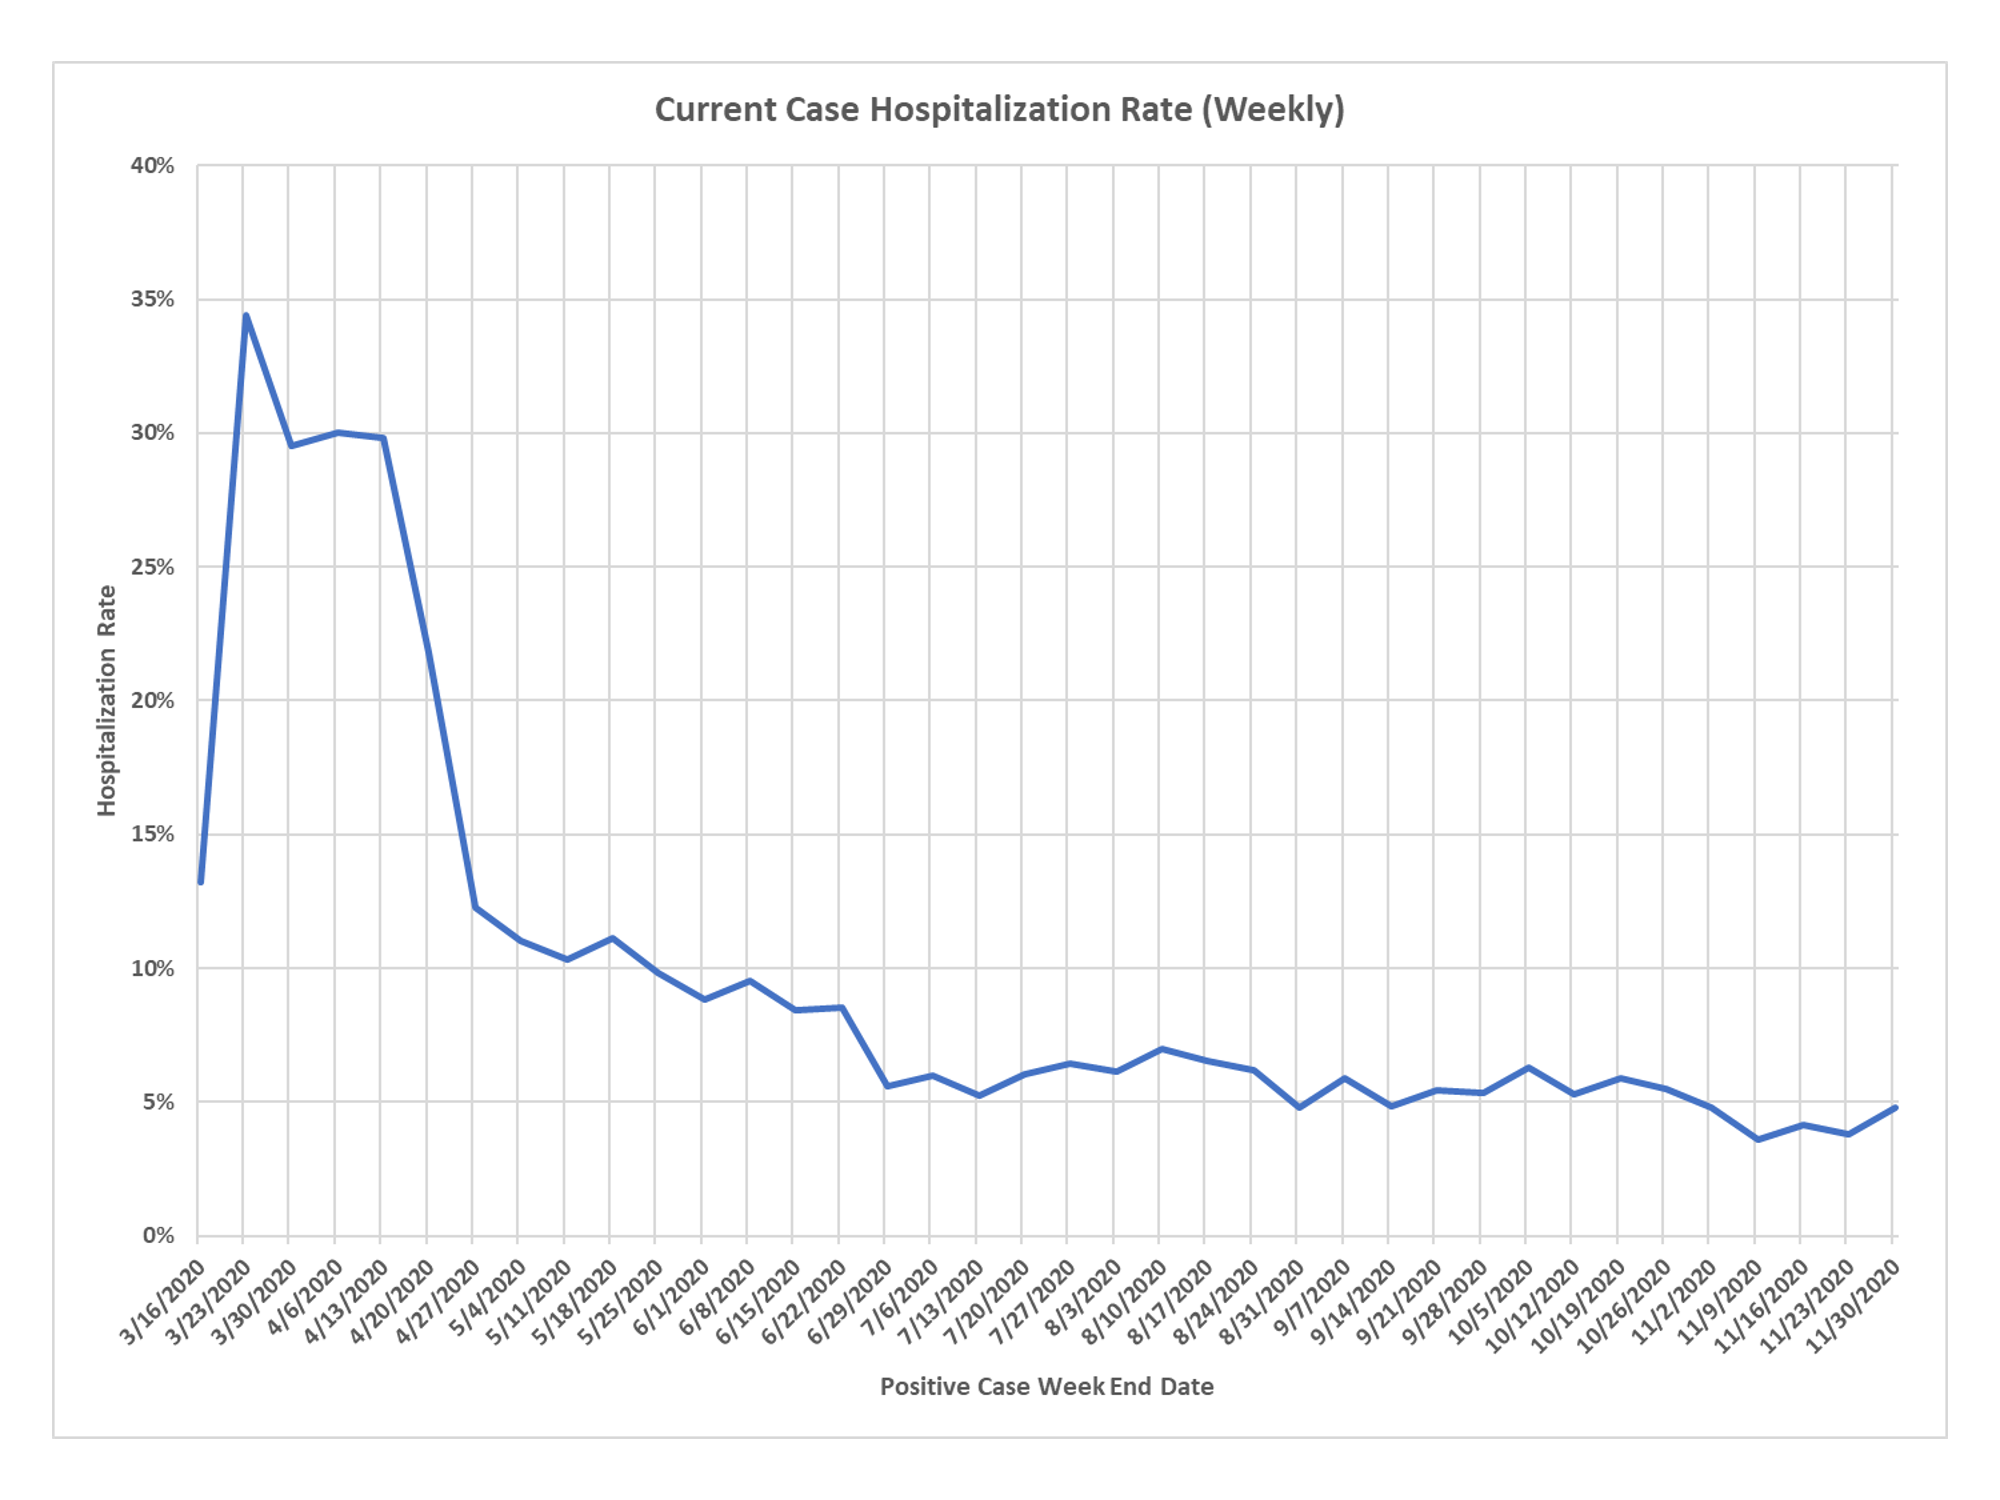
DD deserves my endless thanks for all the work he has done to put my feeble ideas into better analytic and visual form. Here are updated charts on the cohort analysis, which you will recall takes deaths from a week, as compiled by the CDC, and finds the corresponding cases and hospitalizations, based on median lag times. The rate trends you see are the most important markers of how outcomes from CV-19 are trending. The high death and hospitalization rates in the spring were almost certainly due to lack of detection of cases, in fact, one way to normalize cases would be to hold hospitalization and death rates equal throughout the epidemic, but that might hide true trends in cases and outcomes. There likely have been some improvements in treatment that lessen mortality. There also may be more hospitalizations due to remdesivir and financial incentives, but length of stay has very clearly dropped.
What is quite apparent, despite all the hysteria, is that neither the hospitalization rate nor the death rate as a function of cases has risen, in fact both have been remarkably steady. Hospitalizations have a slight decline in the fall and early winter. Also, keep in mind that the most recent CDC and other study data suggests that we are still detecting perhaps only 20% of cases at best, and more likely 15%. So those death and hospitalization rates you see starting in late summer to now should be adjusted downward. The true hospitalization rate is probably 1% or less and the true death rate around .2%. And of course, the age structure analysis that we do regularly shows the extreme difference in those rates at the opposite ends of the age spectrum.

I have also wondered if the hospitals are releasing people, especially back to assisted livings, where the deaths have been two thirds of the body count here in Minneslowta. Would they release so that they could make beds available which has been one of the dept of deaths mantra? Why cant they follow science and figure out why the assisted livings are so affected, another mantra that we were to take care of the vulnerable. They have been wearing masks and locked down, surely that should make a difference (sarcasm). Who is getting in to infect them and why havent measures been put in place to stop the incursions? There would hardly be any number of deaths in this sorry state without the two thirds of dead elderly people that the dept of death has allowed to die alone.
Thank you and may your family have a blessed Christmas together. We will
Related to Dan’s question, why doesn’t the DHPH provide figures on the number of influenza deaths at LTC’s? Or has Congress beaten influenza by making it more lucrative for someone to be classified with cv19 instead?
well if someone had flu and CV-19, the hospital will still get paid more. I suspect we can dig out from past years the number of flu deaths among LTC residents, let me poke around on that.