The Upper Midwest got the first real case surge of the fall. Has to be some seasonality/geographic combination of factors. While the case curves look a little different, pretty much the surges began at a similar time and sank at the same time. Given the variety of mitigation measures employed in these states, it suggests that those don’t have much, if any, impact. It also is interesting that the states with higher peaks now, had much less of a case swell in the spring. And this seems somewhat tied to the density of population, with the more densely populated states typically having had more cases in the spring and summer and not quite as many per capita in the fall. As I have said, I suspect that every one will end up in pretty much the same place in terms of per capita cases. And if you took out the kinks from weekends, holidays, and other testing goofiness, and the fact the this underlying data is date of report, I believe, all these curves in the fall look pretty typical of epidemic curves in the absence of mitigation. (Twitter Link)
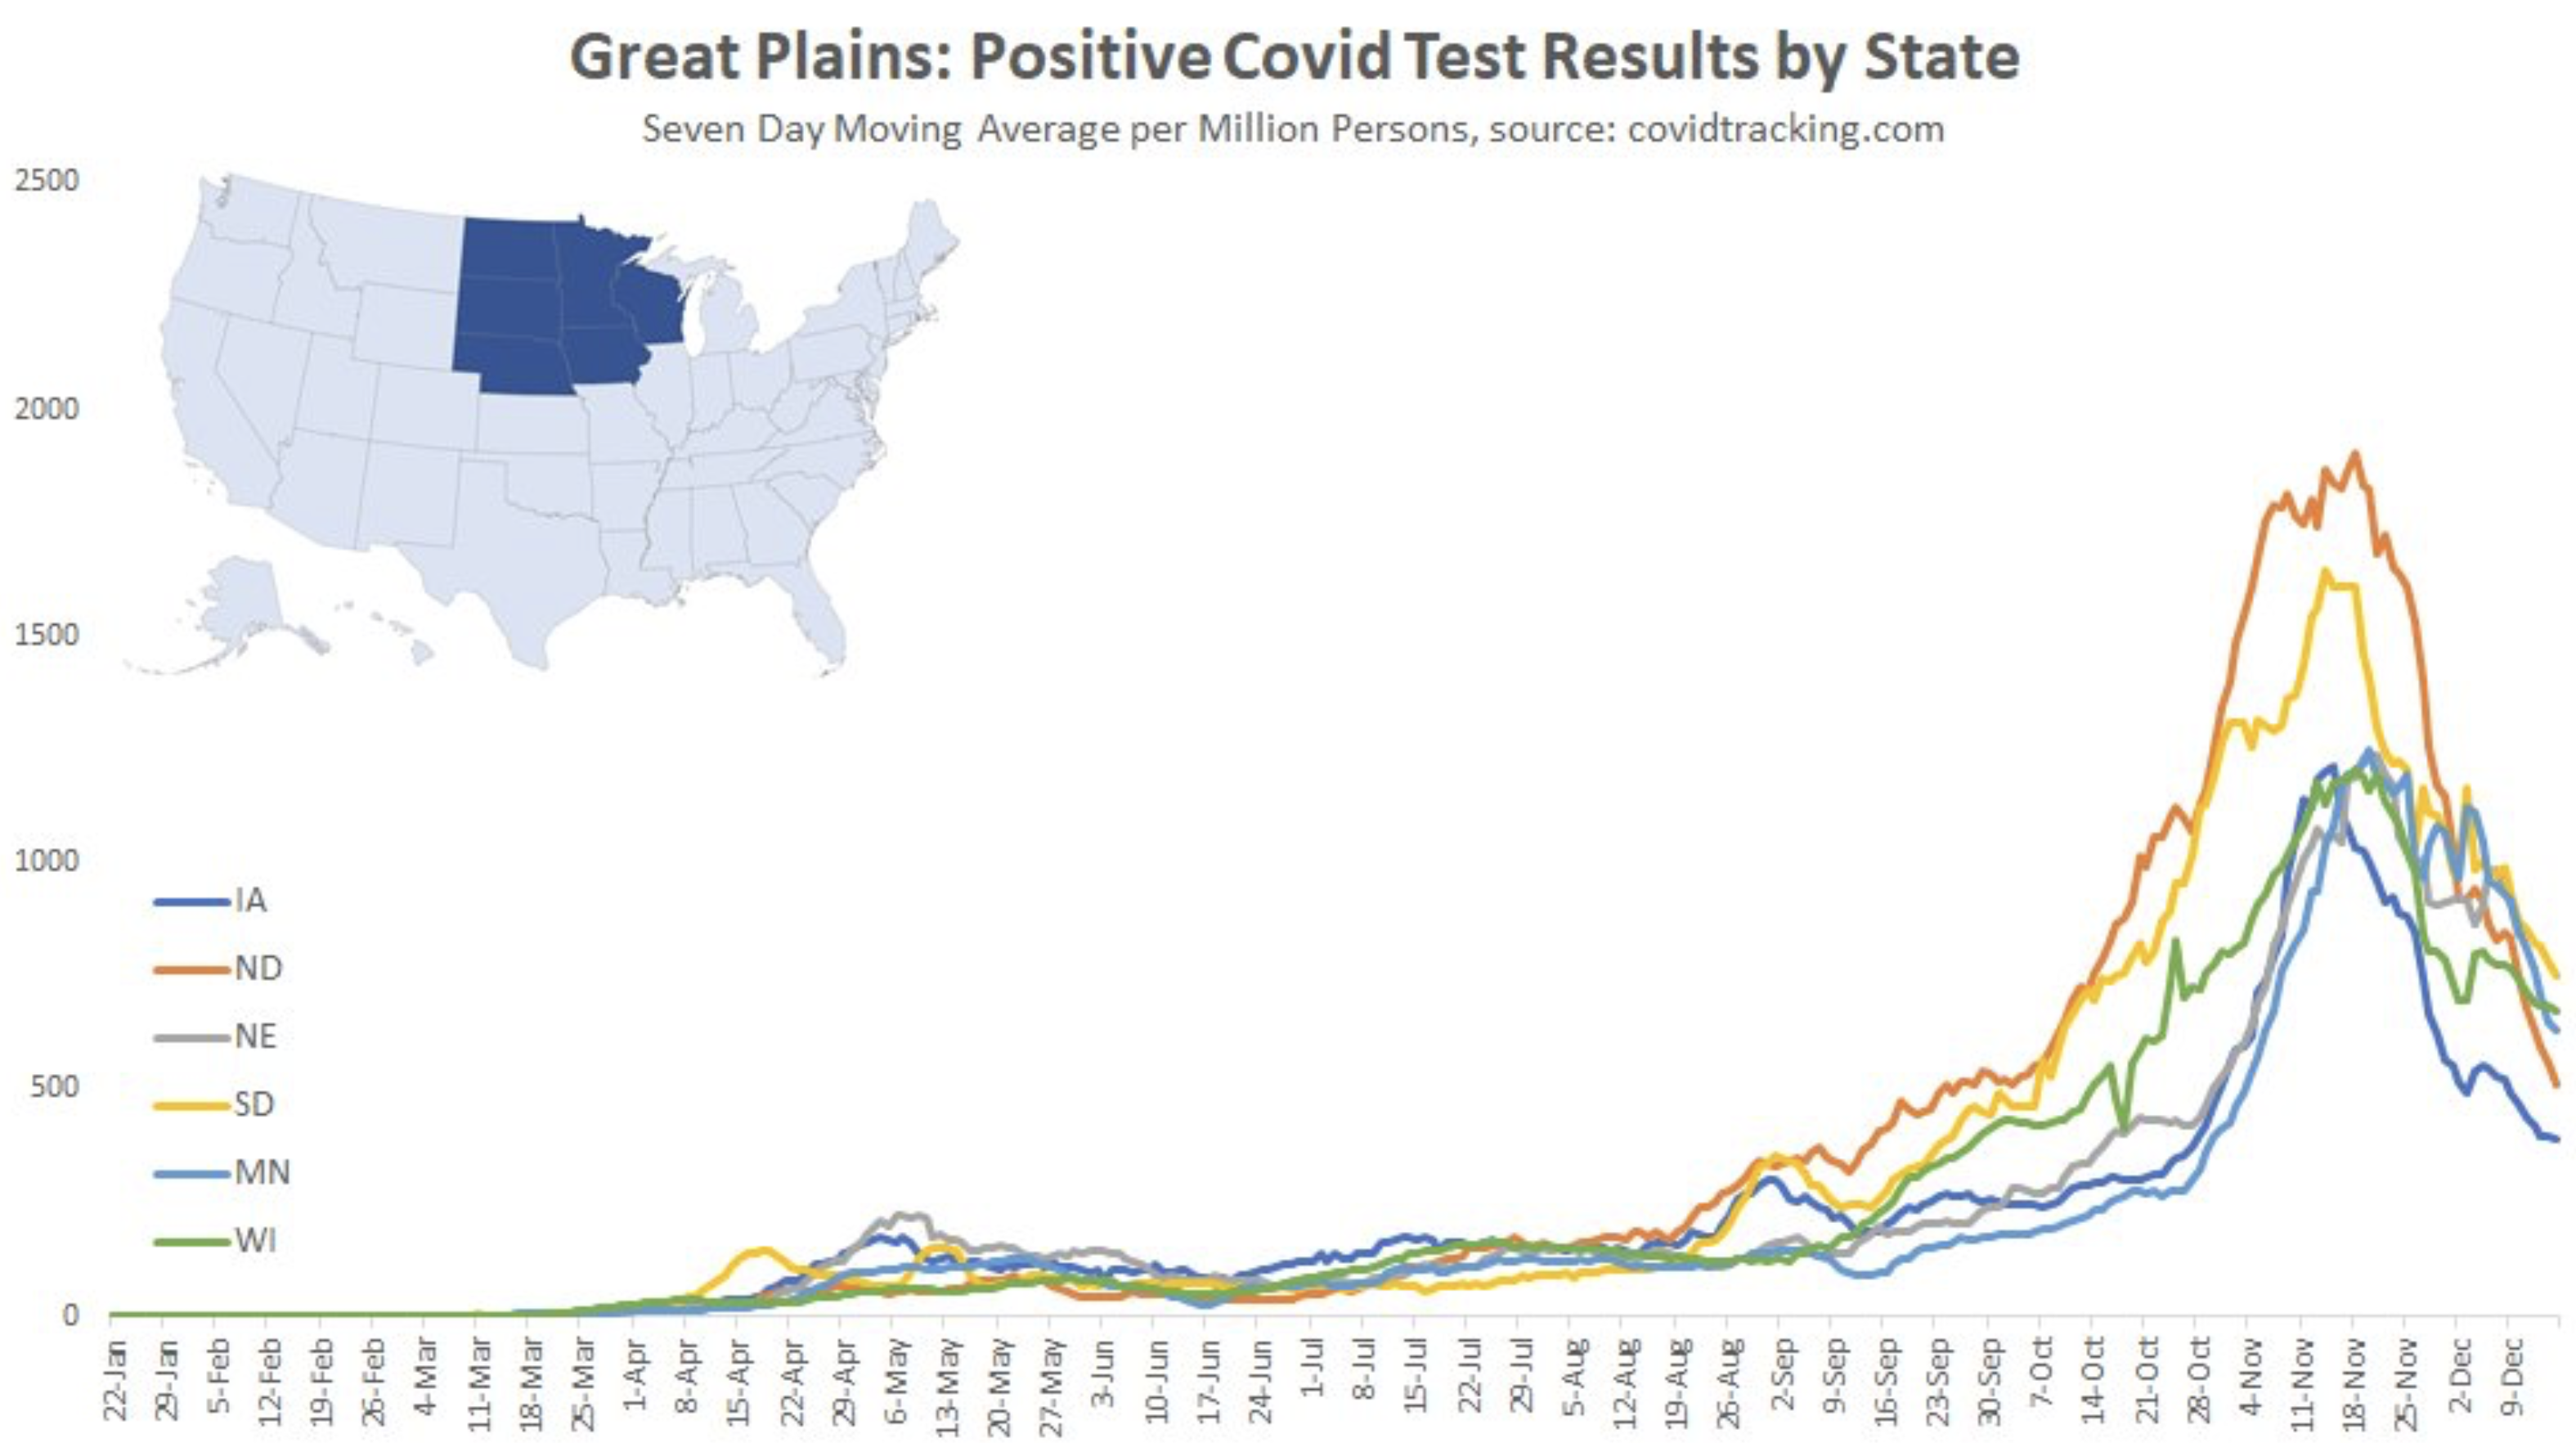

This a great plot, but you can also clearly see the impact of small population size in the Dakotas on the normalized case counts. My suspicion is that these curves would all lay right on top of each other if this could be properly accounted for. Each of the Dakotas has roughly similar population totals < 1 million vs 5.6 Million in Minnesota. The impact of one large family get together has a huge impact on a smaller base.
I thought the pcr tests were bogus? Are they? Didn’t the inventor say they were not for diagnosing? Weren’t people getting positive results from sterile swabs?